

 PDF
PDF ePub
ePub Citation
 Print
Print


INTRODUCTION
Currently, gypsum models are used to construct dental prostheses. Such models are trimmed first, and then wax is directly engraved using the model abutment. Next, the prosthesis is fabricated using typical investment, burn-out, and casting methods.123 However, this traditional manufacturing process is complicated and time-consuming. Since the recent introduction of dental computer-aided design and manufacturing (CAD/CAM), clinicians have been able to manufacture various prostheses more easily.456 Specifically, CAD/CAM systems reduce both time and cost by simplifying the work and considerably improving the working environment of prosthesis manufacture. Indeed, CAD/CAM systems have already made a large impact in the field of dentistry.
CAD/CAM systems for prosthetic manufacturing are generally categorized in terms of model design. To use CAD/CAM systems, clinicians obtain scan data with a dental scanner.789 In this regard, the most commonly used scanners are extraoral and intraoral scanners.101112131415 Extraoral scanners to obtain three-dimensional (3D) data are laser, optical, white light, and blue light model scanners.
Although great progress has been made in the field of oral scanners, several issues remain unresolved. In particular, it is difficult to obtain consistent quality data because of patient movement, oral saliva, and the humid oral environment.1316 However, new model scanners are continuously being developed to mitigate these problems, and many studies have reported clinical evaluation using stability measurements.1011131417181920 Model scanners are usually laboratory-based, with the most commonly used being laser model scanners and optical model scanners. However, the scanning speed of the laser model scanner is slower than that of the optical model scanner.21
The blue light model scanner has been widely used clinically, as well as in many studies focusing on the accuracy of scanning data. It has better accuracy than white light scanners. 11 The stability of the blue light model scanner has been evaluated using the test methods described in ISO 12836, which focuses on the repeatability and reproducibility of data.182022 Specifically, Jeon et al.18 reported that the scanner's data were repeatable and reproducible within a margin of 10 µm, and that it was capable of scanning the entire scanning platform, regardless of the number of abutments. However, no validated studies have evaluated the accuracy of the scanner when scanning multiple abutments simultaneously.
In the present study, we evaluated the reproducibility of the blue light scanner by simultaneously scanning one, four, and eight abutments on a multi-die tray. The null hypothesis was that there is no difference among the three groups scanned.
MATERIALS AND METHODS
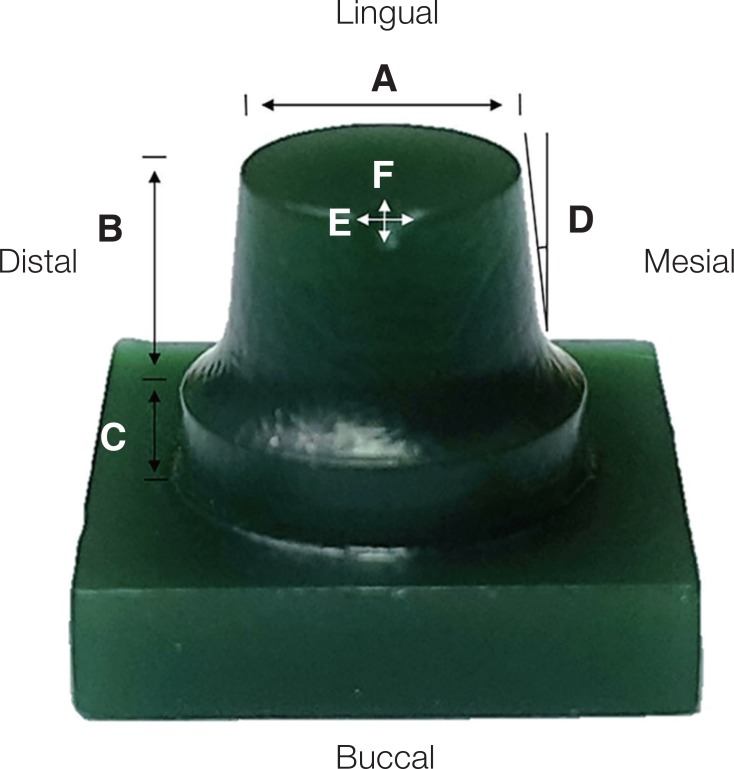
The master die used was referenced as the posterior abutment. The occlusal surface width was 6 mm and its height was 5.2 mm; the axial wall was milled by 6°. The die was designed using software that was set up with the chamfer margin. The designed abutment was manufactured with Wax Block (D-max, Seoul, Korea) using a milling machine (DWX-50, Roland DG Corporation, Shizuoka, Japan). The prepared wax milling abutment was constructed with a triangular notch that had an additional width of 1.5 mm and a length of 1 mm on the bucco-occlusal line angle (Fig. 1).
A piece of silicone (Deguform, Degudent GmbH, Hanau, Germany) was prepared from the main model, and a scannable die stone (Esthetic-base gold, Dentona AG, Dortmund, Germany) was poured onto the prepared silicone for duplication. The stone was mixed for 60 seconds at a mixing ratio of 50 g/10 mL. Ultimately, nine study dies were constructed. The first of these nine models was defined as the reference model. It was placed and scanned on the multi-die tray of a blue light model scanner (Identica Blue, Medit, Seoul, South Korea). The scanned files were saved as stereolithography (STL) files.
The OS, FS, and ES groups were scanned as follows: the abutments in the OS group were scanned one by one on the multi-die tray. Those in the FS group were scanned in groups of four on the multi-die tray, while those in the ES group were scanned in groups of eight on the multi-die tray.
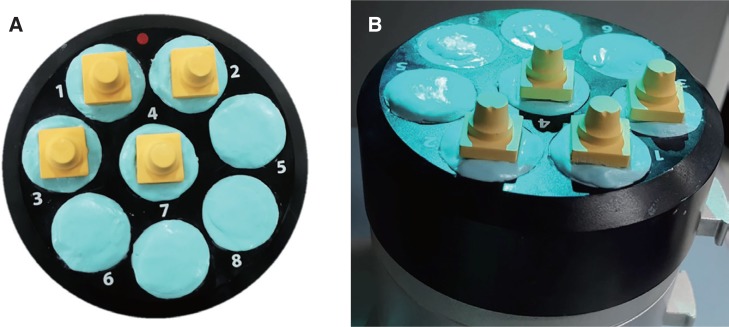
In the OS group, the second to the ninth die models were arranged and scanned one by one on the multi-die tray. Eight series of 3D data were acquired and stored as STL files (Fig. 2, Table 1).
In the FS group, the second to ninth die models were placed in the multi-die tray. The second to the fifth study dies were scanned first, followed by the sixth to the ninth dies. During these scans, the abutments were arranged on the first to fourth positions of the multi-die tray. After scanning, the 3D data were saved as STL files (Fig. 3).
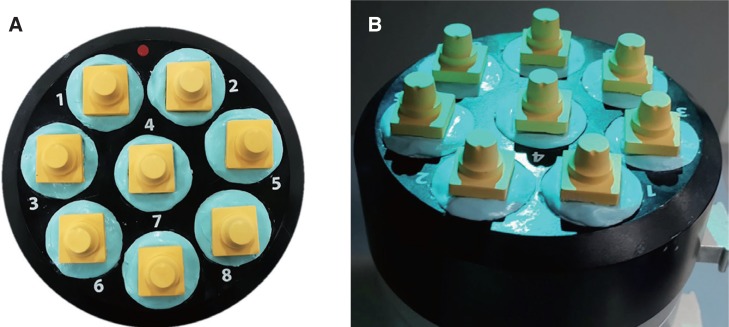
In the ES group, the second to eighth study dies were placed in the first to eighth positions of the multi-die tray. They were then scanned once to obtain the 3D data sets, which were saved as STL files (Fig. 4).
Before superimposing the processing of the reference study dies of the three groups and their 3D data, every 3D data point 1 mm below the margin, which is an unnecessary structure, was eliminated.
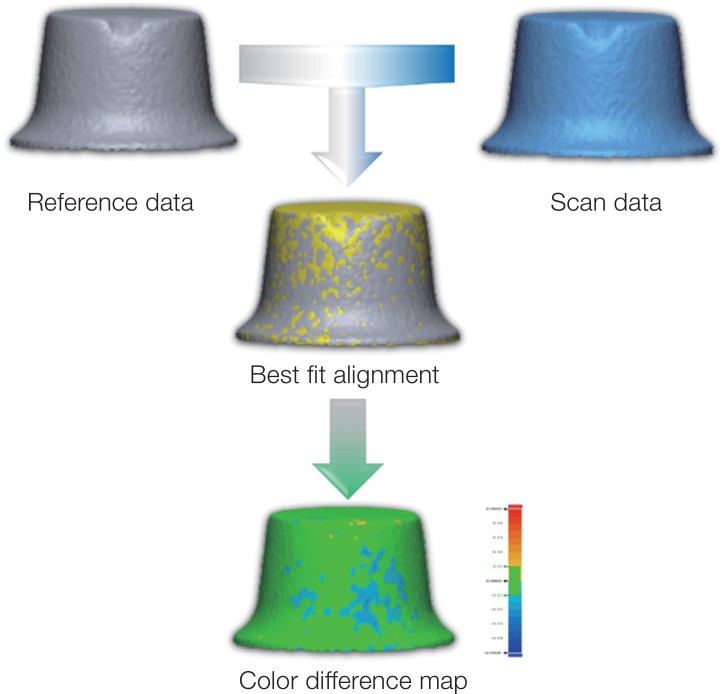
The data were analyzed using 3D software (Verify, Geomagic GmbH, Stuttgart, Germany) to test for reproducibility. Both the reference and 3D data from the three groups were superimposed and analyzed. Specifically, the 3D software was used to calculate the best-fit alignment of the reference and data abutments of the three groups, and a color-difference map was subsequently composed and analyzed (Fig. 5). The data were calculated using root mean square (RMS) values.
A normality test was also conducted. However, the conditions for normality were not met. Therefore, non-parametric data were assessed using the non-parametric Kruskal-Wallis H test and the Mann-Whitney U-test (α = .05). The Mann-Whitney U-test with Bonferroni's correction was used for post-testing (P < .05/3 = 0.017).
RESULTS
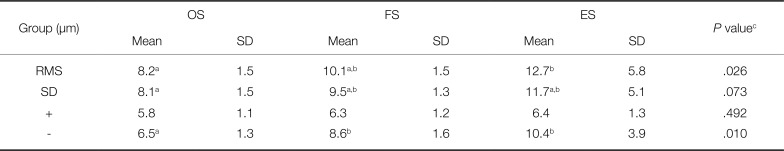
The RMS, standard deviation (SD), and average data point values of the three groups are listed in Table 2. The OS group showed the most repeatable values, while the ES group exhibited the worst RMS, SD, plus average, and minus average data point values. The RMS and minus average showed statistically significant differences among the three groups (P < .026 and P < .010, respectively). However, the SD and plus average did not show any statistically significant differences (P > .073 and P > .492, respectively).
In the post-test, the OS group did not differ from the FS group, nor did the FS group differ from the ES group. However, the OS group differed significantly from the ES group.
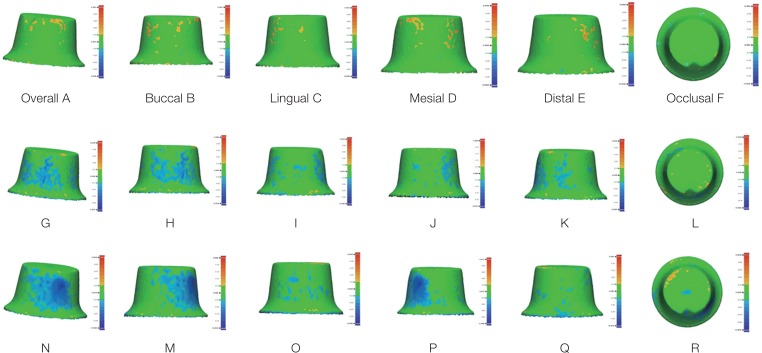
Fig. 6A – 6R show the abutment color-difference map after superimposition processing in the OS, FS, and ES groups. The OS group indicated mostly positive values at the axial wall surface areas, but a few negative areas were also observed (Fig. 6A – 6F). In addition, the green (no error) area was dominant. The negative part of the axial wall was more predominant in the FS group than in the OS group, while the positive fraction was lower (Fig. 6G – 6L). In the ES group, the negative section of the axial wall was larger than in the OS and FS groups (Fig. 6N – 6R).
DISCUSSION
The blue light scanner used in this study provides more data than the conventional laser scanner, and it shows better repetition and reproducibility than the white light model scanner.11 The blue light scanner uses incident light in a grid or striped pattern on an object, and data are acquired using two cameras.23 It can acquire a large amount of data in a short time.
According to the ISO 12836, repeatability is defined as the ability to repeatedly measure a parameter at a particular location, while reproducibility is defined as the ability to evaluate measured data in different locations. In the present study, the range of the color difference map bar was set from +50 µm (blue to dark blue) to −50 µm (red to yellow). The range of clinical application was set from 10 to −10 µm.11 The clinical application range is the range shown in green color. This range indicates that there is little error between reference and scan data. Therefore, the wider the range expressed in green color, the more accurate it is.
Using the blue light model scanner, Jeon et al.11 reported that repeatability values of canine, premolar, and molar scans were approximately 4.4, 2.9, and 3.2 µm, respectively, and that these had excellent reproducibility values of 9.8, 10.6, and 11.2 µm, respectively. Previous studies have also shown that blue light model scanners can be used clinically to produce final prostheses.2425262728293031 Repeatability has been well established, but reproducibility depends on the position and size of the model.1120
In the present study, the reproducibility of the blue light model scanner was evaluated using various arrangements in the non-contact scanner. Specifically, the scanner used in the present study can scan many abutments simultaneously, and reproducibility was evaluated by increasing the number of abutments in three stages and dividing the data into three groups. The null hypothesis was rejected.
Statistically significant differences were observed among the three groups. In particular, the OS group, which was arranged in a sequential order, showed the best repeatability, with an RMS value of 8.2 µm. It also exhibited the highest reproducibility among the three groups. Furthermore, green was the most dominant color in the color difference map.
In the FS group, the RMS value was 10.1 µm. It displayed less accurate reproducibility than the OS group, but did not show any significant difference from the ES group. A negative error was observed in the axial wall of the color difference map.
In the ES group, the RMS value was 12.7 µm, and it exhibited the least accurate reproducibility. A significant difference was observed in the OS groups. In addition, both positive and negative portions were observed on the occlusal surface of the ES group. Nonetheless, in all three groups, the green area was mostly in the chamfer and margin areas, and the positive and negative parts were not generated more than the other parts.
In light of the reproducibility of the conventional blue light model scanner, it can be hypothesized that an RMS value of 12.7 µm indicates a clinically usable device. However, this constitutes a difference of approximately 4 µm from the OS group, and the ES group exhibited the largest error. The light transmission and scattering of light on the same abutment position likely affected the surrounding abutment.111932
Thus, it became more likely that an error would occur as the amount of the data per unit area was increased. The OS and FS groups showed lower error because they necessitated a smaller amount of data than the ES group. In all three groups, there was an error in the axial wall area because it was wide and rounded, unlike the flat occlusal surface. Therefore, we believe that this error occurred when 3D data were acquired. In previous studies involving a single abutment and full arch model, the RMS value during reproducibility evaluation was approximately 10 µm.11 In contrast, the full-arch model showed a value greater than 100 µm.20 Therefore, we reason that a large error occurs when scanning a greater number of objects, or an object that requires more complicated maintenance.
Recently, an increasing number of studies have addressed 3D measurement in the field of dentistry. In the present study, nine identical stone abutments were fabricated from one duplicable silicone replica. In addition, we used scan-only stones to evaluate accuracy by increasing measurement reliability. This study is meaningful because it attempts to reduce error in the final restorations by decreasing errors in the scanner.
When preparing the abutment teeth, a triangular notch, with a width of 1.5 mm and a length of 1 mm, was made on the occlusal buccal region. Thus, we could identify the exact position of the notch when superimposing the reference 3D data and scan data. The difference in the length and width made the superimposing process effective.
The present study may not be generalizable because it did not use the actual form of the tooth. To evaluate accuracy in terms of the size of various abutments, future studies should evaluate various parts using abutments that are similar to those of actual teeth.


 XML Download