

 PDF
PDF ePub
ePub Citation
 Print
Print


INTRODUCTION
Liver fibrosis precedes cirrhosis in the natural history of chronic liver disease (CLD). Diagnosis of liver fibrosis in patients with CLD is critical, as untreated fibrosis increases the risk of cirrhosis, and end-stage liver disease, hepatocellular carcinoma or liver failure (1). Hepatic fibrosis is regarded as a dynamic process with potential for regression (23). Therefore, early and accurate assessment of the disease is essential to prevent and even reverse the process. Liver biopsy is regarded as the standard of reference for the diagnosis of liver fibrosis. By contrast, biopsy is an invasive procedure with life-threatening complications. Problems including sampling errors and inter-/intra-observer variability limit its application (45).
Several non-invasive techniques, including multiparametric magnetic resonance (MR) technologies, make the non-invasive evaluation of liver fibrosis a reality (67). Diffusion kurtosis imaging (DKI) is an advanced diffusion-weighted imaging (DWI) model that quantifies non-Gaussian behavior of diffusion, yielding a corrected apparent diffusion coefficient (ADC) as well as excessive kurtosis of tissue (8). A deviation from a simple mono-exponential decay has readily been identified in the liver. Thus, DKI provides an opportunity to investigate liver diffusivities and tissue microstructural complexity compared with conventional DWI (9). Our previous study also indicated that DKI may provide additional information and represents a valuable tool for the characterization of liver fibrosis (10).
However, routine MR signal measurements only provide mean values, which do not account for the underlying spatial distribution. MR histogram analysis is a new approach for quantification of the distribution of signal intensity of voxels using routinely acquired MR data, and refers to a mathematical approach to evaluate variations in gray-level intensity within a region of interest (ROI), which reflects histological heterogeneity (1112). MR histogram analysis facilitated the detection and staging of liver fibrosis, confined to the application of gadoxetic acid-enhanced MRI and conventional DWI (131415). Therefore, the purpose of this study was to investigate the diagnostic value of DKI histogram analysis in assessing and quantifying hepatic fibrosis, as well as the potential influence of inflammatory activity.
MATERIALS AND METHODS
Animal Model
Our institutional animal care and use committee approved this study. Thirty-six male, 8-week-old Sprague-Dawley rats (ca., 250–280 g) were randomly divided into four experimental groups (n = 6 per group) and one control group (n = 12). The rats in the experimental groups were treated with 50% carbon tetrachloride (CCl4) and olive oil intraperitoneally twice a week at a dose of 1.5 mL/kg, for 2, 4, 6, and 8 weeks, respectively. Rats in the control group were administered an equal dose of olive oil for 8 weeks (1617).
Image Acquisition
MRI was performed using a 3T scanner (Verio, Siemens Healthcare, Erlangen, Germany) with a phased-array animal coil with 4 coil elements (CG-MUC39-H300-AS, Siemens Shenzhen Magnetic Resonance Ltd., Shenzhen, China). DKI was performed with a single-shot spin-echo echoplanar sequence using tri-directional motion-probing gradients (3-scan trace mode) with 6 b-values (0, 200, 500, 1000, 1500, and 2000 s/mm2). Detailed parameters were as follows: repetition time/echo time 5100/96.8 ms, slice thickness 2.0 mm, interslice gap 0.5 mm, field of view 138 × 138 mm, scan matrix 148 × 148, half Fourier factor 7/8, GeneRalized Autocalibrating Partial Parallel Acquisition accelerated factor 2, average 4, total scan time 5 minutes 52 seconds.
Imaging Analyses
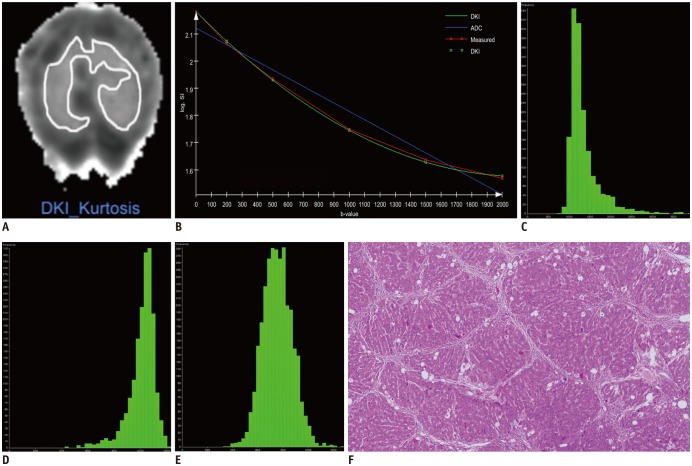
Digital Imaging and Communications in Medicine (DICOM) images from the DKI sequence were postprocessed using in-house software programmed in MeVisLab (Version 1.2.0; MeVis Medical Solutions AG, Bremen, Germany). This program was performed using voxel-by-voxel analysis, fitting diffusion-weighted signal intensities as a function of b-value using the equation: S = S0 × exp (−b × D + b2 × D2 × K/6), b represents b-value, D represents corrected apparent diffusion accounting for non-Gaussian diffusion behavior, and K represents excessive kurtosis (a unitless parameter representing the deviation of water motion from the Gaussian distribution) (918). The program also calculated ADC for each pixel using b-values 0–500 s/mm2 based on a standard mono-exponential fit with the equation S = S0 × exp (−b × ADC). Based on these calculations, the program output maps for D, K, and ADC were obtained.
Histogram Analyses
A prototype software (MR OncoTreat, Siemens Healthineers) was used for histogram analysis. DICOM data including D map, K map, and ADC map were loaded into the software. The histogram images were analyzed by a single radiologist (with 12 years of experience in animal abdominal imaging), who was blinded to the animal groupings and histopathology. ROIs were manually drawn covering the whole liver parenchyma on axial and multiplanar reconstruction images followed by segmentation. Care was taken to avoid large vessels, focal lesions and artifacts. Finally, voxel-based histogram data were generated for the ROIs, and the following parameters were calculated: mean, median, skewness, kurtosis, and the cumulative frequency distributions of 25th and 75th percentiles (Fig. 1).
Pathological Analyses
After MR examination, all rats were humanely sacrificed and the livers were removed. Liver samples were stained with hematoxylin and eosin Masson's trichrome stains. All pathological specimens were reviewed by a pathologist (with 20 years of experience in liver pathology). The fibrosis stage (“F” grade) and the inflammatory activity (“A” grade) were evaluated using the METAVIR scoring system (19). The degree of fibrosis was assessed using a scale ranging from 0 to 4: F0 = no fibrosis; F1 = mild fibrosis, portal fibrosis without septa; F2 = substantial fibrosis, periportal fibrosis and few septa; F3 = advanced fibrosis, septal fibrosis without cirrhosis; and F4 = widespread fibrosis, cirrhosis. The degree of inflammatory activity was graded on a scale of 0–3: A0 = no activity, A1 = mild activity, A2 = moderate activity, and A3 = severe activity.
Statistical Analyses
All statistical analyses were performed using SPSS 22.0 (IBM Corp., Armonk, NY, USA) and MedCalc 15.0 (MediCalc Software bvba, Mariakerke, Belgium). The Spearman's rank-correlation test and multiple regression analysis were used to measure the relationship between MR histogram parameters and the degree of fibrosis and inflammatory activity. Correlation coefficients were classified as follows: 0.0–0.2, very weak to negligible correlation; 0.2–0.4, weak correlation; 0.4–0.7, moderate correlation; 0.7–0.9, strong correlation; and 0.9–1.0, very strong correlation (20). The diagnostic performance of variables with significant correlation with fibrosis in predicting the fibrotic stage was assessed using receiver operating characteristic (ROC) curve analysis. The corresponding areas under the ROC curve (AUCs), sensitivity and specificity for the classification of fibrosis (grade F1 or higher, F2 or higher, and F4) were calculated. For all significant parameters of D, K, and ADC maps, the highest AUCs of each MR parameter were used to compare the diagnostic performance in fibrosis staging (12), using the DeLong method (21). All tests were two-sided and p < 0.05 was considered statistically significant.
RESULTS
Animal Model
A total of 35 rats were included (one rat died in the seventh week after CCl4 administration). Histopathologically, 12, 5, 5, 6, and 7 rats were diagnosed as F0–F4, respectively, and 17, 5, 7, and 6 rats were diagnosed as A0–A3, respectively. A strong correlation was observed between fibrosis grade and inflammatory activity grade (r = 0.842, p < 0.001).
Histograms and Histological Findings
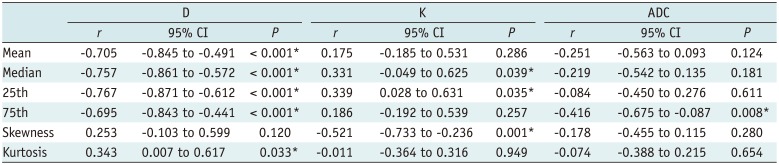
Correlations between the histogram parameters of D, K, ADC, and the fibrosis score are presented in Table 1. Mean, median, 25th and 75th percentiles, kurtosis of D map, median, 25th percentile, skewness of K map, and 75th percentile of ADC map demonstrated significant correlations with the fibrosis stage (r = −0.767 to 0.339, p < 0.001 to p = 0.039). Among all the parameters above, mean, median, and 25th percentile of D showed strong inverse correlations (r = −0.767 to −0.705).
Mean, median, 25th and 75th percentiles of D map, and 75th percentile of ADC map showed significant correlation with the inflammatory activity score (r = −0.676 to −0.336, p < 0.001 to p = 0.036) (Supplementary Table 1 in the online-only Data Supplement).
In general, the 25th percentile of D map demonstrated the strongest correlation with both fibrosis stage (r = −0.767, p < 0.001) and inflammatory activity (r = −0.676, p < 0.001). The fibrosis score was the independent variable associated with histogram parameters, compared with the inflammatory activity grade (p < 0.001 to p = 0.041), except the median of K map (p = 0.185).
Diagnostic Performance in Fibrosis Staging
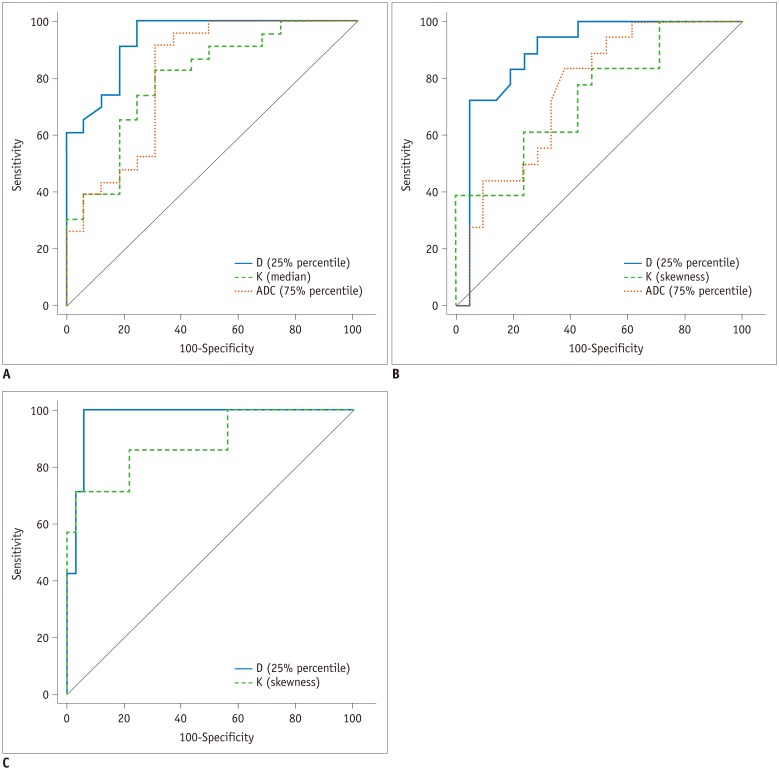
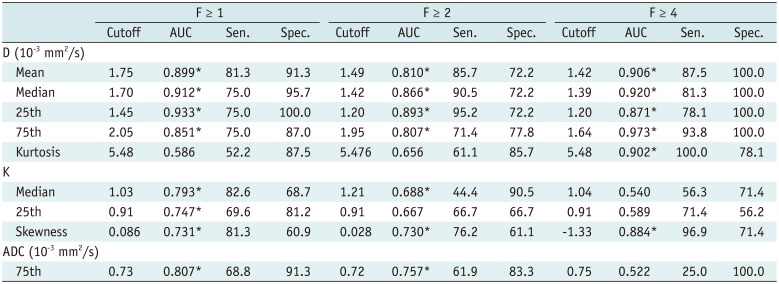
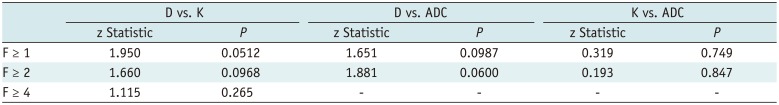
The AUCs of histogram parameters significantly correlating with fibrosis as well as the optimal cutoff values along with the respective diagnostic performances according to different fibrosis thresholds are shown in Table 2. For the discrimination of fibrosis stage ≥ F1, the largest AUCs were 0.933 (25th percentile) for D map, 0.793 (median) for K map, and 0.807 (75th percentile) for ADC map; for F ≥ 2, the largest AUCs were 0.893 (25th percentile) for D map, 0.730 (skewness) for K map, and 0.757 (75th percentile) for ADC map. For F4, the largest AUCs were 0.973 (75th percentile) for D map and 0.884 (skewness) for K map, and no significance existed in ADC histograms. AUCs of D were larger than K and ADC maps generally, although no significant differences existed in pairwise comparisons (p = 0.0512 to 0.847) (Table 3, Fig. 2).
DISCUSSION
Histograms provide data on multiple parameters and insight into the distribution of imaging biomarkers over all voxels from different dimensions (22). The observations in histogram analysis of DKI may therefore be a potential biomarker reflecting increased heterogeneity and asymmetric distribution of hepatic parenchymal structure in fibrosis (13). Our study revealed that histogram-derived parameters of DKI demonstrated significant correlation with fibrosis stage. The possible implications include evolution of fibrosis, liver changes from normal structure with orderly normal tissue to an abnormal structure with unstable architecture and restricted water diffusion, due to the presence of disrupted architecture, increased extracellular collagen deposition, narrowed sinusoids, and vascular changes (1323). This series of changes leads to increased histological heterogeneity and consequent changes in histograms.
In general, histograms of D map showed better diagnostic performance in fibrosis staging, with strong inverse correlations in mean, median, 25th percentile as well as larger AUCs than K and ADC maps. The 25th percentile of D demonstrated the strongest correlation, compared with other parameters including the mean value. It is a measure indicating the value below which 25% of the D observations within the study group fall, and only includes the minimum 25% values of the histogram spectrum (24). Fibrotic hepatic tissue tends to yield limited diffusivity and lower D values compared with normal liver parenchyma (2325), which explains the role of minimum 25th percentile of D value in providing useful information from the dispersion of D values and is sensitive to subtle changes in D induced by the structural abnormality in liver fibrosis characterization. Moreover, such an analysis based on individual percentiles minimizes the effect of outliers, especially from pixels at the boundaries of liver or from noise (26). We hypothesized that histogram analysis of DKI-D map especially the 25th percentile of D provides deeper insight into the distribution and heterogeneity than routine mean value, for further assessment of liver fibrosis.
Our present findings also indicate that DKI histogram parameters correlated with the inflammatory grade to varying degrees, as infiltration of inflammatory cells into the liver interstitial tissue may distort liver architecture (1327). Compared with the inflammatory activity grade, the fibrosis score was independently predicted by the histogram parameters in most cases based on our results. Therefore, the DKI histogram may be regarded as a reliable tool in the staging of liver fibrosis. However, a significant correlation between the pathological fibrosis stage and the inflammatory activity grade is widely known (13). Our results were also consistent with the report and indicated that fibrosis evolved with the severity of necrosis and inflammation. Thus, although histogram parameters were more strongly correlated with fibrosis score, further studies are needed to confirm the precise influence of hepatic inflammation and shed light on the mechanism of diffusion changes observed in liver fibrosis.
This study had several limitations. First, given the limited sample size, the findings from the current study are preliminary. Statistical power was further increased by access to larger sample size in future studies. Second, the kinetics between humans and rodents vary, and fibrosis and cirrhosis in patients often occur in CLD. Further study of this technique in humans, especially with CLD is warranted to fully explore its potential clinical utility. Finally, histogram measurements were performed by a single observer, and the inter- and intra-observer variations were not assessed. However, as shown by previous studies (2428), these variations are expected to be small and barely affect the results in whole-volume measurements.
In conclusion, D of DKI histogram analysis provides added value and improves the diagnostic performance in detecting various stages in liver fibrosis compared with ADC, and may offer a promising noninvasive tool in staging liver fibrosis.
 XML Download