

 PDF
PDF ePub
ePub Citation
 Print
Print


INTRODUCTION
Chronic renal failure (CRF) is associated with increased risks for stroke and cardiovascular disease.12 Thromboembolism is one of the major pathologic mechanisms of stroke and cardiovascular disease,3 and is more frequently noted in patients with CRF than in those with normal kidney function.45 Several abnormalities in hemostasis and coagulation have been suggested in patients with CRF, which induces the activation of the renin-angiotensin-aldosterone system. This activation can increase the plasma levels of fibrinogen, D-dimer, and plasminogen activator inhibitor, which inhibits the activation of the fibrinolytic system.6 Patients with CRF show impaired release of endogenous tissue plasminogen activator from the endothelium.7 Moreover, CRF is associated with increased platelet aggregation and von Willebrand factor activity.8 These features in CRF may result in prothrombotic conditions. On the contrary, as CRF advances, the risk of bleeding increases in association with platelet dysfunction.9
An appropriate animal model is indispensable to the study of CRF. Compared with other animal models for CRF, such as ureter occlusion,10 radiation injury,11 or drug-induced CRF,12 the 5/6 ablation/infarction model has several advantages because it is very similar to actual glomerular disease in terms of proteinuria, decreased renal function, and secondary hypertension. However, the surgical procedure is relatively difficult.13 Although several abnormalities in hemostasis have been suggested in patients with CRF, few studies have examined the thrombotic responses to external stimuli in an animal model of CRF.
The prothrombotic state in CRF may result in alterations in thrombus formation in pathologic conditions. In this study, we compared processes of thrombus formation between rats with CRF and those with normal kidney function using the ferric chloride (FeCl3)-induced carotid thrombosis model, rotational thromboelastometry (ROTEM), and impedance platelet aggregometry (IPA).
MATERIALS AND METHODS
Ethics, animals, and surgical procedures
This study was approved by the Ewha Womans University Institutional Animal Care and Use Committee (ESM 14-0282). All procedures performed in studies involving animals were in accordance with the ethical standards of the institution set in place during the time at which the studies were conducted. Eight-week-old male Sprague-Dawley rats weighing 200–250 g were used in all experiments. All rats were maintained in a temperature-controlled room with alternating 12:12-h light-dark cycles, and had free access to water and food throughout the experiments.14 To produce the CRF rat model, all animals were anesthetized with 5% isoflurane in a mixture of 30% O2 and 70% N2O.15 During the operation, the body temperature of rats was monitored continuously with a rectal probe, and maintained at 37.0±0.2℃ by using a heating pad (Harvard Apparatus, Holliston, MA, USA) and a homeothermic blanket (Harvard Apparatus).15
In a previous study, the histopathologic findings of CRF were confirmed at 2 weeks after 5/6 nephrectomy in remnant kidneys of mice.16 Based on this previous study, we performed experiments at 4 weeks after 5/6 ablation/infarction of rat kidneys. For inducing CRF, a 5/6 ablation/infarction model was produced.17 Briefly, after the abdomen was opened through a midline incision, the right kidney was removed, and two of the three branches of the left renal artery were ligated to induce renal infarction in approximately two-thirds of the left kidney.17 For the control group, a sham operation was performed by means of gentle manipulation of the renal pedicles without renal artery occlusion or removal of the renal mass. After recovering from anesthesia, the rats were returned to their original shelters, which were kept warm during 24 hr.18 For this experiment, rats that survived until 4 weeks after the induction of CRF were used.
FeCl3-induced common carotid artery thrombosis
At 4 weeks after the production of the CRF model, thrombosis was induced in the rat carotid artery using FeCl3 to determine in vivo thrombus formation, as previously described.15 Briefly, a midline cervical incision was made. Then, the left common carotid artery (CCA) was carefully dissected and exposed. A Doppler probe (MP4 Needle Probe; Motor Instruments, Axminster, UK) was located above the midportion of the CCA. Data of blood flow obtained with the probe were analyzed using software (Moor Instruments, Devon, UK). After the measurement of baseline blood flow for 4 min, a 700 µm×500 µm filter paper saturated with 50% FeCl3 (F2877; Sigma-Aldrich Inc., St. Louis, MO, USA) was placed on the adventitia of the CCA for 5 min.15 After removing the filter paper, the CCA was irrigated with 0.9% normal saline and blood flow was recorded. The time to initial thrombus formation was defined as decreased blood flow by 10% of the baseline.15 The time to significant thrombus formation was defined as decreased blood flow by 50% of the baseline. To measure thrombus size, the CCA was fixed with 4% paraformaldehyde and embedded in paraffin for histopathological analysis. Paraffin blocks were consecutively cut into 3-µm sections. Sectioned slices were mounted on glass slides and stained with hematoxylin and eosin. Because the maximal diameter of a thrombus would be most likely to impact blood flow, the diameters of thrombi were measured using a light microscope (Axio Imager D2; Carl Zeiss Microimaging, Oberkochen, Germany) and Zeiss AxioVision software (AxioVs40 V 4.8.1.0, Carl Zeiss Imaging Solution) in a cross section that showed the largest diameter.15
Urine, blood sampling, ROTEM, and IPA
During last the 24 hr before inducing thrombus formation, 24 hr urine was acquired for measuring proteinuria and microalbuminuria amounts. At 4 weeks after the initial surgery, blood was sampled through a cardiac puncture under general anesthesia immediately before sacrificing the rats. These blood samples were used to measure the levels of blood urea nitrogen (BUN), creatinine, fibrinogen, and antithrombin III. ROTEM and IPA were performed 60 min after blood sampling.19
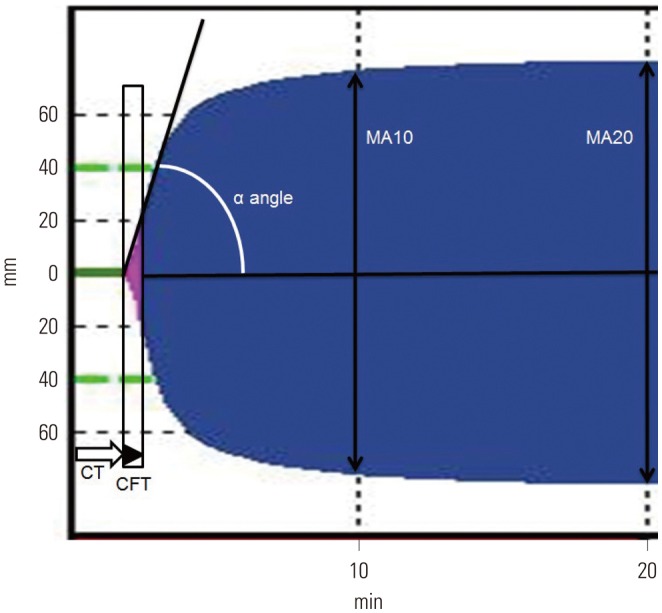
Blood samples for ROTEM were kept at room temperature, and all ROTEM analyses were performed at 37℃. ROTEM was carried out using 2.7 mL of whole blood that was gently mixed with 0.3 mL of 3.2% sodium citrate and reversed with 0.2 M of CaCl2 according to the manufacturer's manual (ROTEM; Tem International GmbH, Munich, Germany).1920 Aliquots of 340 µL of blood samples were used for extrinsic pathway screening thromboelastometry (EXTEM) and intrinsic pathway screening thromboelastometry (INTEM). Blood clot formation was evaluated with recombinant tissue factor for EXTEM and with contact activation for INTEM. The obtained parameters were time to clot initiation, time to clot formation, α angle for clot growth kinetics (initial rate of fibrin polymerization), and the maximum amplitude representing the viscoelastic strength of clot at 10 min and 20 min (MA10 and MA20, respectively) (Fig. 1).20
The degree of platelet aggregation was assessed by IPA (Chronolog 700; Chronolog Co., Havertown, PA, USA).15 Briefly, cardiac puncture was conducted to draw whole blood (900 µL) into a syringe containing 100 µL of 150 United States Pharmacopeia (USP) sodium heparin solution, resulting in a final heparin concentration of 15 USP/mL. A total volume of 500 µL of heparinized whole blood was mixed with the same volume of normal saline. Adenosine diphosphate (ADP) (20 µM) was used as an agonist.
Statistical analysis
Statistical analyses were performed using SPSS (version 20.0; IBM Corp., Armonk, NY, USA). The independent t-test or Mann-Whitney U-test were performed to compare the 24 hr proteinuria, 24 hr microalbuminuria, BUN, creatinine, fibrinogen and antithrombin III, ROTEM parameters, IPA, and maximal thrombus diameter between the control group and the CRF group. A two-tailed p-value of <0.05 was considered statistically significant.
For sample size estimation in ROTEM, previous study showed that the standard deviation of time to clot initiation and α angle was 5 in 43 normal Sprague-Dawley rats. Therefore, assuming an alpha error of 0.05, a beta error of 0.2, and a difference in mean values of more than 10, in order to prove that there was a difference in time to clot initiation or α angle between the control group and the CRF group, each group required five rats.21 Regarding platelet aggregation, a previous study performed with three rats discovered a significant difference between ADP-treated group and non-ADP-treated group.22 To minimize the number of animals required for experimentation, we assigned five rats as controls and five rats to the CRF group.
RESULTS
Mortality rates within 4 weeks were 21.0% (4 of 19) for the CRF model and 6.3% (1 of 16) for the control group. All five rats died within 48 h after the initial surgical procedures. The mortality of our CRF model was similar to that of a previous study.17 The 30 rats that survived until 4 weeks were used for analyses [control: n=15 (5 for FeCl3-induced arterial thrombosis model, 5 for ROTEM, and 5 for IPA), CRF: n=15 (5 for FeCl3-induced arterial thrombosis model, 5 for ROTEM, and 5 for IPA)].
Urine and serum biochemistry
The CRF group had higher levels of 24 hr urine protein (124.4±33.0 mg vs. 13.3±1.2 mg, p=0.002), 24 hr urine microalbumin (5.4±1.5 mg vs. 0.2±0.1 mg, p=0.002), plasma BUN (57.0±18.9 mg/dL vs. 17.8±3.7 mg/dL, p=0.021), creatinine (0.6±0.1 mg/dL vs. 0.2±0.1 mg/dL, p=0.018), fibrinogen (299.8±18.5 mg/dL vs. 269.4±13.6 mg/dL, p=0.018), and lower levels of plasma antithrombin III (93.8±2.2 vs. 110.2±5.8 international unit, p=0.036) than the control group.
FeCl3-induced thrombus formation in vivo, ROTEM, and IPA
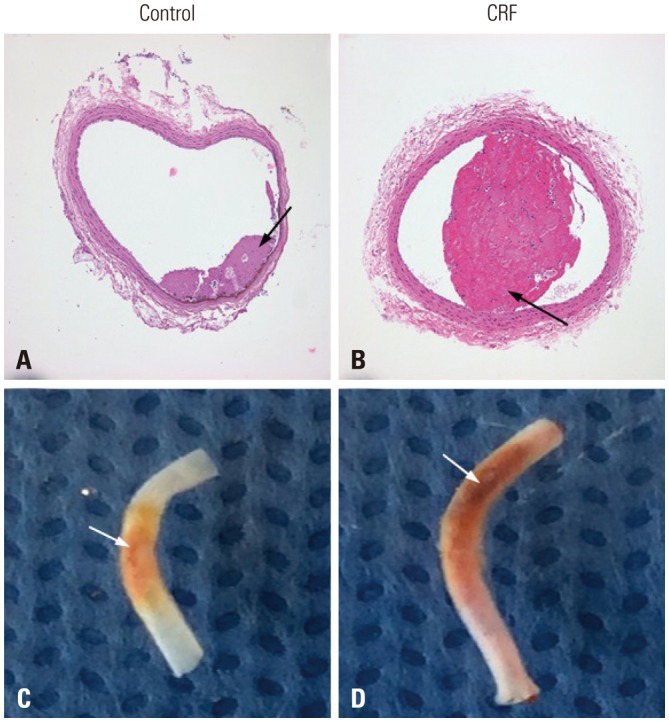
In experiments of FeCl3-induced thrombosis of the carotid artery, the time to mean blood flow reduction (10% and 50%) by thrombotic occlusion was shorter in the CRF group than in the control group (10%: 30.2±1.2 s vs. 42.1±1.4 s, p=0.001; 50%: 114.6±15.2 s vs. 152.6±21.5 s, p=0.014) (Supplementary Fig. 1, only online). The maximal diameters of thrombi were larger in the CRF group than in the control group (394.2±201.1 µm vs. 114.0±145.1 µm, p=0.039) (Fig. 2).
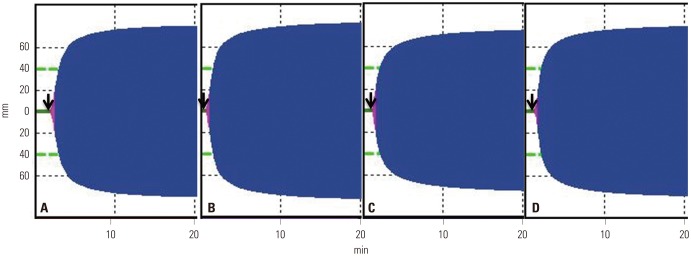
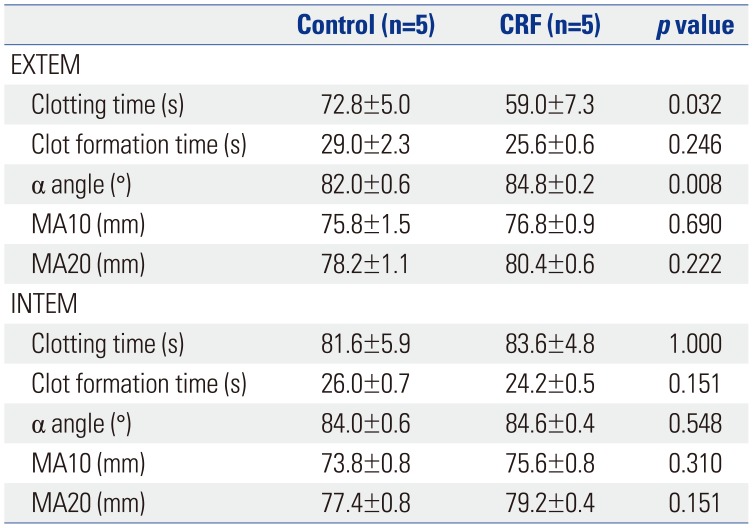
In EXTEM, the CRF group showed a shorter time to clotting initiation (clotting time, 59.0±7.3 s vs. 72.8±5.0 s, p=0.032) and a higher velocity to clot growth (α angle, 84.8±0.2° vs. 82.0±0.6°, p=0.008) than the control group. The clot formation time, MA10, and MA20, were not different between the two groups (Table 1, Fig. 3). However, in INTEM, the clotting time, clot formation time, α angle, MA10, and MA20 were not different between the CRF and control groups (Table 1, Fig. 3). On IPA, the maximal platelet aggregation rate was higher in the CRF group than in the control group (58.2±0.2% vs. 44.6±1.2%, p=0.006); however, there was no difference in the time to maximal aggregation (331.0±10.8 s vs. 309.6±9.9 s, p=0.248) (Supplementary Fig. 2, only online).
DISCUSSION
This study showed that the thrombotic responses to external stimuli differ between rats with CRF and those with normal kidney function. This study firstly demonstrated that thrombus formation is more rapidly induced in rats with CRF than in those with normal kidney function using the FeCl3-induced thrombus model. Maximal thrombus diameter, maximal platelet aggregation rate, and plasma fibrinogen levels were also higher in the CRF group. Plasma anti-thrombin III levels were lower in the CRF group.
Direct application of FeCl3 to the arterial adventitia has been widely used for in vivo platelet-rich thrombus formation in animal models. This model has been shown to produce thrombi that have a similar morphology to those found in humans.2324 FeCl3 induces clot formation by oxidative injury, endothelial dysfunction, and endothelial collagen/glycoprotein VI axis activation.25 The endothelium is of crucial importance for hemostasis; however, it may lose its antithrombogenic properties, for example anti-thrombin III, in the presence of uremic toxic materials in CRF.26 Endothelial dysfunction and injury are aggravated in CRF.68 In the injured endothelium in CRF, endothelial release of tissue plasminogen activator is decreased, and thrombin is activated.826 This might enhance thrombus formation upon injury with FeCl3.
ROTEM is a tool for assessing coagulation in humans and animals. This test determines the viscoelastic changes of coagulation, and reflects the clot initiation process, clot formation speed, and clot firmness.27 ROTEM has been proven superior to classical coagulation tests in evaluating potential coagulation disorders.27 We determined whether enhanced thrombus formation on FeCl3-induced endothelial injury in CRF was mediated by the extrinsic or the intrinsic coagulation pathway. The findings in ROTEM suggest that enhanced clot formation in CRF was associated with the activation of the extrinsic coagulation pathway, which was triggered by tissue factor, but not of the intrinsic coagulation pathway. The tissue factor, which is the main initiator of the extrinsic coagulation pathway, is a key molecule in hemostasis and thrombus formation.28 The tissue factor could induce fibrin formation (associated with thrombin burst—α angle in ROTEM) and decrease the clotting time (representing initial fibrin formation in ROTEM).28 In a previous study, increased levels of plasma tissue factor have been observed in patients with CRF.29 These findings suggest that the enhanced thrombus formation in ROTEM might be associated with enhanced tissue factor pathway in CRF.30
IPA, using specifically whole blood samples, is a classic tool for evaluating platelet aggregation. This test has several advantages over conventional methods for investigating platelet aggregation because whole blood samples require less processing time. Moreover, IPA replicates in vivo conditions because whole blood includes white and red blood cells, which affect platelet aggregation.31 We also tested the aggregation of platelets in CRF using platelet aggregometry. In the early stage of CRF, increased platelet aggregation and von Willebrand factor activity were associated with thrombotic tendency.8 In addition, reduced plasma levels of nitric oxide and L-arginine in CRF were related to increased platelet aggregation, which may enhance thrombosis.3233 Our findings of increased platelet aggregation in CRF support those of previous studies and provide additional information on platelet aggregation in CRF.
Our study has several limitations. First, we investigated alterations in hemostasis and coagulation at 4 weeks after inducing CRF in the rat. Although histopathologic findings of CRF was demonstrated after 2 weeks after 5/6 nephrectomy in the remnant kidneys of mice,16 a longer period after inducing 5/6 ablation/infarction might have been necessary to reflect the pathophysiology of “chronic” renal failure. In addition, hemostasis and coagulation in CRF may be different according to the stage of CRF. While our study showed that relatively early-stage CRF (4 weeks), comparable to that of a previous CRF rat model,1834 long-standing CRF may increase the risk of bleeding rather than thrombosis because of functional defect in the interaction of von Willebrand factor with glycoprotein IIb–IIIa, acquired defect of cyclooxygenase activity, and a reduced ability to synthesize thromboxane A2.3536 Therefore, the interpretation of our findings should be limited to the 4 weeks after inducing CRF in the rat. Second, the sample size of this study was very small. Therefore, further studies are necessary in larger samples with the longer-period model, such as an 8-week or 12-week 5/6 ablation/infarction model. Third, the detailed molecular mechanism of thrombus formation was not evaluated. Therefore, further studies are needed to support and confirm our findings. Fourth, although weight of rats may be changed and differed between 5/6 groups and control groups during the 4 weeks, we did not adjust for the weight of rats. This limitation could cause another bias regarding results of our study. Finally, although the thrombogenicity could be influenced by the surgery (5/6 nephrectomy) itself, our study did not evaluate hemostasis status after immediate post operation.
In conclusion, this study demonstrated that thrombosis caused by external stimuli-induced endothelial injury was enhanced in CRF rat model. An activated extrinsic coagulation pathway may play an important role in clot generation in the CRF rat model induced by 5/6 ablation/infarction.
 XML Download