

 PDF
PDF ePub
ePub Citation
 Print
Print


INTRODUCTION
The early and prompt diagnosis of Alzheimer's disease (AD) crucially affects the clinical outcome.12 To improve the certainty of diagnosing early-stage AD, recently revised criteria incorporate atrophy of the medial temporal lobe (MTL) or hippocampus in magnetic resonance imaging (MRI) for neuronal injury and the presence of amyloid-deposition, based on the core AD symptom of progressively episodic memory impairment.34 Visually rating medial temporal-lobe atrophy (MTA) is a useful method in the clinical setting.156 We have proposed a T1-weighted axial Visual Rating Scale (VRS) modified from Scheltens' T1-weighted coronal VRS, and found it to be a quick, reliable, and easy-to-apply version of Scheltens' scale through a validation study involving head-to head comparisons and 3D analyses of the hippocampal volume.78
While MTA is an earliest distinct pattern of brain atrophy in AD and is correlated with the disease severity,9 it has often also observed in the nondemented elderly population.10 Moreover, MTA is a rare manifestation in young patients with cognitive disorder. Previous studies have shown that brain atrophy that includes the MTL increases with age as a result of the normal aging process.1011 Recent investigators suggested age-dependent cutoff scores on Scheltens' MTA VRS of ≥2 for subjects <75 years old and ≥3 for subjects >75 years old.12 The present study aimed to generate practical cutoff scores on a T1-weighted axial MTA VRS for differentiating patients with AD from the cognitively normal population using data from a large cohort sample of the Clinical Research Center for Dementia of South Korea (CREDOS) study.
METHODS
Subjects
The study subjects comprised 1,427 controls with no cognitive impairment (NC) and 2003 AD patients from the CREDOS study.13 The CREDOS study was an observational, multidisciplinary dementia cohort from 31 centers in South Korea who participated from November 2005 until 2013. The 3,430 participants were categorized at their diagnostic visit into age groups of 50–59, 60–69, 70–79, and 80–89 years. The subjects underwent a standard assessment that included the clinical history, a neurological examination, detailed neuropsychological tests, an MRI examination, and laboratory tests to exclude other causes of cognitive impairment. The maximum interval between neuropsychological testing and the brain MRI examination was 3 months.
The inclusion criteria for NC were aged ≥50 years and normal cognitive function on the Korean version of the Mini Mental State Examination (K-MMSE) and in all neuropsychological tests (as described in the next section).
The inclusion criteria for the AD group were as follows: 1) criteria for probable AD based on the National Institute of Neurological and Communicative Disorders and Stroke and the AD and Related Disorders Association, and the Diagnostic and Statistical Manual of Mental Disorders (Fourth edition) criteria for probable AD, 2) age ≥50 years, and 3) total Clinical Dementia Rating (CDR) score of 0.5 or 1. The exclusion criteria for both the NC and AD groups were as follows: 1) significant neurological or psychiatric illness, 2) significant unstable systemic disease or organ failure, and 3) severe white-matter hyperintensities (>25 mm in deep white matter or a periventricular lesion >10 mm) in T2-weighted and FLAIR MRI images, which known to be related to brain atrophy and cerebrovascular events. No patients with a clinical diagnosis of mild cognitive impairment of any subtype or a codiagnosis of AD were included in this study.
Each decade age group comprised 57 individuals (with the exception of 47 subjects being included in the 80- to 89-year NC group) chosen randomly using a list of random numbers generated in Microsoft Excel by decade age groups. In total, 446 subjects comprising 218 NC subjects and 228 of AD subjects were selected for inclusion in this study. We estimated that the sensitivity and specificity of the test would be 0.8 and 0.8, respectively. To conduct a one-sided test with the hypothesis that the sensitivity and specificity would each be 0.6 and with a significance level of 5% and a statistical power of 80%, the required number of the study subjects was 57 for each group. Since the 80- to 89-year NC group only had 47 subjects, all of them were included in the analysis.
The study was approved by the Institutional Review Board of Ewha Womans University Mokdong Hospital (IRB No. 2015-12-023-002).
Neuropsychological tests
All participants underwent neuropsychological tests using a standardized neuropsychological battery, the Seoul Neuropsychological Screening Battery.15 This battery contains tests for attention, language, praxis, four elements of Gerstmann syndrome, visuoconstructive function, verbal and visual memory, and frontal/executive function. The battery used in the present study included digit span (forward and backward), the Korean version of the Boston Naming Test,16 the Rey-Osterrieth Complex Figure Test (copying, immediate and 20-minute delayed recall, and recognition), the Seoul Verbal Learning Test (3 learning-free recall trials of 12 words, a 20-minute delayed-recall trial for these 12 items, and a recognition test), the phonemic and semantic Controlled Oral Word Association Test, and the Stroop Test (word and color reading of 112 items during a 2-minute period). We also applied the K-MMSE, the Clinical Dementia Rating Sum of Boxes, and the Geriatric Depression Scale.17
T1-weighted axial MTA VRS
The T1-weighted axial scans were transcribed and assembled into a numbered series in order to conceal the clinical data of the subjects. Two neurologists (one experienced and one newly trained) who were blinded to the clinical information graded MTA on the T1-weighted axial VRS by assigning a 5-grade score ranging from 0 (no atrophy) to 4 (severe atrophy).7 Three widths of the MTL—the hippocampus and parahippocampal gyrus, the gap of the perimesencephalic cistern, and the width of the anterior temporal horn of the lateral ventricle (labeled as A′, C′, and D′, respectively, in Fig. 1A)— were measured on both sides (Table 1).7 Right and left MTA were rated separately. If the degree of MTA was asymmetric in a participant, the side with greater atrophy was selected.
Magnetic resonance imaging
The MRI scans were obtained using a 1.5 Tesla (T) MRI machine (AvantoSyngo, Siemens, Erlangen, Germany) with a 12-channel head, or a 3T MRI machine (Achieva TX, Philips, the Netherlands) with a 32-channel head. Brain T1-weighted axial MRI images were acquired parallel to the line from the anterior commissure to the posterior commissure. The 1.5T T1-weighted axial images were obtained with following parameters: slice thickness, 5.0 mm; interslice thickness, 1.65 mm; repetition time, 430 ms; echo time, 8.70 ms; flip angle, 90°; matrix size, 320×182 pixels; and field of view, 145×220 mm2. The 3T T1-weighted axial images were obtained with the following parameters: slice thickness, 5.0 mm; interslice thickness, 1 mm; repetition time, 2,000 ms; echo time, 20 ms; flip angle, 90°; matrix size, 324×244 pixels; and field of view, 183×220 mm2.
Statistical analyses
Intergroup comparisons of demographic characteristics were performed using Student's t-test or the Mann-Whitney U test for continuous variables and the chi-square test for dichotomous variables. To determine an ideal cutoff value and to confirm the diagnostic performance of the cutoff scores on the axial MTA VRS in the different decade age groups, the area under the receiver operating characteristics curve (AUC) was analyzed.18 Statistical analyses were performed using the Statistical Package for the Social Sciences (version 19.0, IBM Corp., Armonk, NY, USA). The cutoff for statistical significance was defined as a probability value of p<0.05.
RESULTS
Demographic characteristics
The clinical characteristics of subjects are presented in Table 2. Age, gender, and education level did no differ significantly between the NC and AD groups. The K-MMSE scores were higher and the CDR and MTA VRS scores were lower in the NC group than in AD patients.
Decade-age-group-specific cutoff scores on the axial MTA VRS
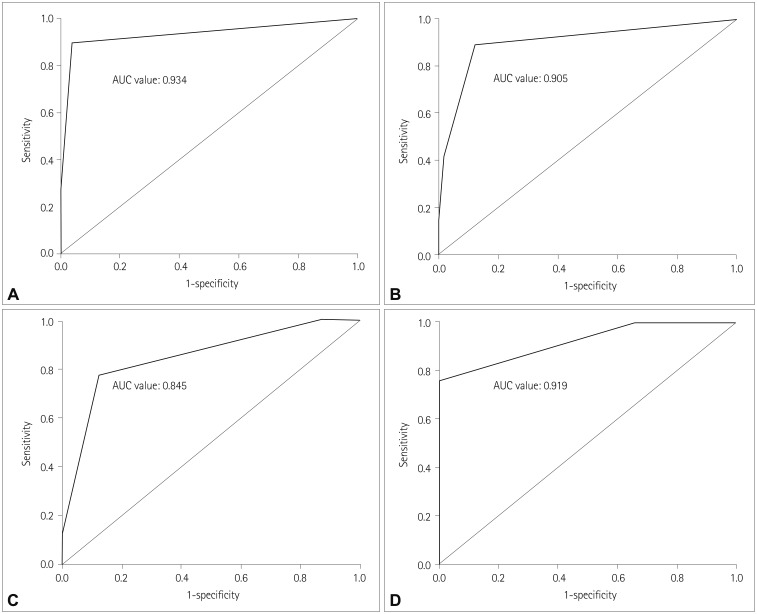
The mean and standard-deviation scores on the T1-weighted axial MTA VRS within each decade age group are listed in Table 3. The axial MTA VRS score increased with age in both the NC and AD groups. The cutoff score indicates the lower threshold for abnormality. The sensitivity and specificity according to different axial MTA VRS cutoff scores are listed in Table 4 for each age group. AUC analyses were performed for determining the optimal cutoff scores for best discriminating between AD and NC. The results of the AUC analyses are shown in Fig. 2.
The optimal cutoff score for differentiating AD patients from the NC group was ≥1 (sensitivity, 89.5%; specificity, 96.5%; p<0.001; AUC, 0.934, 95% CI, 0.882–0.986) for subjects aged 50–59 years, ≥1 (sensitivity, 89.5%; specificity, 87.7%; p<0.001; AUC, 0.868; 95% CI, 0.799–0.938) for subjects aged 60 to 69 years, ≥2 (sensitivity, 77.2%; specificity, 87.7%; p<0.001; AUC, 0.845; 95% CI, 0.771–0.919) for subjects aged 70–79 years, and ≥3 (sensitivity, 75.4%; specificity, 100%; p<0.001; AUC, 0.919; 95% CI, 0.868–0.970) for subjects aged 80–89 years. Kappa values of the T1-weighted axial VRS were also assessed. The intrarater and interrating reliabilities of the T1-weighted axial MTA VRS scores were 0.802 and 0.786, respectively (both p<0.001).
DISCUSSION
The aim of this study was to determine the optimal cutoff scores on the age-specific T1-weighted axial MTA VRS for practical use in the clinical decision tree. We found that the axial MTA VRS scores for a diagnosis of AD increased with the decade age group, as expected: the optimal score was ≥1 for diagnosing AD in patients aged 50–69 years, ≥2 for those aged 70–79 years, and ≥3 for those for those aged 80–89 years. The cutoff values of the axial MTA VRS score for subjects aged 50–69 years achieved a high sensitivity and specificity, enabling a clinician to differentiate AD from NC correctly and thereby improving the diagnostic accuracy in this relatively young age range. The cutoff score for subjects aged 80–89 years showed a high specificity for detecting AD but a rather low sensitivity (75%) for differentiating between NC and AD. Therefore, in populations older than 80 years, the degree of MTA will have less effect on clinical manifestation of dementia compared to in subjects aged 50–69 years.
Assessing MTA on MRI scans using a VRS is quick and readily available.5 The MTA coronal VRS was proposed by Scheltens et al.8 in 1992, since when it has been used in numerous studies and also been modified by several researchers. The present authors have also revised this coronal scale into an axial scale through a validation study for clinical usage.7
The original paper of Scheltens et al.8 proposed cutoff scores on the MTA VRS using T1-weighted coronal images of ≥2 for those aged <75 years and ≥3 for those aged >75 years, which was defined as an indicator of the presence of MTA suggestive of AD. Our previous study also showed that a cutoff score on the axial MTA VRS of ≥2 was the standard cutoff for discriminating AD from NC.7
In a more-recent study that applied Scheltens' scale to computed tomography (CT) images, the authors suggested using cutoff scores of >1.5 for those aged <75 years and ≥2 for those aged >75 years.19 In another study, Pereira et al.12 concluded that an MTA VRS score of ≥2 (in at least one hemisphere) was considered abnormal for subjects aged <75 years, whilst a score of ≥3 (in at least one hemisphere) should be considered abnormal for subjects aged >75 years. Our study findings of cutoff scores of ≥2 for those aged 70–79 years and ≥3 for those aged 80–89 years are comparable to both of these previous studies. Our study population included AD patients with an earlier onset (<65 years of age) but had fewer patients with a late onset (>85 years of age) compared to both the studies of Scheltens et al.8 and Pereira et al.12 We therefore suggest that early-onset dementia can be diagnosed in the absence of significant MTA. In addition, some elderly subjects older than 80 years could have moderate MTA (Numerical Rating Scale score of ≥3) without significant cognitive impairment or symptoms of dementia, thereby increasing the likelihood of a false-positive AD dementia diagnosis.
There are effects of expertise and practice on Scheltens' MTA VRS scores when experts are compared to nonexpert MRI assessors.17 Our study showed a relatively high intrarater reliability and a good interrater reliability between experienced axial MTA raters and newly trained neurologists, suggesting that the axial MTA VRS is an easy-to-apply and useful tool for routine clinical practice.
Brain atrophy—especially atrophic changes in the MTL—is a useful diagnostic tool for differentiating AD from NC, but this is due to structural neuronal degeneration possibly related to tau pathology, and not a result of amyloid pathology.2021 Memory problems such as forgetting appointments and names, difficulty looking for things, and losing familiar ways are an early sign of AD, but they are also common complaints in elderly individuals with normal cognition.22 Many previous studies showed the diagnostic certainty improved significantly—to a sensitivity and specificity of >90%—when using MTA grading on MRI scans combined with clinical manifestations.232425 It is clear that atrophy in the MTL is a landmark neuropathological change in AD, but brain atrophy is also well known to occur in the elderly population with normal cognition. Some previous studies suggested that age-related brain atrophy occurs in the MTL even in the presence of normal cognitive function.102627
Our results indicate that caution is necessary when diagnosing AD in elderly patients with MTA. Although the MTA VRS score was a sensitive marker for distinguishing between AD and NC in previous studies,28 it might also lead to misdiagnosis.12 In early-onset AD with proven amyloid pathology, the MTL structures do not seem to exhibit identifiable atrophy.29 In addition, nondemented older adults with atrophy in the MTL are likely to be overdiagnosed as AD.12 In such cases the age-specific cutoff scores on the MTA VRS could be used as a secondary consideration that combines the degree of MTA and the clinical significance.
Our study was subject to several limitations. Firstly, the small number of normal controls older than 80 years and whole-brain atrophy involving the MTL at an advanced age, are likely to overestimate cutoff scores on the MTA VRS. This might have led to the low sensitivity in the oldest age group of our study. Therefore, considering the higher prevalence of AD in the elderly population, further studies involving larger numbers of normal controls older than 80 years or even 90 years are needed.
Secondly, it is possible for patients with AD-related pathology to be classified as cognitively normal when they have sufficient cognitive reserves that mitigate the development of cognitive impairment. In many such cases the cutoff scores on the MTA VRS may be increased, especially in older age groups. Thirdly, the NC group included individuals with subjective memory complaint as well as healthy normal controls without cognitive complaints, which possibly affected the VRS score and especially among those in the older age groups. Fourthly, our study might have been more powerful if we could have performed a head-to-head comparison between the axial MTA VRS and the coronal MTA VRS in the large included cohort. Unfortunately, due to the low number of coronal MRI images in the CREDOS cohort, a head-to-head comparison could not be performed. Finally, we had no evidence of amyloid pathology such as cerebrospinal fluid assays or in positron-emission tomography to support the determination of prodromal AD and dementia due to AD.32
We conclude that the optimal cutoff score on the T1-weighted axial MTA VRS for diagnosing AD varies with the decade age range. The age-specific cutoff scores proposed herein could be useful in the practical clinical setting for the differential diagnosis of AD patients and cognitively normal elderly with age-related MTA. However, further studies are needed that include sufficient subjects older than 80 years for checking the test–retest reliability, the correlation with proof of amyloid pathology, and the possible correlation with Scheltens' coronal MTA rating in CT.


 XML Download