

 PDF
PDF ePub
ePub Citation
 Print
Print


INTRODUCTION
Since its first clinical implementation a decade ago, diffusion tensor imaging (DTI) has become a critical tool for evaluating white matter microstructural integrity in various neuropathological conditions and in healthy brains (1234). DTI provides quantitative information on white matter integrity in terms of fractional anisotropy (FA), radial diffusivity (RD), mean diffusivity (MD), and other values. To this end, DTI has been recently integrated into clinical trials as a tool for quantitative outcome measurement (4567). Quantifiable data provided by DTI has significant potential and utility in clinical trials because it allows the measurement of subtle changes in brain microstructure that can be compared before and after treatment or associated with patient status (135). DTI can be easily assimilated into general clinical practice if adequately standardized (5678).
Despite the clear utility of DTI, its use in multicenter brain research is still a controversial issue, as DTI signals can be affected by various factors including field strength, scanner vendor, gradient strength, b-values, and post-processing algorithms (9). Among them, inter-vendor reliability is one of the most important issues given the use of various magnetic resonance (MR) instruments across clinical sites.
Several studies have reported the reproducibility of DTI over time using one or more scanners from the same vendor and demonstrated acceptable agreement (810). Other studies have examined the inter-vendor reliability of DTI but reported conflicting results (468111213). Yet, evaluations of individual diffusion tensor parameters in terms of multicenter reliability are very limited. Thus, in this prospective multicenter study, we sought to evaluate the inter-vendor and inter-session reliability of DTI by assessing various individual diffusion tensor parameters (MD, FA, and RD) across two different clinical sites using scanners from three different vendors.
MATERIALS and METHODS
Study Subjects
This prospective multicenter study was approved by the ethics committee of each participating institution, and informed consent was obtained from the study subjects. The study was performed at two different sites that were part of the Korea-Alzheimer Dementia Neuroimaging Initiative (14) and utilized 3T MR scanners from three different vendors. The study included 10 healthy subjects (5 men and 5 women; mean age, 30 years; age range, 25–33 years). All the subjects were right-handed, had no history of the neurological or psychological disease, and had a normal cognitive function as confirmed by neurologic examination and mini-mental state examination (range, 29–30) performed by an experienced neurologist (9 years of experience) at the neurology outpatient clinic.
MR Examination
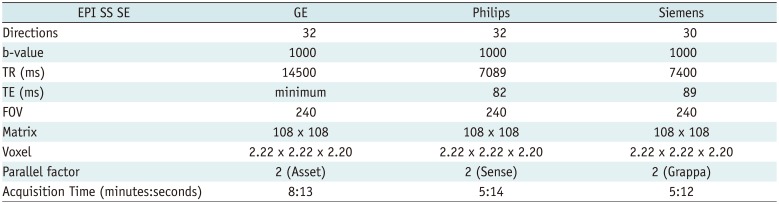
Each subject was scanned twice using each of the three 3T MR scanners as follows: site 1, Signa HDxt (GE Healthcare, Milwaukee, WI, USA) and Skyra (Siemens Healthineers, Erlangen, Germany); and site 2, Achieva (Philips Healthcare, Best, the Netherlands). For inter-scanner analysis, each subject had DTI examination at site 1 and site 2, a day apart. The two sessions of DTI for each scanner were performed on the same day with a 60-minute interval in between the scanning sessions. Accordingly, each subject underwent a total of six different sets of DTI. MR system specifications and DTI acquisition parameters are summarized in Table 1.
DTI Data Processing and Analysis
Prior to analysis, a neuroradiologist visually assessed scan quality based on the b0 and diffusion gradient images using a 3-point scale (1, good quality; 2, fair quality; 3, poor quality). The criteria for image quality included shape deformation, artifacts, and signal homogeneity (6). Scans rated as grade 1 were included in the analysis. None of the scans were discarded in this study.
A voxel-wise statistical analysis of diffusion data was performed using Tract-Based Spatial Statistics (TBSS), which is a part of the FMRIB software library (FSL), http://fsl.fmrib.ox.ac.uk/fsl/fslwiki/TBSS. First, individual subject diffusion data were preprocessed with eddy correction tools in FSL to correct for motion and eddy current distortions. The b0 image was used as the reference image for realignment of the diffusion data. Second, a brain mask was created on the b0 image after automated skull-stripping (15) using the Brain Extraction Tool. The brain mask was applied to perform diffusion tensor estimation using the FSL FDT-FMRIB's diffusion toolbox 2.0 (16). FA, MD, and RD were calculated for each brain voxel using the FDT. Subsequently, the DTI map data (FA, MD, and RD) of all the participants were aligned to the standard space (FMRIB58_FA) using the nonlinear registration tool, FNIRT.
The mean FA image was created and thinned to create a mean FA skeleton representing the centers of all tracts common to the group. Each participant's aligned FA data were then projected on to this skeleton and the resulting data was fed into a voxel-wise cross-subject statistical analysis. After FA processing, other diffusion-derived data (MD and RD) were also processed as described above.
Signal-to-Noise Ratio
For the signal-to-noise ratio (SNR) analysis, we placed a region of interest (ROI) in the frontal deep white matter (anterior part of the centrum semiovale). We selected a single ROI method for the SNR measurement. Using this method, the noise was evaluated in the same ROI used for signal intensity of the target area (S). The SNR was computed as SNR = S/σ, where σ is the standard deviation (SD) of pixel intensity in the ROI (5). Signal (S) was evaluated as the mean intensity in an ROI of 10 × 10 = 100 pixels with maximum uniform brain signal in the chosen slice.
Statistical Analysis
Statistical comparisons of SNR values and whole-brain DTI parameters were performed using MedCalc for Windows (MedCalc software version 15.1; Medcalc, Ostend, Belgium) and the statistical package for the social science software (SPSS version 20.0; IBM Corp., Armonk, NY, USA). The threshold of significance was set at p < 0.05. Before performing individual analyses, the distribution of data sets was checked for normality.
The coefficient of variation (CV) defined as the ratio of the SD to the mean (CV [%] = SD/mean) was calculated as per the method described by Jones and Payne (17). CVs were used as a normalized measure of variation. Nonparametric Friedman tests were used for between-group comparisons of mean SNR values, mean CV values, and mean diffusion parameters of the whole brain. For Friedman test, we averaged together two sessions from each vendor of the given subject.
To further evaluate the effects of different sessions and different vendors on TBSS results, we performed a repeated measures analysis of variance (RM-ANOVA) of TBSS-derived mean diffusion parameters of the whole brain from each session of each vendor. The RM-ANOVA was performed on the three groups (1st and 2nd sessions).
For assessment of the voxel-wise differences in diffusion parameters across the whole brain, tripled t tests were performed using the randomize tool in FSL. The randomize tool in FSL was used for between-group comparisons with 5000 permutations of the data. Differences were considered to be statistically significant with a false discovery rate-corrected p value < 0.05.
RESULTS
Variations in Whole-Brain Diffusion Parameters
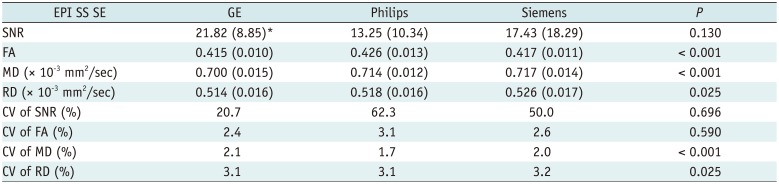
The FA, MD, and RD showed significant differences across the three vendor groups (p < 0.001, p < 0.001, p = 0.025, respectively); however no significant difference was observed in post hoc pair-wise comparisons, exhibiting a tendency towards lower values for the GE scanner compared to the Philips and Siemens scanners (Table 2).
Comparison of TBSS Results between Sessions and across the Vendors
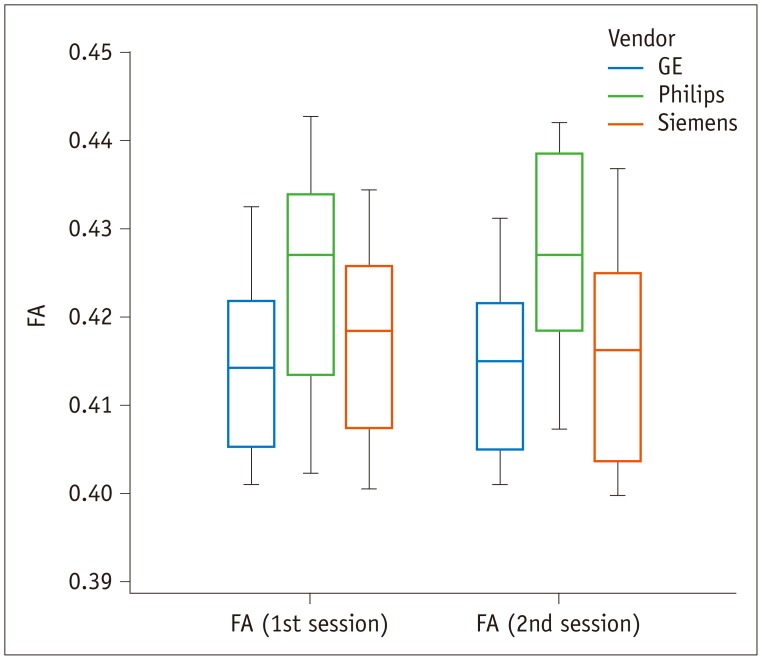
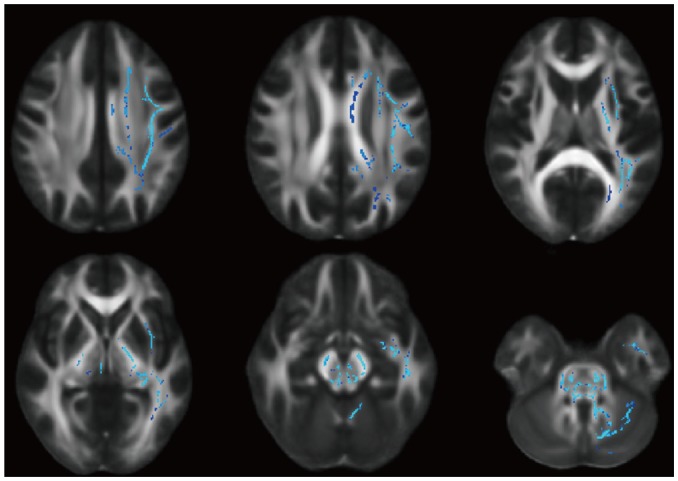
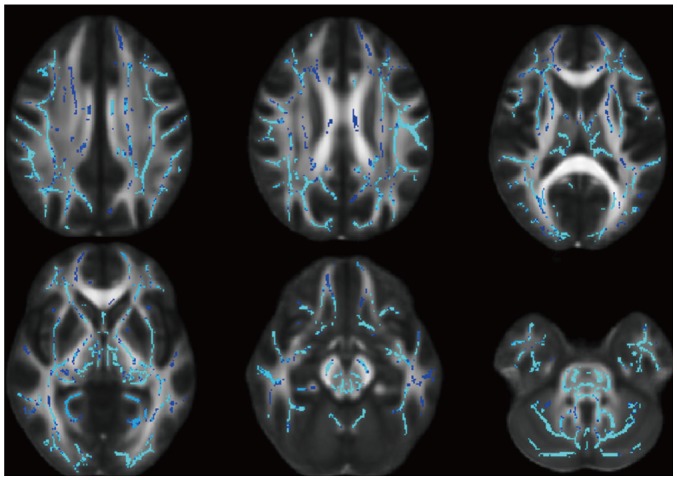
The FA did not significantly vary across the three vendors (p = 0.108) or between the two sessions (p = 0.401) (Fig. 1); however, triple t tests indicated that the Philips scanner indicated higher FA values in the unilateral or bilateral white matter compared to the GE and Siemens scanners (Figs. 2, 3).
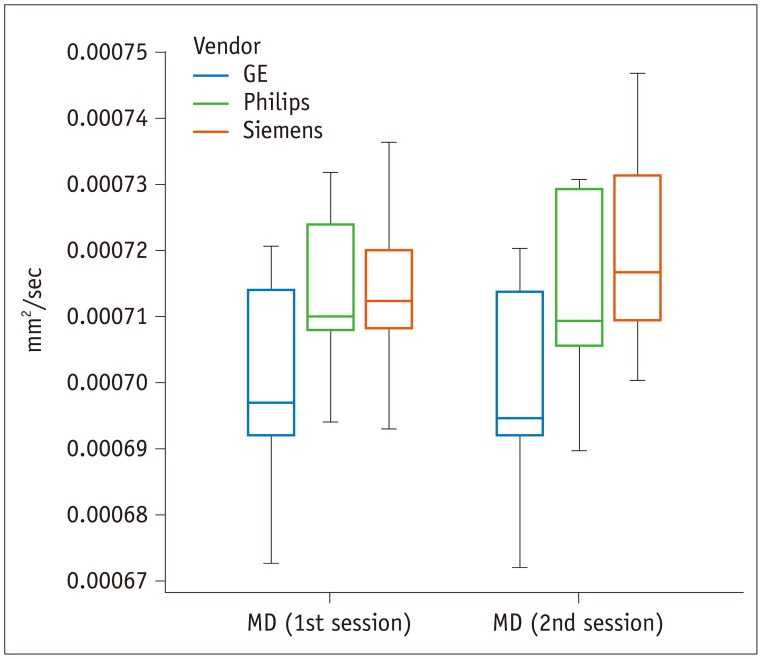
The MD varied significantly across the three vendors (p = 0.020), but not between the two sessions (p = 0.261) (Fig. 4). Yet, the group × factor interaction revealed that measured differences between the 1st and 2nd sessions depended on the vendor (p = 0.004). The GE scanner was associated with significantly lower MD values than the Philips or Siemens scanners. When comparing values obtained from the Philips and Siemens scanners, midbrain and temporal white matter MD values obtained from the Siemens scanner were higher than those obtained from the Philips scanner.
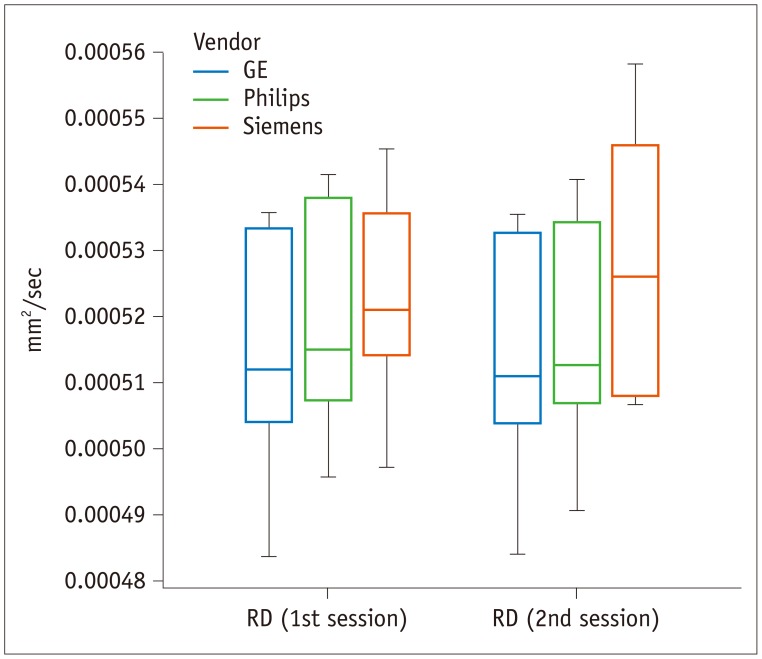
The RD did not significantly vary across the three vendors (p = 0.269) or between the two sessions (p = 0.559) (Fig. 5); however, the group × factor interaction revealed that measured differences between the 1st and 2nd sessions depended on the vendor (p = 0.006). The Siemens scanner was associated with higher midbrain RD values compared to GE or Philips scanners.
DISCUSSION
In the present study, we found that FA values exhibited good inter-vendor and inter-session reliability; however, other diffusion parameters such as MD and RD did not show consistent results, warranting caution in future research. Although the SNR is not an actual measurement used in DTI studies, it is generally considered to be a basic measure of image quality across MR sites (4). We did not observe significant differences in SNR values across the three vendors evaluated in this study, indicating that image quality was consistent.
Few reported studies have examined individual diffusion parameter variability in detail. Teipel et al. (6) reported that FA variability ranged from 5–9% in a study using physical phantoms, with higher variability for TBSS values (CV, 14%) and deformation-based analyses (CV, 29%). Moreover, reported variability was higher in less-organized white matter tracts (6). Fox et al. (12) reported inter-vendor and inter-session CV of FA as 6.8–9.1%. In contrast, other studies reported ranges of CV of FA as 1–3% (13) and less than 4% (10). Our results are more consistent with the latter studies, suggesting that FA exhibits good reliability.
Comparison of the TBSS-derived values in our study also supports the observation that FA exhibits good reliability across the vendors. However, the tripled t tests revealed that the tendency of obtaining higher FA values was higher in the Philips scanner compared to other scanners (Figs. 2, 3). Although the difference was not obvious with a more rigorous statistical method (RM-ANOVA), it suggests that there is a possibility of increasing FA variation across different vendors, especially depending on the chosen statistical method or the chosen analysis, which might lead to a false conclusion in multi-center studies.
In contrast to FA, MD, and RD values showed notable variation. Whereas previous studies have reported good inter-vendor and inter-session reliability for MD and RD values (7), our results suggest that MD and RD are susceptible to system-derived variation. Yet, the reason for the more prominent variation in MD and RD values than in FA values is unclear. The FA is a measure of variation of diffusion tensor eigenvalues that is independent of their magnitude. On the other hand, RD is an arithmetic average of the two lesser eigenvalues of three eigenvalues and MD is an average of all the three eigenvalues (3). Given that the measures from DTI are quite sensitive to noise, we can speculate that the inherent noise to DTI may increase the uncertainty of the eigenvalues, which might affect the measure of the arithmetic average of these eigenvalues (18).
Previous studies evaluating inter-vendor variation in DTI compared only two vendors or results from different groups of subjects for different vendors and thus may have arrived at false conclusions due to flaws in the study design. In contrast, we evaluated the same 10 healthy volunteers using up-to-date scanner systems from three major vendors. Additionally, we focused on TBSS results as TBSS is one of the most commonly used research methods and its reliability is of paramount importance to the credibility of published research studies (1920). The present study had some limitations. First, our study had a limited sample size; hence our findings require verification in a larger cohort study. Second, although we tried to use identical protocols across the vendors, vendor-specific limitations prevented us from applying exactly the same protocols with the same parameters for all the three vendors. In particular, our results might have been influenced by differences in gradient strengths and gradient slew rates.
In conclusion, although FA values exhibited good inter-vendor and intra-session reliability, other diffusion tensor parameters showed inconsistent results. Henceforth, researchers using DTI should be aware of these limitations, especially when implementing DTI in multicenter studies.
 XML Download