

 PDF
PDF ePub
ePub Citation
 Print
Print


INTRODUCTION
The consumption of seafood increases worldwide and crustacean shellfish is one of the major causes of food allergy. In the United States, it has been reported that 1 in 50 individuals is diagnosed with prawn allergy.12 A high prevalence of shellfish allergy is also found in Asia.2 In Thailand, black tiger shrimp Penaeus monodon is the most frequently consumed shrimp species. The risk of shrimp allergy is triggered by various routes, such as inhaling of shrimp particles, and touching, working, and ingestion of meals containing shrimp. Allergic symptoms against shrimp involve several organs, such as the skin (52%-90%), respiratory tract (42%), gastrointestinal tract (35%), and cardiovascular system (anaphylaxis 10%).3
A correct diagnosis of food allergy is essential for proper treatment. At present, avoiding foods that are the causative of allergy is the best recommended treatment. Taking a clinical history is an important step in the diagnosis of food allergy, but it is often inaccurate. The skin prick test (SPT) is recommended as the primary method for the diagnosis of food allergy. SPT, however, has a low positive predictive value and oft en gives false positive results. Furthermore, the procedure can potentially induce systemic allergic reaction.4 The gold standard for the diagnosis of food allergy is oral food challenge (OFC), but this test also has a great risk of severe reactions in allergic patients. Moreover, subsets of patients with positive SPT exhibit a negative OFC.5
Serum immunoglobulin E (IgE) from patients with shrimp allergy can be tested for its ability to bind with allergens by the ImmunoCAP test. This test is selected as the standard method for the quantification of IgE because of its accuracy and cost effectiveness. Nevertheless, false positivity can be obtained from this test due to the cross-reactivity.6 As a result, allergen-specific IgE measurement by these methods can only be partially used for the diagnosis of food allergy.6
One of the most critical problems in the management of shellfish allergy is the lack of definite diagnostic assays because of the poor characterization of biological and immunological properties of the allergens. To date, some major allergens in shellfish have been identified, including tropomyosin, arginine kinase, myosin light chain, sarcoplasmic calcium-binding protein, hemocyanin, troponin-C, myosin heavy chain, glyceraldehyde phosphate dehydrogenase, and ubiquitin.7 Tropomyosin, a major shellfish allergen, belongs to a group of muscle protein with a molecular weight of 34 to 39 kDa (Pen m 1 in Penaeus monodon).89 Even though various allergens have been identified and characterized, a few can be used for diagnosis with no cross reactivity to other proteins from allergen-causing organisms, such as house dust mite (HDM).
The quantification of allergen-specific IgE is often used for the diagnosis of shellfish allergy, but it does not directly measure the capacity of an allergen to induce allergic reactions by IgE cross-linking. The basophil activation test (BAT) emerges as a diagnostic test for food allergy, but the procedure is quite complicated, involving whole blood stimulation and flow cytometry-based detection of activation markers.1011 Recently, a new detection assay for IgE cross-linking by specific allergens based on the nuclear factor of activated T-cells (NFAT) reporter gene in a humanized rat basophilic leukaemia line (RS-ATL8) was reported by Nakamura et al.612 This assay, called the IgE cross-linking-induced luciferase expression (EXiLE) test can be used for the allergen evaluation of IgE cross-linking capacity with high sensitivity and great robustness.13 Previous results showed that this method has a good correlation with the ImmunoCAP test and also OFC test in patients with egg allergy.612
This study aims to investigate the potential of using this reporter cell line for detecting shrimp allergenic proteins using allergic serum IgE and to correlate the results with enzyme-linked immunosorbent assay (ELISA) and Western blot. The results from this study may pave the way toward identification of novel shrimp allergen(s) for diagnostic and therapeutic purposes.
MATERIALS AND METHODS
Patient sera
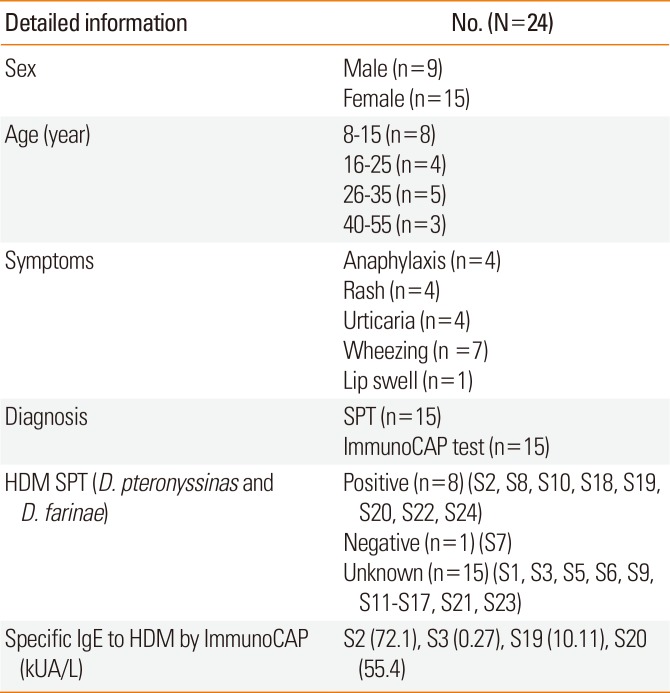
Twenty-four sera were obtained from shrimp allergic patients from the Allergy Clinic of King Chulalongkorn Memorial Hospital. The inclusion criteria of this study were: 1) all patients had history of shrimp allergy; and 2) the allergic response was confirmed by the positive SPT (wheal ≥3 mm) and ImmunoCAP test. Serum from non-allergic healthy donor with no history of shrimp allergy and SPT-negative was used as a negative control. Detailed patient information is shown in Table 1. All procedures involving human subject were reviewed and approved by the Institutional Review Board of Chulalongkorn University (project review No. 469/58).
Preparation of shrimp extracts and HDM allergens
The shrimp extracts from a fresh black tiger shrimp Penaeus monodon were prepared as previously described.14 Briefly, the outer shell of raw shrimp was removed, and the meat was cut into pieces and ground in a motar before resuspension in phosphate-buffered saline (PBS; pH 7.4). The homogenate was centrifuged at 8,600 ×g for 10 minutes at 4℃, and the supernatant was collected. The collected supernatant was sterilized by syringe filtration (0.22 µm) and stored at -80℃ until used as raw shrimp extracts. For cooked shrimp extracts, shrimp was boiled in PBS at 100℃ for 5 minutes before extraction using the same method described above. The bicinchoninic acid protein assay (Pierce™ BCA Assay Protein Assay kit, ThermoFisher Scientific, Waltham, MS, USA) was used to determine total protein concentration, using bovine serum albumin (BSA) as a standard. HDM allergen, extract containing major dust mite allergens including and Der p, Der p2, Der f1, Der f2 (5,000 U/mL), was purchased from ALK Abello (ALK, Horsholm, Denmark).
The Der p10 cDNA was amplified by PCR from a whole D. pteronyssinus cDNA library. The amplified fragment was subsequently cloned into the pStaby1 expression vector (Delphi Genetics, Gosselies, Belgium) and upstream to a (His)6 sequence tag. This DNA construct was transformed by electroporation into CYS21 Escherichia coli cells (Dephi Genetics). Finally, the recombinant plasmid purified from 1 CYS21 clone was transformed into the production SE1 E. coli cells (Delphi Genetics) according to the manual instructions. Recombinant Der p10 (rDer p10) was expressed at 37℃ after addition of 1 mmol/L isopropyl-thiogalactoside (IPTG) for 2 hours. The induced bacteria were collected by centrifugation and lysed through a cell disrupter (Cell D; Constant, Low March, UK) at 1,800 bars. The cell lysate was centrifuged, and the supernatant was directly applied on a Ni2+ chelate high-performance column (GE Healthcare Bio-Sciences, Uppsala, Sweden) equilibrated with PBS buffer at pH 7.2. Protein elution proceeded by stepwise increasing imidazole concentration in the buffer (from 0 to 400 mmol/L). Fractions containing purified rDer p10 (elution with 200 mmol/L imidazole) were pooled and stored at -20℃.
ELISA
Indirect ELISA was performed as described previously with some modifications.15 ELISA plates were coated with raw or cooked shrimp extract in PBS overnight at 4℃. After washing in PBS Tween-20 (PBS-T), the patient sera (dilution 1:50) were added to each well and incubated at room temperature for 1 hour. Horseradish peroxidase (HRP)-conjugated goat anti-human IgE (KPL; Seracare, Milford, MA, USA) was added after washing and the plates were incubated for 1 hour at room temperature. Then, 3, 3′, 5, 5′-tetramethylbezidine (TMB) was used as a substrate. The optical density (OD) was measured at 450 nm by a microplate reader (Anthos 2010; Biochrom, Holliston, MA, USA).
For competitive inhibition assay, the protocols described by Jeong et al.16 was followed with some modifications. Similar procedures as indirect ELISA were performed, except that the patients' sera were incubated with various concentrations of competitors (shrimp extract, HDM extract or BSA for 1 hour before adding to the shrimp extract-coated ELISA plate). The %inhibition was calculated using the following formula:
Sodium dodecyl sulfate polyacrylamide gel electrophoresis (SDS-PAGE) and Western blot
SDS-PAGE was used to separate protein extracts from raw or cooked shrimp, and the gels were stained with Coomassie R-250 solution. For Western blot, membranes were incubated with patient sera at indicated dilutions and were further incubated with HRP-conjugated goat anti-human IgE (KPL, USA). After washing, blots were incubated with chemiluminescent substrates and the signals were detected by X-ray film (Amersham Biosciences, Amersham, UK).
Cell culture and reporter assay
The RS-ATL8 reporter cell line (a kind gift from Prof. Ryosuke Nakamura, Division of Novel Foods and Immunochemistry, National Institute of Health Science, Tokyo, Japan) was maintained in minimum essential medium (MEM) Gibco® (ThermoFisher Scientific) with supplement of 10% fetal bovine serum (FBS) (from Gibco®; ThermoFisher Scientific), penicillin (Hyclone®; GE Healthcare Bio-Sciences, Logan, UT, USA), geneticin® (0.5 mg/mL; ThermoFisher Scientific), hygromycin B (0.2 mg/mL Hygromix®; Elanco Animal Health, Greenfield, IN, USA), GlutaMAX™-I (Gibco®; ThermoFisher Scientific). To measure luciferase activity, the method described by Nakamura et al.12 was followed. In brief, the RS-ATL8 cell line was cultured at 5×10⁴ cells per well in 96 well-plate (50 µL per well). Cells were incubated for 3 hours before addition of diluted sera (1:100) in complete MEM for sensitization. After sensitization, cells were washed once gently with sterile PBS. The dissolved allergens in complete MEM were added (50 µL per well), and cells were incubated for another 3 hours for stimulation. After stimulation, luciferase activity was measured by the ONE-Glo™ Luciferase Assay System (Promega Corporation, Madison, WI, USA), and the assay were measured in a microplate reader (ThermoFisher Scientific). Measurements were done in triplicate, and the average was used for analysis. The positive control was stimulated with the affinity purified goat anti-human IgE (Bethyl Laboratories, Montgomery, TX, USA), and the negative control was medium alone or serum alone without shrimp extract.
Elution of shrimp proteins from SDS-PAGE
After electrophoresis, gels were divided into 2 parts, one was used for Coomassie blue staining as a reference gel and the other was used for the elution of proteins. For the elution of proteins, the excised bands were minced into small pieces in the microcentrifuge tubes. The minced pieces were equilibrated in elution buffer and shaked at 25℃ overnight. After equilibration, the supernatant was collected by centrifugation at 14,000×g for 5 minutes. Aliquots of the supernatant were tested for the presence of proteins by SDS-PAGE. After the elution, the supernatant was dialyzed by dialysis cassette (Slide-A-Lyzer™ G2 Cassettes, 10K MWCO; ThermoFisher Scientific). The dialyzed samples were concentrated by the concentrator devices (3K MWCO; Pall Corporation, Cortland, NY, USA). The concentrated samples were used to test IgE cross-linking in the RS-ATL8 cell line and protein mass spectrometry.
Protein mass spectrometry
Protein samples were reduced with dithiothreitol (DTT), alkylated with iodoacetamide and digested with trypsin.17 The digested peptide solutions were analyzed with Impact II UHR-TOF MS System (Bruker Daltonics Ltd., Billerica, MS, USA) coupled to a nanoLC system: UltiMate 3000 LC System (ThermoFisher Scientific). Peptides were separated on a nanocolumn (PepSwift monolithic column 100 µm i.d. ×50 mm). Eluent A was 0.1% formic acid and eluent B was 80% acetonitrile in water containing 0.1% formic acid. Peptide separation was achieved with a linear gradient from 10% to 45% B for 8.5 minutes at a flow rate of 1 µL/min, including a regeneration step at 90% B and an equilibration step at 1% B, one run took 20 minutes. Peptide fragment mass spectra were acquired in data-dependent AutoMS (2) mode with selecting most abundant precursor ions in 3-second cycle for fragmentation. The mass range of the mass spectrometry (MS) scan was set to extend from 150 to 2,200 m/z. The MS/MS data were submitted for a database search using the Mascot software (Matrix Science, London, UK).18 The data was searched against the National Center for Biotechnology Information (NCBI) database for protein identification. Database interrogation was: taxonomy (Other Metazoa); enzyme (trypsin); variable modifications (carbamidomethyl, oxidation of methionine residues); mass values (monoisotopic); protein mass (unrestricted); peptide mass tolerance (1.2 Da); fragment mass tolerance (±0.6 Da), peptide charge state (1+, 2+, and 3+), and max missed cleavages.
To maximize the number of identified peptides and proteins at a given quality, we used our PeptideShaker version 1.16.519 for the interpretation of peptide and protein identifications. The MS/MS spectral files were again compared to the sequence database using multiple proteomics identification search engines, including Andromeda, Comet, MariMatch, MS Amanda, MS-GF+, OMSSA, Tide and X!Tandem with the help of SearchGUI version 3.2.14.20 The decoy sequences were created by reversing the target sequences in SearchGUI. The identification settings were as follows. Trypsin with a maximum of 3 missed cleavages; 100 ppm as MS1 and 0.5 Da as MS2 tolerances; fixed modifications: Carbamidomethylation of C (+57.021464 Da); and variable modifications: Oxidation of M (+15.994915 Da). Peptides and proteins were inferred from the spectrum identification results using PeptideShaker version 1.16.5.
Statistical analysis
The Wilcoxon signed rank test and the unpaired t test were used to compare between the groups. Differences between the groups were considered significant with a P value of less than 0.05. Analysis was performed using GraphPad Prism version 5.03 (GraphPad Software, Inc., La Jolla, CA, USA).
RESULTS
Specific serum IgE reactivity to raw and cooked shrimp extracts
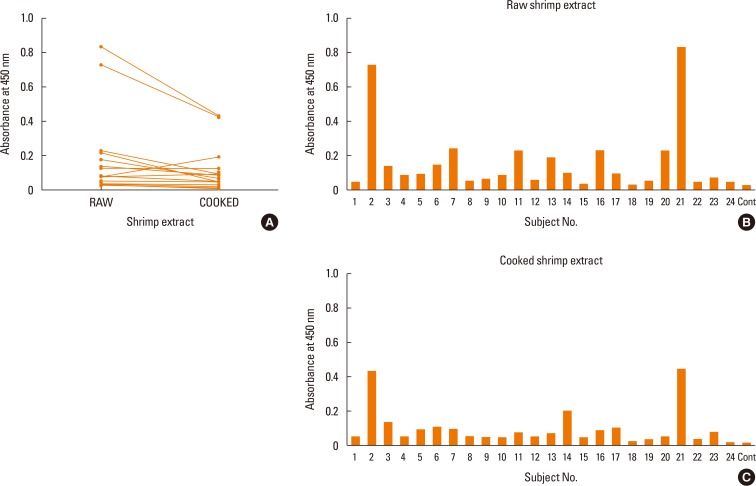
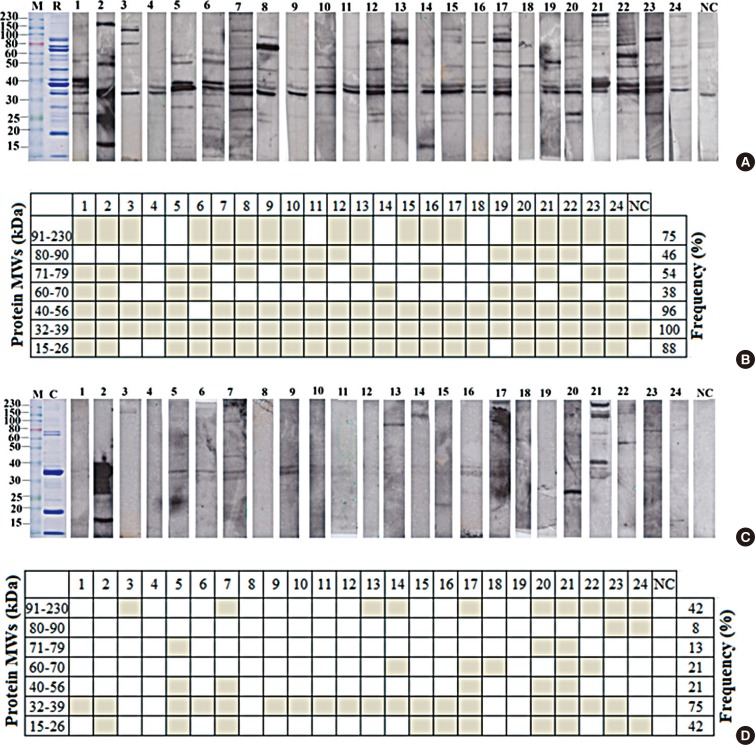
The reactivity against raw and cooked shrimp extracts by the serum IgE of shrimp allergic patients by ELISA were performed. As shown in Fig. 1A, significantly higher reactivity to raw shrimp extract were observed compared to the cooked shimp extract, (P=0.009) (Fig. 1A). When individual sera were directly compared, most samples yielded higher OD read than the healthy conrol subject. Futuremore, the sera from subject No. 2 and 21 showed the highest IgE reactivity to both extracts (Fig. 1B and C). Upon analysis of the raw and cooked shrimp extracts by SDS-PAGE, several protein bands that were found in the raw extracts were not visible in the cooked extracts (Fig. 2).
To analyze IgE reactive profiles, shrimp allergic patient IgE reactivity patterns against raw and cooked shrimp extracts were determined by Western blot. As shown in Fig. 2A and C, each serum sample showed unique reactive pattern, and the allergic serum IgE showed stronger reactivity against raw over cooked shrimp extract, a result consistent with those of ELISA. The patterns of the reactive bands were summarized according to the ranges of molecular weight for cooked or raw shrimp extract in Fig. 2B and D, respectively. In most serum samples, 3 major groups of allergen bands around 91-230, 32-39, and 15-26 kDa in both raw and cooked shrimp extracts were observed. Eighteen out of 24 patients (75%) had specific IgE to the proteins of 32-39 kDa in cooked extracts, while all patients had specific IgE to the proteins of 32-39 kDa in raw extratcs (100%) (Fig. 2B and D). Two allergen bands around 15-26 and 91-230 kDa in the cooked shrimp extract were found in more than 40% of the samples.
Detection of IgE cross-linking shrimp extract using the RS-ATL8 reporter cell line
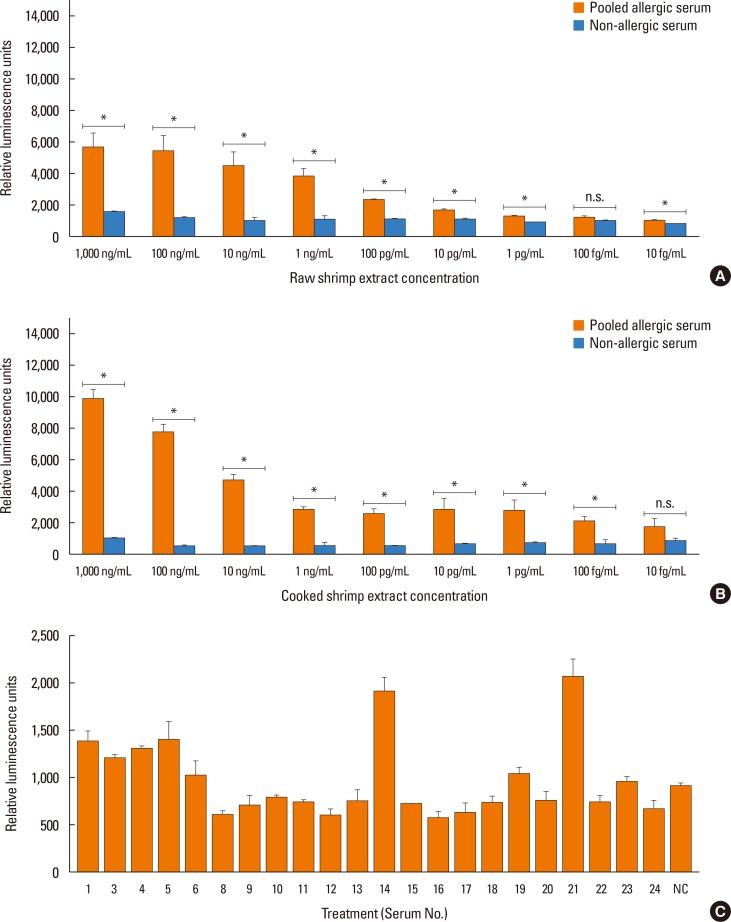
To detect whether shrimp extracts can induce IgE cross-linking, the RS-ATL8 cells were sensitized overnight with 1:100 of pooled sera from 5 shrimp allergic patients (patient No. 5, 8, 17, 21, and 23) that showed high IgE reactivity to the shrimp extracts on Western blot. Cells were stimulated with different protein concentrations of raw or cooked shrimp extracts. A dose response curve of the reporter activities against raw and cooked shrimp extracts are shown in Fig. 3A and B, respectively. The results showed that the raw or cooked shrimp extracts indeed cross-linked sera IgE and induced luciferase activity with wide a range of concentrations from 10 to 1,000 ng/mL. Therefore, the RS-ATL8 cell can be used to detect minute amounts of allergens that show IgE cross-linking ability in shellfish. To correlate this reporter assay with ELISA described above, the raw extracts were used to stimulate the RS-ALT8 cell line that were sensitized with individual serum. As shown in Fig. 3C, some samples, such as No. 21, showed a similar high response as ELISA but some samples, such as No. 14, showed the opposite response strength.
Detecting IgE cross-linking protein extracts eluted from SDS-PAGE using the RS-ATL8 cell line
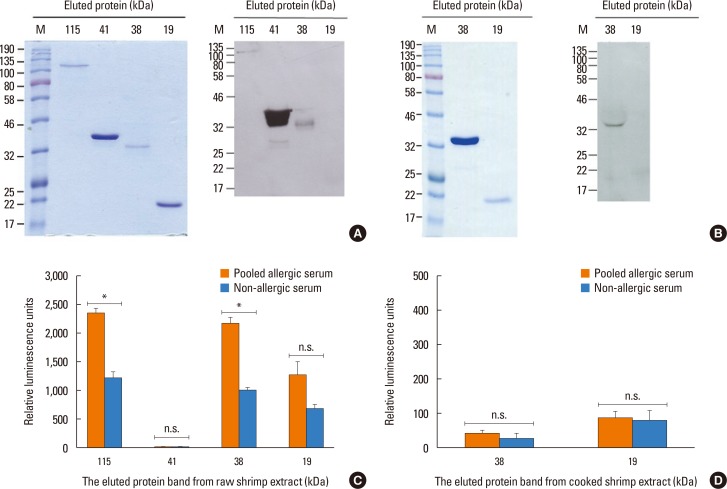
We next attempted to detect shrimp proteins after separation by SDS-PAGE that induce the cross-linking of IgE using the RS-ATL8 cell line. First, raw or cooked shrimp extracts were separated by SDS-PAGE, and 6 prominent protein bands were excised and eluted. Four protein bands from raw (19, 38, 41, and 115 kDa) and 2 protein bands from cooked (19 and 38 kDa) shrimp extracts were chosen based on the results obtained by Western blot described above. The eluted protein bands were subjected to SDS-PAGE for confirmation (Fig. 4A and B). In order to confirm that the eluted proteins still retained an IgE-binding ability, the eluted protein was subjected to Western blot using pooled allergic sera from 5 shrimp allergic patients as used above. The results showed that the eluted proteins at 38, 41, and 115 kDa from raw shrimp extract and 38 kDa from cooked shrimp extract still reacted positively to serum IgE. In contrast, the 19 kDa proteins from either extract did not show specific IgE binding.
These eluted proteins were used to test for IgE cross-linking in the RS-ATL8 cell line as described above. Cells were sensitized with 1:100 dilution of pooled shrimp allergic patient sera and non-allergic serum, and the eluted proteins were used to stimulate cells (Fig. 4 C and D). The results indicated that the eluted proteins at 38 and 115 kDa, but not those at 19 and 41 kDa, from raw shrimp extract induced significantly higher reporter activities in cells sensitized to allergic sera, compared to the healthy control serum. This result strongly indicated the ability of these proteins to cross-link IgE. In contrast, the eluted proteins at 19 and 38 kDa from cooked shrimp extract could not induce IgE cross-linking.
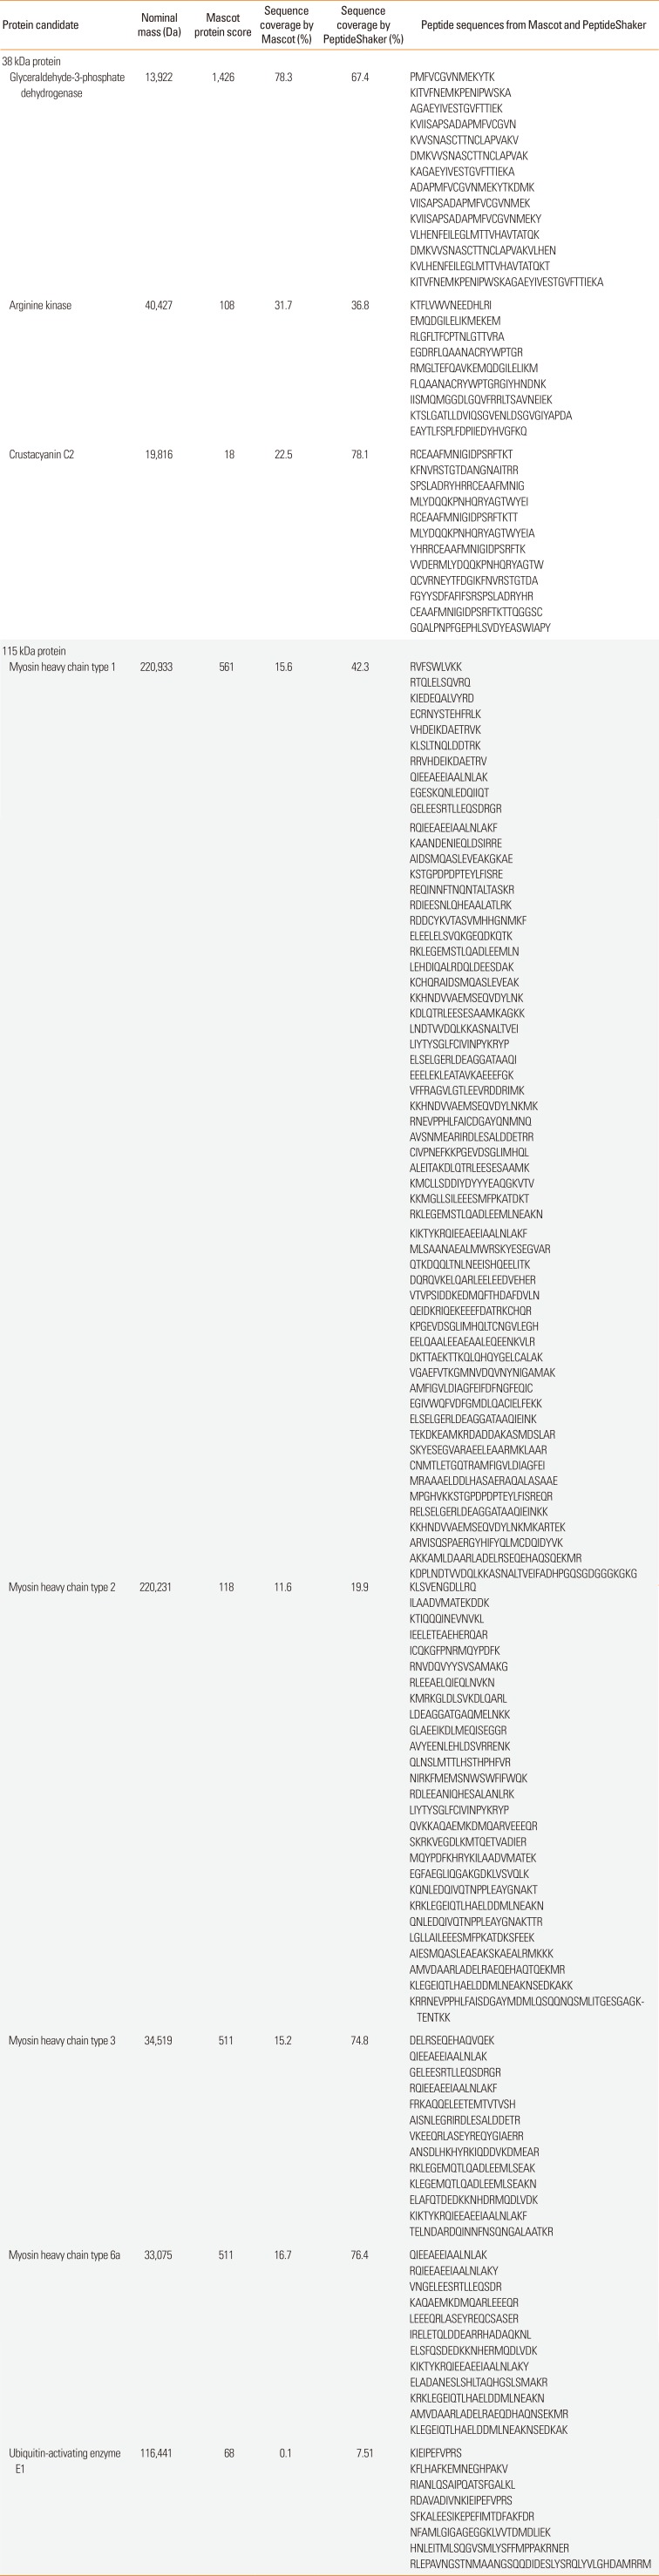
The protein bands from raw shrimp extract at 38 and 115 kDa that had ability to induce IgE cross-linking were excised from SDS-PAGE and were subjected to analysis by MS. Table 2 summarized the results of all identified proteins at 38 and 115 kDa. Three major proteins were identified in the 38 kDa band as glyceraldehyde-3-phosphate dehydrogenase, arginine kinase and crustacyanin C2 (Table 2). Five major proteins, including myosin heavy chain type 1, myosin heavy chain type 2, myosin heavy chain type 3, myosin heavy chain type 6A, and ubiquitin-activating enzyme (E1), were identified in the 115 kDa band (Table 2). Among these proteins, E1 and crustacyanin C2 have not been reported as shrimp allergens and are potential novel candidate shrimp allergens.
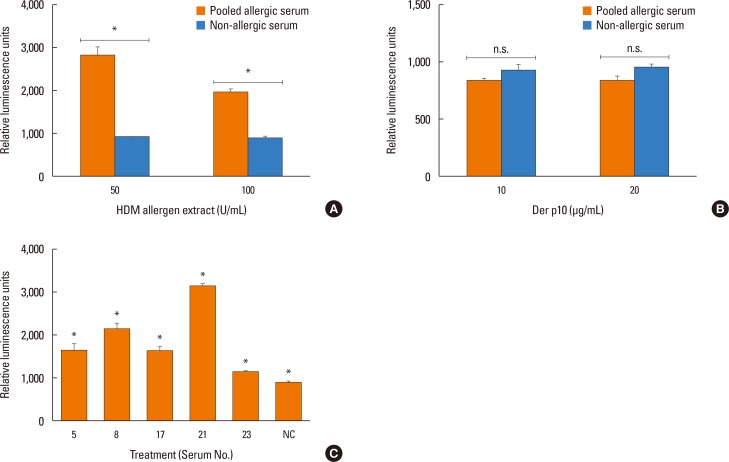
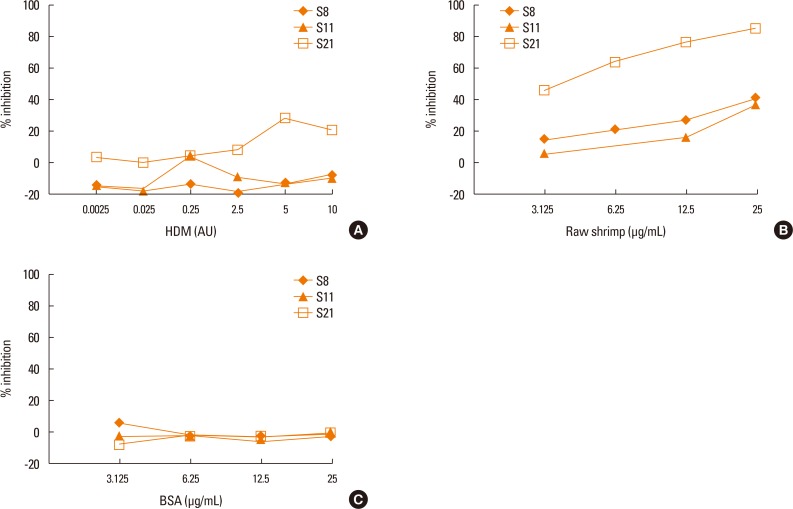
To test whether patient sera used in this study also cross react with the HDM allergens or tropomyosin, HDM allergen extract or recombinant Der p10 were tested in a pooled sera-sensitized RS-ATL8 cell line. As shown in Fig. 5A, patient sera induced significantly higher luciferase activity, suggesting that the sera contain HDM allergens-specific IgE. Interestingly, when recombinant Der p10 was used, no significant increase in luciferase activity was observed (Fig. 5B). When individual serum was separately tested, all sera showed significantly increased luciferase activity upon stimulation with HDM extract. Furthermore, competitive inhibition assay was performed using raw shrimp extract as a coated antigen. As shown in Fig. 6A and B, competition with BSA showed no cross reactivity with raw shrimp extract, while competition with raw shrimp extract showed the range of inhibition between 18%-85%. In contrast, competition with HDM extract only showed competitive response up to 28% by serum No. 21, while no inhibition was found in other sera (Fig. 6C). These results suggest that at least sera from 5 patients tested here contained IgE specific for HDM allergens, but competition with HDM extract yielded only partial inhibition.
DISCUSSION
An accurate diagnosis of food allergy is essential for proper treatment of allergic symptoms. Lack of definite diagnostic tests is one of the obstacles to shellfish allergy management. Currently, there are 5 allergens listed by the World Health Organization/International Union of Immunological Societies (WHO/IUIS) Allergen Nomenclature Sub-Committee, i.e., Pen m 1-m 6, and it is likely that other shrimp allergens remain uncharacterized. The primary objective of this study is to compare the IgE reactivity of allergic subjects by traditional methods of ELISA and Western blot using a humanized rat basophilic leukaemia line, RS-ATL8. Our ELISA results showed in shrimp patients, that sera IgE reactivity was higher to raw extract than to cooked extracts and that more reactive bands were detected on Western blot using raw shrimp extract (Figs. 1 and 2). Similar results were reported by other groups on shrimp and other food allergens.212223 A study by Paschke and Besler24 showed that heating of cow's milk for 10 minutes decreased the allergenecity of bovine allergens. This may be due to epitope structures modification from cooking process; likewise, Nakamura et al.25 found that the Maillard reaction could cause reduction in the allergenicity of squid tropomyosin in some epitopes. Our results are consistent with this hypothesis that reduction in shrimp allergenicity is caused by thermal treatment.26 In contrast, several reports suggested that heat treatment resulted in increased IgE binding for shrimp allergens.2728 The differences may be due to the temperature used for treatment and the composition of the extracts subjected for heat treatment as purified proteins and crude extracts yield different sensitivities to heat treatment. Interestingly, Liu et al.26 reported that patient IgE reacted stronger to the raw shrimp extract, than to the boiled shrimp extract, but when purified tropomyosin was used, it gave the opposite results. From our ELISA and Western blot, stronger IgE reactivity was observed against raw shrimp extract but the cooked shrimp extract gave higher relative luciferase activity when compared to the raw extract (Fig. 3A and B). This result indicated that the cooked shrimp extract may contain allergens that can crosslink IgE more than the raw shrimp extract or the heat treatment may confer IgE cross-linking ability to neoepitope. Therefore, IgE binding using ELISA/Western blot may yield contrasting results to the IgE cross-linking assay as was found in this study.
When HDM allergen extract was tested for IgE cross-linking in some patient sera used in this study, all sera indeed induced higher luciferase activity than the non-allergic control. This result indicated that some patients may contain HDM allergen-specific IgE. The purified recombinant Der p10 did not yield positive reporter assay, suggesting that the Der p10 is not the cross-reactive allergens in the sera used in this study or recombinant Der p10 is not capable of cross-linking IgE. Interestingly, at least 8 patients included in this study are positive to SPT using HDM extract as summarized in Table 1. When competitive inhibition assay was performed using HDM extract as competitor against shrimp extract, only 1 serum showed inhibition (Fig. 6). This result implied that some sera IgE cross-reacted with HDM and raw shrimp extract, but some reacted more specifically to shrimp extract. Tropomyosin is considered to be the link between shrimp allergy and dust mite allergy where dust mite tropomyosin may function as a primary sensitizer to shrimp allergy.9
By Western blot, sera IgE from all patients reacted positively to the raw shrimp extract at the region around 32-39 kDa and also 75% reacted to the same region in the cooked shrimp extract. In previous studies, proteins in these areas were identified to include a major shellfish allergen tropomyosin that is heat-stable and water-soluble.2223262930313233 In the sera of 3 patients (No. 4, 8, and 19), there were no detectable IgE reactivity by Western blot (Fig. 2A and C). These patients may have specific IgE against proteins that were lost during preparation or the IgE may recognize non-linear epitopes.
ELISA and Western blot are immunological methods that depend on the binding of specific IgE in sera of allergic patients to the coated allergens. The results obtained using these methods often do not correlate with data obtained from clinical history and the in vivo test (SPT).610 Furthermore, they do not provide any information on the capacity of proteins to promote IgE-mediated hypersensitivity reaction.1034 In contrast, activation of mast cell requires 2 or more epitopes on the allergen to crosslink specific IgE that bound to its receptor (FcεRI) on the surface of mast cells.34 In recent years, BAT has been used for the in vitro diagnosis of IgE-mediated hypersensitivity reactions based on the phenotypic changes induced by histamine release.353637 Recently, it was reported that the rat basophillic leukemia (RBL)-derived mast cell line was developed for the assessment of the cross-linking capacity of allergens in the measurement of allergen-specific IgE.61038 The reporter cell line RS-ATL8, was used in several studies to detect allergens in Schistosoma mansoni and egg white.123739 However, the assay of the crude raw and cooked shrimp extracts that induce IgE cross-linking using this cell line has not been reported. The results showed in Fig. 3 clearly demonstrated that the RS-ATL8 reporter cell line has high sensitivity for the detection of both crude raw and cooked shrimp allergens even at the ng/mL level. Therefore, using this reporter system, it is possible to detect allergens inducing IgE cross-linking with high sensitivity that may be used as diagnostic tools in the future.13 Different responses obtained by Western blot and EXiLE assay may reflect structural differences in allergens based on different methods of sample preparation. While Western blot mainly detects denatured proteins, EXiLE can detect native form of proteins.
In recent years, identification of the food allergens by proteomic analysis becomes one of the major approaches to discover novel allergens.40 In various studies, allergens in black tiger shrimp were identified using this approach.212241 However, it does not often accompany with the test of IgE cross-linking ability. In this study, using SDS-PAGE and Western blot, we selected 4 single bands from raw shrimp extract and 2 single bands from cooked shrimp extract that clearly bind to IgE from patient sera and used them for screening in the reporter cell line. Proteins at 38 kDa from raw shrimp extract have the ability to induce an IgE cross-linking (Fig. 4). In contrast, the proteins at 115 kDa from raw shrimp extract exhibited only weak reactivity on Western blot, but it is sufficient to induce IgE cross-linking (Fig. 4). Interestingly, the 41 kDa band from the raw shrimp extract clearly reacted with IgE on Western blot, but the eluted fraction failed to induce IgE cross-linking (Fig. 4A and C), suggesting that they are not able to crosslink IgE and induce degranulation. The 2 protein bands from the cooked shrimp extract failed to induce reporter gene activity, implying that heat treatment may destroy epitopes necessary for IgE cross-linking.
From the results obtained using the reporter cell line, we identified proteins in the 2 protein bands (38 and 115 kDa) from raw black tiger shrimp extract by MS (Table 2). The results indicated that the 115 kDa had 5 major proteins, including known shrimp allergens, such as myosin heavy chain types 1, 2, 3, 6A, and a potential novel candidate allergen, ubiquitin-activating enzyme. The band at 38 kDa contained 3 major proteins, including known allergens like glyceraldehyde-3-phosphate dehydrogenase, arginine kinase, and a novel candidate allergen crustacyanin C2.7 Arginine kinase or Pen m 2 is reported to be heat stable, but the cooked proteins at 38 kDa which may contain this protein lost the ability of IgE crosslinking, implying that heat treatment may affect IgE cross-linking.41 Ubiquitin-activating enzyme E1 and crustacyanin C2 have not been reported to be shrimp allergens. Myosin heavy chain and glyceraldehyde-3-phosphate dehydrogenase were reported as an allergen in banana shrimp (Fenneropenaeus merguiensis).31 The study by Gámez et al.32 reported the protein allergens in Solenocera melantho shrimp by using MS as α-actinin, β-actin, arginine kinase, biphosphate aldolase, fructose, sarcoplasmic calcium-binding protein, and ubiquitin. Ubiquitin-activating enzyme E1 activates ubiquitin,42 and crustacyanin is a carotenoprotein pigment that is involved in the shell color.43 In this study, we could detect only 1 black tiger shrimp allergen recognized by WHO/IUIS Allergen Nomenclature Sub-Committee. Other allergens, such as Pen m 1, were not detected in our MS analysis. This may be due to the size of protein bands excised from gel for analysis. In this study, we excised only 4 bands corresponding to molecular weights of approximately 19, 38, 41, and 115 kDa. Other proteins with differing size may not have been included in our analysis. Further studies are needed to directly test whether these newly identified proteins are true shrimp allergens by using either recombinant or native proteins. Taken together, using the RS-ATL8 cell line together with the proteomics approach may detect novel shrimp allergens with the biological function of cross-linking IgE upon binding.
 XML Download