

 PDF
PDF ePub
ePub Citation
 Print
Print


INTRODUCTION
Environmental and meteorological changes, driven by increased concentrations of greenhouse gases, have widespread impacts on biotic systems, including direct and indirect effects on human health.12 Different models suggest that an increase in the concentration of atmospheric carbon dioxide (CO2) is one of the most certain predictors of climate change. The CO2 concentration has increased by 29% since preindustrial times.3 The average tropospheric CO2 concentration has risen from 290 ppm in 1850 (preindustrial era) to 353 ppm in 1990.3 Although the atmospheric CO2 has no apparent direct effect on human health, it does have well-known effects on plants. Increased CO2 concentrations stimulate the photosynthetic rates of plants and alter their phenology.45 Plants grow larger, use water more effectively, and reach maturity faster when grown under elevated CO2 conditions.67 Studies have demonstrated the magnitudes of growth and physiologic enhancements vary considerably with environmental conditions and species identities, and some plants can display enhanced reproduction.89 Some studies suggest that this enhanced reproductive effort may lead to an increase in the pollen of ragweeds with increasing CO2 concentration.1011
Recently, climate change has become a crucial public health concern because it has the potential to alter the timing and abundance of aeroallergens, which may result in increased symptoms in patients with allergic diseases.12 However, prediction of the future threat of CO2-stimulated pollen production on public health is challenging because many factors are involved and the future state of many of those factors themselves is uncertain. Ziska and Caulfield11 demonstrated that recent and projected CO2 levels could exacerbate fire frequencies by increasing both the biomass and flammability of ragweeds. These studies implied that CO2 may be a crucial greenhouse gas for biological changes in weeds, and CO2 levels lower than 500 ppm were shown to affect ragweed pollen production. The biological basis for the observed response among invasive weeds to rising CO2 is not entirely clear. However, other environmental parameters associated with climatic change, including drought, temperature, and longer pollen seasons, have not been explicitly examined in conjunction with rising CO2 levels and could explain the phenomenon.
The ragweed (genus Ambrosia), which includes common ragweed (Ambrosia artemisiifolia) and giant ragweed (Ambrosia trifida), has long been known as one of the most common allergens causing seasonal allergic diseases in Korea. Among atopic individuals, the sensitization rate is approximately 10% and is rising annually in Korean adults.13 Both common ragweed (A. artemisiifolia) and giant ragweed (A. trifida) are C3 plants (a plant that uses a 3-carbon compound for CO2 fixation during photosynthesis, which should thrive in enriched CO2 atmospheres). The regweed is common to roadsides and disturbs habitats throughout most of Northeast Europe and North America.14 Since 1980, it can be found throughout most of the northern region of Korea.15 It is dioecious, with male and female flowers borne on distinct axillary branches, allowing for independent control of allocation to sexes.16 Pollen and specific allergens extracted from ragweed have been used in many clinical studies, and the biochemistry and genetics of the allergens and their impact on the human immune system are well understood.17 Amb a 1 is one of the components of common ragweed pollen. This pollen contains a range of different allergen components, identified by numbers and abbreviations of their Latin names, and has become one of the primary causes of seasonal pollen allergy in Korea since 2000.18
The present study aimed to investigate CO2 levels that have an impact on significant allergen production using experimental populations of ragweed in a chamber study to model future air conditions and in a field study reflecting the current air conditions in Korea.
MATERIALS AND METHODS
Ragweed establishment for chamber studies
To study pollen production by ragweed populations in elevated CO2 atmospheres, seeds of A. artemisiifolia were grown to reproductive maturity in controlled-environment glass chambers. Environmental chambers were kept at a constant CO2 concentration, a given temperature, and consistent light and humidity for 24 hours. The chambers were set up in the same space, the light intensity and time were the same, and a humidity sensor sprayer and temperature sensor air blower were used to maintain differences between the chambers. The set CO2 levels in parts per million (ppm) were 380–400 (like urban outdoor conditions), 500–520 (1.2 times the level in a highly polluted area), 600–620 (1.5 times the predicted world CO2 level in 2050), and 1,000–1,100 (2 times higher than the predicted world CO2 level in 2050)19 in each glass chamber.
Seeds were initially collected from wild populations in the Plant Lab at Daejin University and sown into 30 L growth containers. Soil in each container was composed of a 4:3 mix of Pro-Mix compost and washed sand. Containers were fertilized weekly with 500 mL of 20:20:20 NPK Peter's Solution (Scotts-Sierra Horticultural products, Marysville, OH, USA), and seeds were watered daily. Day/night temperature was maintained at 26℃/21℃ and ambient chamber light levels were approximately 70% of full sun. There were 3 containers per growth module (700 µL/L CO2 concentrations, with 20 plants established in each growth container and arranged in a regular grid. This resulted in a density of 60 plants/m, similar to that in natural field populations. All plants were watered and fertilized to maintain optimal growth.
Ragweed establishment for field studies
To evaluate real outdoor conditions, 2 stations were established, one in a rural area (near Daejin University, Pocheon, Gyeonggi-do) and the other in an urban area (near Gangnam Metro Station, Seoul). The CO2 level was measured daily with a CO2 - measuring instrument at each site during the study period (August 23–September 30). The 2 stations had different CO2 levels. The mean CO2 levels during the study period were 320±54.8 ppm in the Pocheon location and 440±78.5 ppm in the Gangnam station. Seeds of A. artemisiifolia were obtained from a common seed lot of ragweed from the Department of Bioscience, Daejin University. All seeds were mixed and distributed randomly into a common soil type at the local sites. Plants were thinned to attain an average of 1 plant per 730 cm2 of surface area (approximately 15 plants/m2) by maturity. Top growth was harvested at 2-week intervals until anthesis and again at maturity. During the final harvest, the whole plants were collected en bloc to a soil depth of 30 cm.
Both CO2 levels and air temperatures on site were related to the level of urbanization. Urbanization increased the average daily CO2 level by 30% compared to that in the rural area. The difference in CO2 levels was 150 ppm. We calculated an average daily temperature increase of 1.5℃ for the urban site relative to the rural area, by dividing cumulative degree differences by the number of ragweed growing days. The temperature gradient between the urban and rural areas was consistent with measurements in recent years.
Pollen collection
Pollens were collected and pooled from the 10 central plants during the peak of the flowering season (August 23–September 30, 2013 and 2014). They were collected on the same day in both study groups. A polyethylene bag (5×25 cm) was placed over each spike with a 2- to 2.5-cm slit cut 2 cm from the bottom of the bag, into which the floral spike was placed. After placement of the bag, the slit was taped such that the floral spike was inside the bag with at least 5 cm of space from the top of the open bag. The tops of the bags were left open for air circulation and ventilation. The floral bags were tapped gently each day until all flowers completely dehisced. The floral structure was subsequently removed from the bag after tapping out any residual pollen. The total pollen for a 5-spike plant was calculated by subtracting the initial bag weight from the bag and pollen weights. The total number of floral spikes was recorded at plant maturity. Next, the spikes were harvested and the dry weight (without pollen) was recorded. We found that the ratios of pollen collected to the dry weight of the floral structure were consistent, so that we were able to estimate pollen production for each plant. Following pollen collection, all collection bags from each mature plant for a given CO2 treatment were kept frozen at −70℃ until pollen analysis.
Protein extraction of pollen
All pollen-bearing shoots of each plant were vigorously shaken within a large Teflon-coated funnel (DuPont, Wilmington, DE, USA) that opened at its narrow end into a collection vial filled with 50 mL of ethanol. To estimate pollen concentration, 5-mL samples of well-mixed pollen-ethanol solution were transferred to glass vials and dried for 24 hours in an oven. We kept the oven temperature low to prevent allergen denaturation.
After pollen removal from plants, all mature seeds were removed from each shoot, and along with the total shoot biomass, they were oven-dried and weighed.
Each pollen sample (10 mg) was suspended in 200 µL of 0.5% NaCl plus 0.25% NaHCO3 (wt/vol) solution in water with the modifications designed to obtain purified and optimized pollen, which yielded allergen (Amb a 1). Pollen suspensions were sonicated at 0℃ with a Fisher Model 550 Sonic dismembrator (Fisher Scientific, Pittsburgh, PA, USA) fitted with a micro-tip (3.2 mm diameter). The sonicated suspensions were held on ice with occasional mixing in various periods. Following the extraction period, particulates were removed by centrifugation for 10 minutes at 13,000×g at 6℃. The supernatant fluid was withdrawn carefully from the pellet, and the volume of each extract was measured. Protein concentration in each of the final extracts ranged from 0.21 to 0.31 mg/mL. Amb a 1 was quantified using a modified kinetic-based enzyme-linked immunosorbent assay (ELISA) method. Pollen protein samples were diluted initially to 2.5×10⁻⁴ mg/mL.
An equal volume of 50% (wt/vol) glycerol was added to each sample, and the extracts were held at −20℃. We examined the following extraction conditions: 1) pollen was suspended in Coca's solution, sonicated as described, and incubated with occasional mixing on ice for 2 hours or overnight; 2) pollen was suspended in Coca's solution supplemented with 1.0% Tween 20 nonionic detergent, sonicated, and kept as above; and 3) pollen was pre-wet with 0.1 volume 95% ethanol, 0.9 volume of Coca's solution containing 1.0% Tween 20, and the suspension was sonicated and kept as above. The Bradford method was used for protein quantification. Overall, the use of detergent in the extracting medium led to an approximately 3-fold increase in protein extracted compared to Coca's salt solution alone.
Immunochemical quantification of Amb a 1
We determined the concentration of Amb a 1 allergen by an ELISA on equivalent amounts of protein from different extraction methods. Pollen protein extracts were diluted to initial concentrations of 2.5×10⁻⁴ mg protein/mL in 0.05 M sodium carbonate buffer, pH 9.6; linear dilutions over a 10-fold range were prepared in the same buffer as for ELISA analysis. Bovine serum albumin (Sigma-Aldrich Corp., St. Louis, MO, USA) was used as a blocking agent to prevent nonspecific protein binding. Plates were developed with 1 mM H2O2 and 2 mM 2.2′-azino-bis (3-ethylbenthiazoline-6-sulfonic acid; Sigma-Aldrich Corp.) in 0.2 M phosphate-0.10 M citrate (pH 5.0) buffer. The rate of color development at 415 nm was measured with a 96-well plate reader (Bio-Rad Laboratories, Hercules, CA, USA). The concentration of allergen in each given sample was defined using arbitrary ELISA units. Plots of ELISA units against protein yielded straight lines; the slope of each line provided an estimate of the allergen level as a function of protein.
Statistical analysis
All statistical analyses were performed using SPSS software version 15 (SPSS Inc., Chicago, IL, USA). The data are expressed as medians and means±standard deviations. The Mann-Whitney test was used for comparisons between ragweed Amb a 1 concentrations from Gangnam and Pocheon Station in the field study; the Kruskal-Wallis test was used for ragweed Amb a 1 concentration comparisons in the chamber study. A P value of <0.05 indicates statistical significance.
RESULTS
Comparison of Amb a 1 pollen concentrations under different CO2 levels in the chamber study
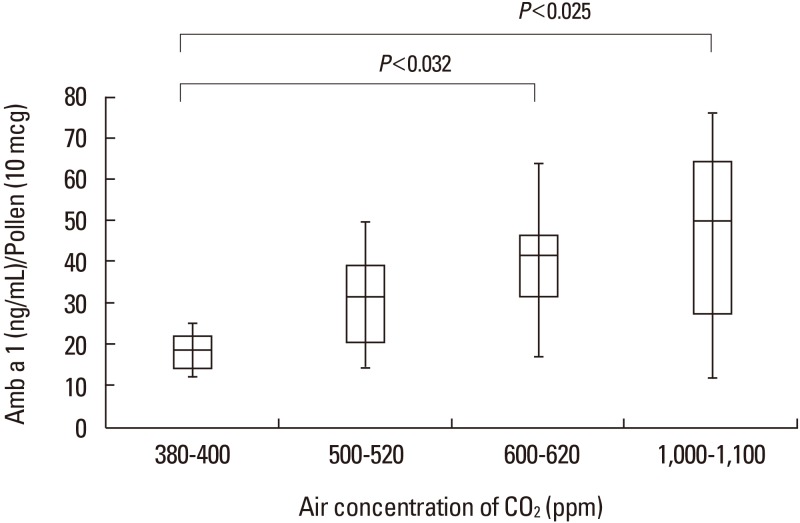
In the glass chamber study, the median concentrations of Amb a 1 increased with rising CO2 concentrations (1.88 ng/µg pollen in the 380–400 ppm chamber, 3.14 ng/µg pollen in the 500–520 ppm chamber, 4.44 ng/µg pollen in the 600–620 ppm chamber, and 5.36 ng/µg pollen in the 1,000–1,100 ppm chamber). There were significantly different concentrations of Amb a 1 between the chambers with 380–400 and 600–620 ppm of CO2 (P<0.032) as well as between the chambers with 380–400 and 1,000–1,100 ppm CO2 (P<0.025). However, there was no significant difference in the concentration of Amb a 1 between chambers with 380–400 and 500–520 ppm CO2 (Figure).
Comparison of the concentration of Amb a 1 among different CO2 levels in the field study
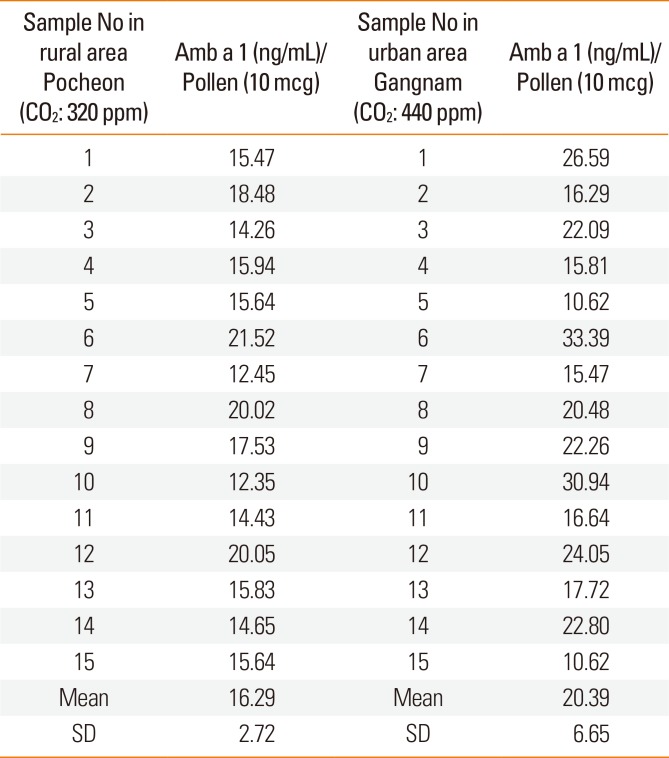
The mean concentration of Amb a 1 from ragweed was higher in the Gangnam area than in the Pocheon area. However the difference was not significant (1.63±0.3 ng/µg pollen at the 320±54.8 ppm CO2 vs. 2.04±0.7 ng/µg pollen at the 440±78.5 ppm CO2) (Table).
DISCUSSION
The present study shows that the concentration of Amb a 1 increased according to increasing CO2 concentrations in both the chamber and field studies. However, there was no statistically significant difference between Amb a 1 concentrations in the urban area and rural areas.
The relationship between potential climatic or meteorological factors and atmospheric pollen concentrations (i.e., changes in pollen type and abundance associated with global climatic change) has not been elucidated. In addition, the effects of environmental changes on allergic disease are not completely understood.18 Less is known concerning the direct stimulation of growth and pollen production of allergenic plants by rising levels of CO2, which is one of the principal greenhouse gases. Ragweed pollen concentration was increased by 131% in the preindustrial time (CO2, 280 ppm) and by 320% in the current time (CO2, 370 ppm).11 In the projected 21st century, CO2 concentration (CO2, 600 ppm) are predicted to cause an increase in the number and size of the floral spikes.10 The Amb a 1 concentration in ragweed pollen has been shown to increase as a function of the CO2 concentration,20 but a well-demonstrated difference in allergen content between individual ragweed populations is still lacking.
In this study, we showed increased Amb a 1 concentrations at CO2 levels over 600 ppm, which are higher than the current 380–400 ppm levels in urban areas. These results are similar to those in previous studies, but we predict increases in ragweed pollen production by 230% and 272% with CO2 level changes from the current 380–400 ppm to future 600–620 ppm and to 1,000–1,100 ppm levels. This suggests that a significant impact of pollen allergens will only be evident once the CO2 surpasses 600 ppm. This chamber study results may explain the lack of a significant difference in the ragweed pollen content between our field study sites, which had plants grown under 320 and 440 ppm of CO2 (well below the 600 ppm mark).
Several possible reasons may explain why the pollen concentration did not increase proportionally to the CO2 increments in the field study. First, the environmental basis for qualitative differences remains unclear. In other words, the levels of ambient pollutants, such as O3, NO2, and NO3, as well as the soil nitrogen content, do not vary consistently.21 The ground biomass and reproduction activity of ragweed have been reported to increase with CO2 and average temperature changes.22 Over a longer period of time, these factors are likely to impact on the relative abundance and geographic distribution of plant species,21 possibly altering the demographics of populations currently exposed to allergenic species.10 Second, the underlying physiologic basis for qualitative differences in ragweed pollen is also unclear. The current studies suggest that the change in CO2 concentration is one of the possible environmental factors associated with allergenicity, which is not be the only factor influencing levels of Amb a 1 expression.2022
The prevalence of allergic diseases is expected to increase with rising CO2 levels.1822 Although several studies suggest that changes in CO2 levels influence the levels of Amb a 1 expression,1013 the relationship between pollen production and environmental changes may be complex and attributed to other factors.2023 Nevertheless, climate change has been implicated in seasonal allergic disease.202425 Moreover, studies on the role of rising atmospheric CO2 levels with respect to distribution, growth, and pollen production of weeds impacting human health need to be conducted to help clarify the correlation between climate change and pollen allergy and as well as take plan ahead.
In conclusion, the common ragweed allergen (Amb a 1) content increased significantly when CO2 concentration was elevated over 600 ppm in our chamber study. On the other hand, there was no significant difference in the Amb a 1 concentration between the pollens from Pocheon and the Gangnam area in our field study, possibly due to differences in confounding factors (drought stress, ozone, day length, and temperature).
Further, studies are needed to confirm the association between pollen allergy and CO2 levels. Our study results suggest that CO2 lvels above 600 pm may have a big impact on allergen content in pollen.
 XML Download