

 PDF
PDF ePub
ePub Citation
 Print
Print


INTRODUCTION
Mucins are the major glycoprotein components of mucus and play an important role in maintaining mucosal integrity.1 It has been shown that changes in the expression of mucins might contribute to cancer cell growth, immune recognition, and cellular adhesion of gastric epithelial cells, which in turn might increase the risk of their malignant transformation23 and influence their invasive and metastatic capabilities. Helicobacter pylori (H. pylori) infection is the major risk factor for gastric cancer (GC), and H. pylori has been classified as a class I carcinogen by the World Health Organization.4 It is able to bind to specific mucins in the gastric mucosa,5 and it has been reported that it can elicit changes in the expression of mucins in the stomach.2678 In addition, H. pylori can modulate the expression of various mucin components via urease in order to facilitate its movement in viscous surroundings.7 In view of the significance of H. pylori for GC tumorigenesis,9 the identification of virulence factors potentially involved in changes in the expression of mucins is an important topic. It has been shown previously that CagA is associated with the modification of intracellular signal transduction pathways and the cellular phenotype transformation of gastric cells.1011 Indeed, the risk of GC is significantly higher in individuals infected with H. pylori strains expressing the oncoprotein CagA.12 A previous study13 showed that H. pylori may cause changes in mucin expression through its virulence factors (CagA and urease). Urease mainly produces ammonia by hydrolyzing urea, and plays a role in preventing stomach acid from stabilizing H. pylori. Therefore, we speculate that CagA and the urease metabolite ammonium ( ) may mediate the expression of mucin in AGS cells. However, the previous study did not exclude the effect of other pathogenic factors of H. pylori on mucin in AGS cells. In this study, after excluding the interference of other pathogenic factors of H. pylori, we respectively investigated the effects of CagA and urease metabolites on mucin expression in AGS cells by transfecting CagA overexpression plasmid into AGS cells or treating AGS cells (transfected CagA and untransfected) with different concentrations of ammonium ions, and detected changes in the expression of mucin in AGS cells in each group.
) may mediate the expression of mucin in AGS cells. However, the previous study did not exclude the effect of other pathogenic factors of H. pylori on mucin in AGS cells. In this study, after excluding the interference of other pathogenic factors of H. pylori, we respectively investigated the effects of CagA and urease metabolites on mucin expression in AGS cells by transfecting CagA overexpression plasmid into AGS cells or treating AGS cells (transfected CagA and untransfected) with different concentrations of ammonium ions, and detected changes in the expression of mucin in AGS cells in each group.MATERIALS AND METHODS
This experimental study was divided into two parts: 1) First, the human GC cell line AGS was transfected with a CagA expression vector, and the expression of mucins in these cells was examined. In this part, control cells (CK), empty-plasmid transfected cells (pCDNA3.1), and cells transfected with CagA expression vector (pCDNA3.1-CagA) were established. 2) In the second part, different concentrations of ammonium chloride were added to the AGS cell culture medium, and the expression of mucins in AGS cells was detected.
Cell lines and cell culture
The AGS gastric adenocarcinoma cell line was purchased from the Shanghai Cell Bank (Shanghai, China). AGS cells were cultured in Ham's F-12 medium (Library of the Shanghai Academy of Biological Sciences, Shanghai, China) supplemented with 10% fetal calf serum, and were maintained at 37℃ under a 5% CO2 atmosphere.
CagA transfection experiments
The vector used for the expression of CagA protein was the pcDNA 3.1 plasmid obtained from Life Technologies (Carlsbad, CA, USA). The CagA-coding insert was established by total gene synthesis. For transfection of AGS cells, 4 µg of the CagA plasmid and 6 µL of Lipofectamine® 2000 (Invitrogen, Carlsbad, CA, USA) were added to 200 µL of F12 medium. After mixing and incubation for 20 min, the mixture was added to AGS cells that had reached 75% cell confluence.
Verification of CagA protein expression
Protein expression of the CagA transgene in AGS cells was verified by western blotting. In brief, total proteins were extracted from nontransfected AGS cells, vector control-transfected AGS cells, and AGS cells transfected with CagA-encoding plasmid. The CagA levels were assessed by electrophoresis on a polyacrylamide gel, followed by transfer to a polyvinylidene difluoride (PVDF) membrane (Invitrogen). After washing three times with Tris-buffered saline containing Tween 20 for 15 min, the PVDF membrane was incubated with the secondary antibody (sc-25766; Invitrogen) for 1 h at room temperature, followed by repeated washing and enhanced chemiluminescence detection (Beyotime Biotechnology, Shanghai, China), according to the manufacturer's specifications and routine procedures using a gel imaging analyzer (Chemidoc XRS+, Bio-Rad, Hercules, CA, USA).
Treatment of AGS cells and CagA- transfected AGS cells with ammonium chloride
Different concentrations of ammonium chloride (5, 10, 15, and 20 mM) were added into the culture medium of nontransfected or transfected AGS cells. The culture conditions were the same as described above. After 24 h, expression of mucins in these cells was detected.
qPCR analysis of mRNA expression
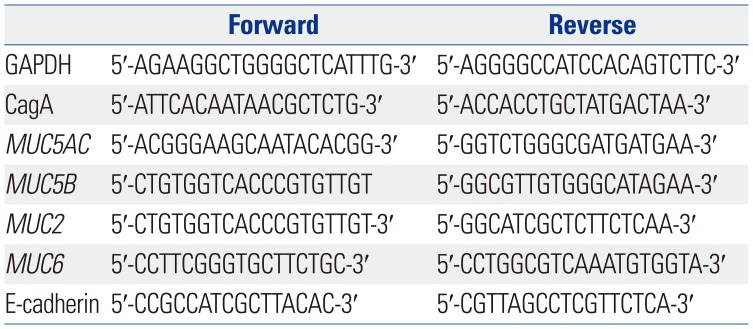
The Gene IDs for GAPDH, MUC5AC, MUC5B, MUC2, MUC6, and E-cadherin were 2597, 4586, 727897, 4583, 4588, and 999, respectively. The expected lengths of the GAPDH, MUC5AC, MUC5B, MUC2, MUC6, and E-cadherin PCR products were 258, 281, 293, 399, 242, and 298 bp, respectively. The primer sequences used in the qPCR analysis are listed in Table 1.
For the qPCR amplification reaction, 10 µL of IQ SYBR Green Supermix (Tiangen Biotech Co., Ltd., Beijing, China) was used in conjunction with 1 µL of the forward primer (10 µM), 1 µL of the reverse primer (10 µM), and 8 µL of water. The CFX connect Real-Time PCR System (ver. 3.0: Bio-Rad) was used to perform qPCR reaction as follows: 50.0℃ for 3 min, 95.0℃ for 15 min, 95.0℃ for 10 s, 59℃ for 25 s, and 72℃ for 25 s for 40 cycles, followed by melting curve analysis, which was performed from 70℃ to 95℃ at a 0.5℃ increment for 0.05 s, followed by plate reading.
Immunofluorescent analysis of mucin expression
Cells exposed to the described transfection and treatments were grown for 24 h in 24-well plates under standard conditions, washed three times with phosphate-buffered saline (PBS) for 5 min, and fixed with a 4% paraformaldehyde solution for 20 min. Subsequently, the samples were washed with PBS twice for 5 min and permeabilized using a 20-min incubation with 0.1% Triton X-100 in PBS. After two further washes for 5 min with PBS, nonspecific immunoreactivity was blocked with a 30-min incubation in 2% fetal bovine serum in 0.3 M glycine at 37℃ (plates were sealed). Next, the appropriate primary antibody for a specific mucin (1:50; Santa Cruz Biotechnology) was added, and samples were incubated overnight at 4℃. The next day, fluorescently labeled (Alexa Fluor® 555) secondary antibody (1:800; Invitrogen) was added, and the experimental samples were incubated under humidified conditions for 1 h at 37℃. For staining nuclei, 4′,6-diamidino-2-phenylindole was added, and samples were incubated for 30 min before being washed three times with PBS for 5 min each. Finally, cells were mounted on glass slides and analyzed by fluorescence microscopy (IX73, Olympus, Tokyo, Japan) to assess the subcellular distribution of mucins.
Statistical analysis
The results of qPCR analysis of CagA and mucin mRNA expression in AGS cells were calculated and analyzed using the CFX Manager PCR analysis software from Bio-Rad. Following densitometric analysis using ImageJ software (National Institutes of Health, Bethesda, MD, USA), CagA protein levels as detected by western blotting were determined. Statistical analyses were performed using SPSS 12.0 statistical software (SPSS Inc., Chicago, IL, USA). The data were then analyzed using Student's t test or by the one-way analysis of variance test for selected data pairs using the Tukey post hoc test. p-values less than 0.05 were considered statistically significant.
RESULTS
Establishment of forced CagA expression in gastric AGS cancer cells
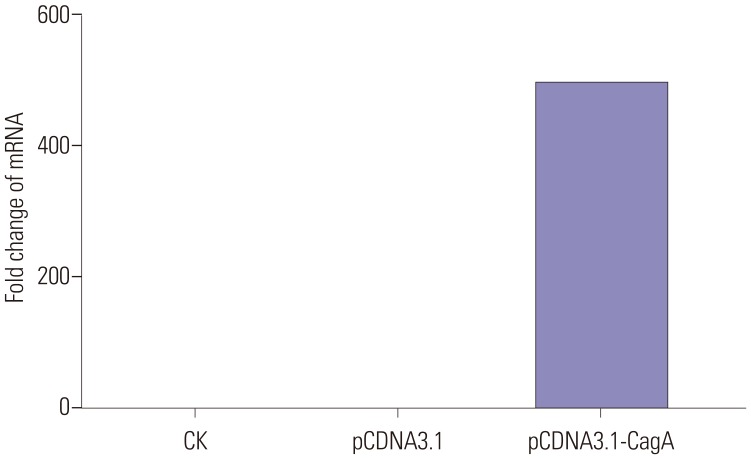
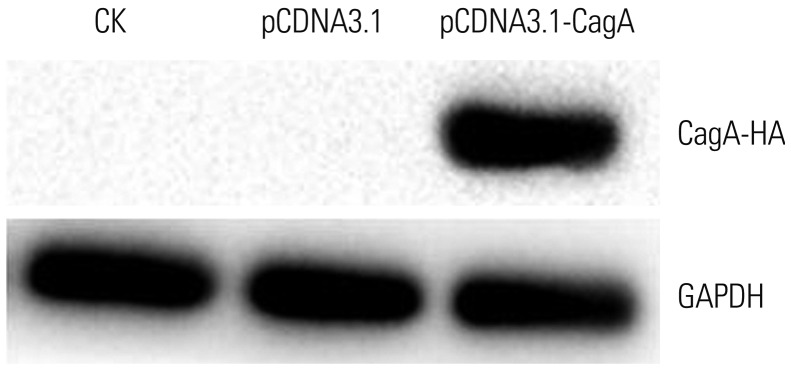
To establish a model of GC epithelium, AGS cells were transfected with a CagA-expressing plasmid, and the results of all performed analyses were compared to those in AGS cells transfected with an empty vector or not transfected. This strategy successfully established heterologous CagA expression at the RNA level. CagA expression levels in all experiments as detected by qPCR are shown in Fig. 1. From these experiments, we have observed that CagA mRNA expression in pCDNA3.1-CagA cells was significantly higher than that in cells transfected with empty pCDNA3.1 vector or in untreated AGS cells (p< 0.01 and p<0.001, respectively). At the protein level, the induction of forced CagA expression was also successful. Fig. 2 shows a western blot of all experimental groups, revealing only CagA expression in the CagA-transfected cells. Based on these results, we concluded that our experimental set-up allowed us to assess the effect of forced CagA expression on mucin levels in AGS cells.
CagA expression changes the expression of functional mucins
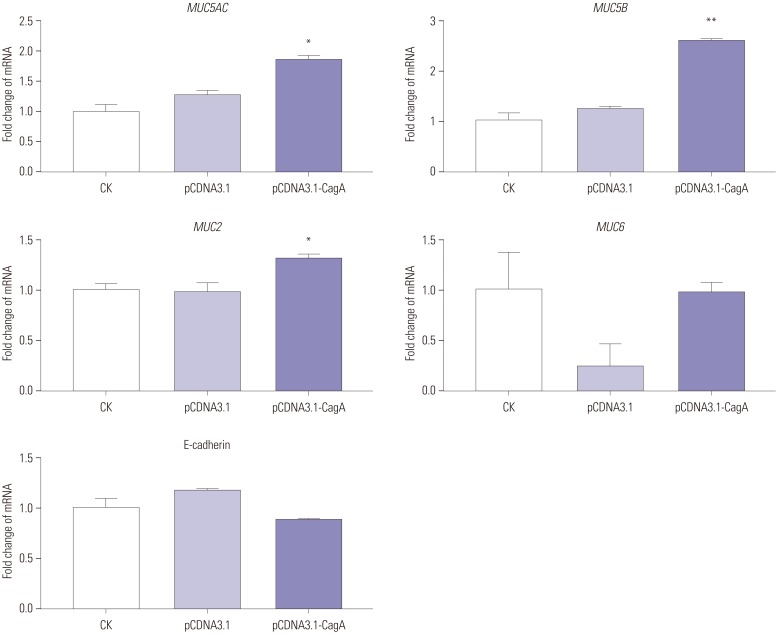
Next, AGS cells transfected with CagA were probed for MUC5AC, MUC5B, MUC2, MUC6, and E-cadherin expression using qPCR, and the results were compared to the appropriate controls. As evident in the results presented in Fig. 3, heterologous CagA expression increased MUC5AC, MUC5B, and MUC2 expression at the RNA level. MUC5AC (p<0.01), MUC5B (p<0.001), and MUC2 (p<0.01) expression levels in pCDNA3.1-CagA-transfected cells were significantly higher than those in the pCDNA3.1 and CK cells. The mRNA expression of MUC6 in pCDNA3.1-CagA cells was higher than that in pCDNA3.1 cells (p<0.001). No significant differences in MUC6 and E-cadherin expression were observed between pCDNA3.1-CagA and CK cells (p>0.05 for both).
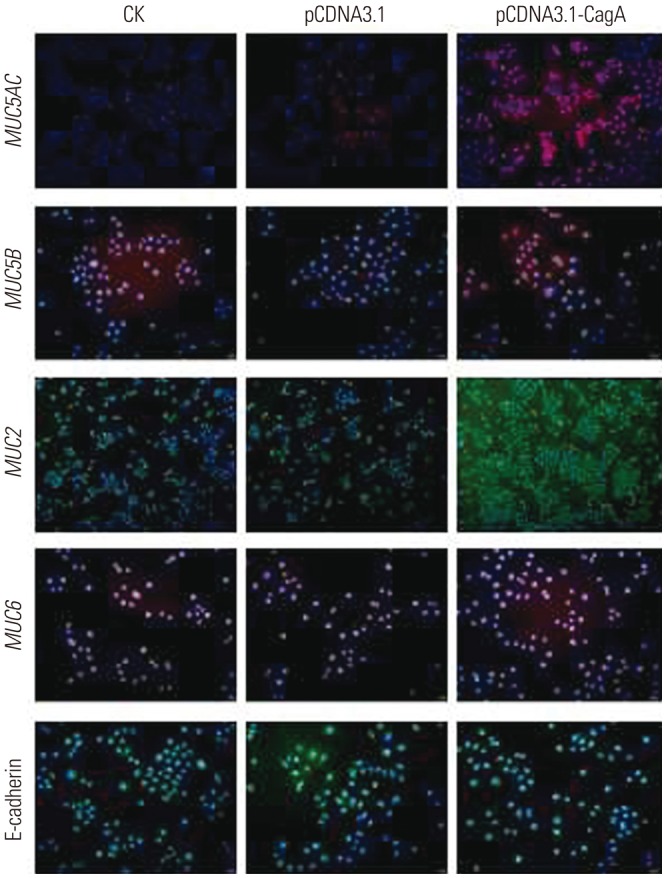
As shown in Fig. 4, these results were further confirmed by immunofluorescence assays, which demonstrated substantial changes in the expression of mucins following transfection of AGS cells with the CagA expression-driving plasmid, as compared to the relevant controls. We, therefore, concluded that CagA is sufficient to provoke changes in the expression of mucins in GC cells.
induced changes in functional mucins
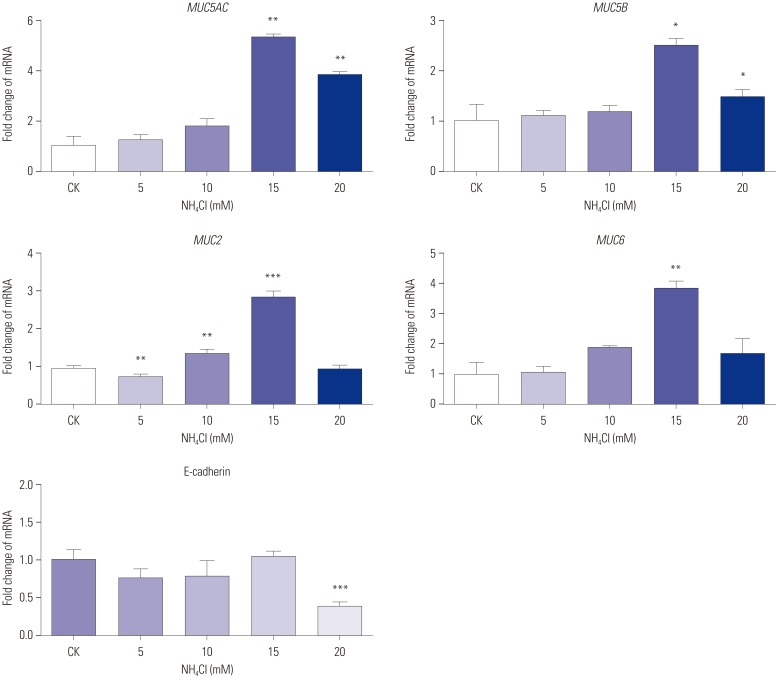
AGS cells cultured with different concentrations of were examined for MUC5AC, MUC5B, MUC2, MUC6, and E-cadherin mRNA expression using qPCR. As evident from the results presented in Fig. 5, the mRNA expression of most mucins (MUC5AC, MUC6, MUC2) increased with increases in ammonium ion concentrations, reaching peak levels at 15 mM , followed by decreased mRNA expression with any further increase in the ammonium ion concentration. The expression of MUC5B mRNA in AGS cells increased at an concentration of 15 mM, and then decreased. MUC5AC (p< 0.01), MUC6 (p<0.01), MUC2 (p<0.001), and MUC5B (p<0.05) mRNA expression in ASG cells treated with the ammonium ion concentration of 15 mM were significantly higher than these levels in untreated cells. No significant change in the mRNA expression of E-cadherin was observed with an ammonium concentration below 20 mM.
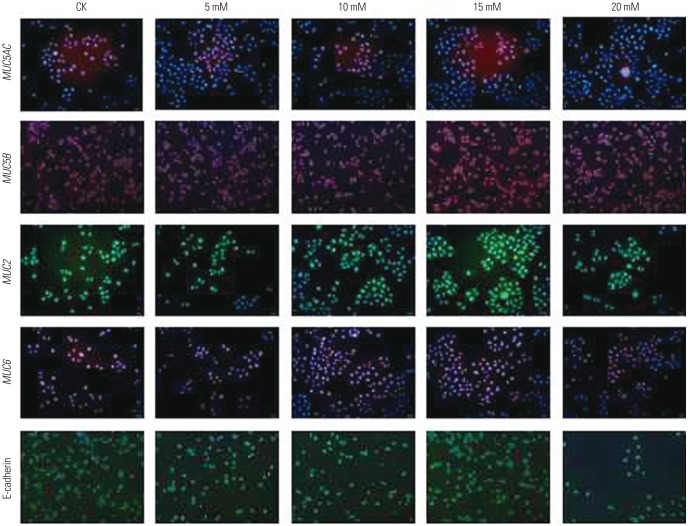
were examined for MUC5AC, MUC5B, MUC2, MUC6, and E-cadherin mRNA expression using qPCR. As evident from the results presented in Fig. 5, the mRNA expression of most mucins (MUC5AC, MUC6, MUC2) increased with increases in ammonium ion concentrations, reaching peak levels at 15 mM , followed by decreased mRNA expression with any further increase in the ammonium ion concentration. The expression of MUC5B mRNA in AGS cells increased at an concentration of 15 mM, and then decreased. MUC5AC (p< 0.01), MUC6 (p<0.01), MUC2 (p<0.001), and MUC5B (p<0.05) mRNA expression in ASG cells treated with the ammonium ion concentration of 15 mM were significantly higher than these levels in untreated cells. No significant change in the mRNA expression of E-cadherin was observed with an ammonium concentration below 20 mM.As shown in Fig. 6, these results were further confirmed by immunofluorescence assays, which demonstrated substantial changes of mucin expression following treatment of AGS cells cultured in the presence of different concentrations.
concentrations. Effect of on the expression of mucins in CagA-transfected AGS cells
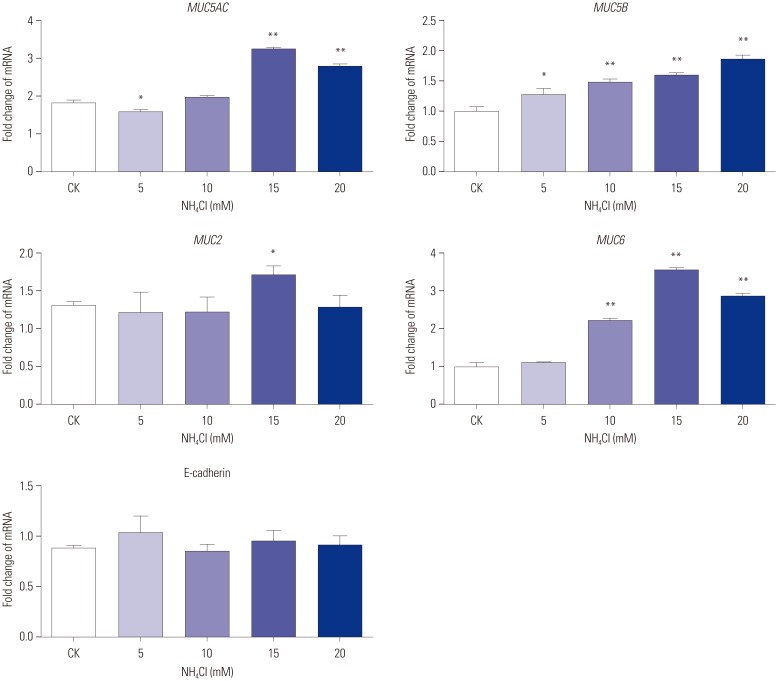
CagA-transfected AGS cells cultured with different concentrations of were examined for MUC5AC, MUC5B, MUC2, MUC6, and E-cadherin mRNA expression using qPCR. The expression of MUC5AC (p<0.01), MUC2 (p<0.05), and MUC6 (p<0.01) mRNA in CagA-transfected AGS cells at concentration of 15 mM were significantly higher than those at 0 mM. The expression of MUC5B mRNA increased with increases in concentration, and was significantly higher than that in untreated cells (5 mM vs. 0 mM, p<0.05; 10 mM vs. 0 mM, p<0.01; 15 mM vs. 0 mM, p<0.01; 20 mM vs. 0 mM, p<0.01). No significant change in the expression of E-cadherin mRNA was observed under different concentrations (Fig. 7).
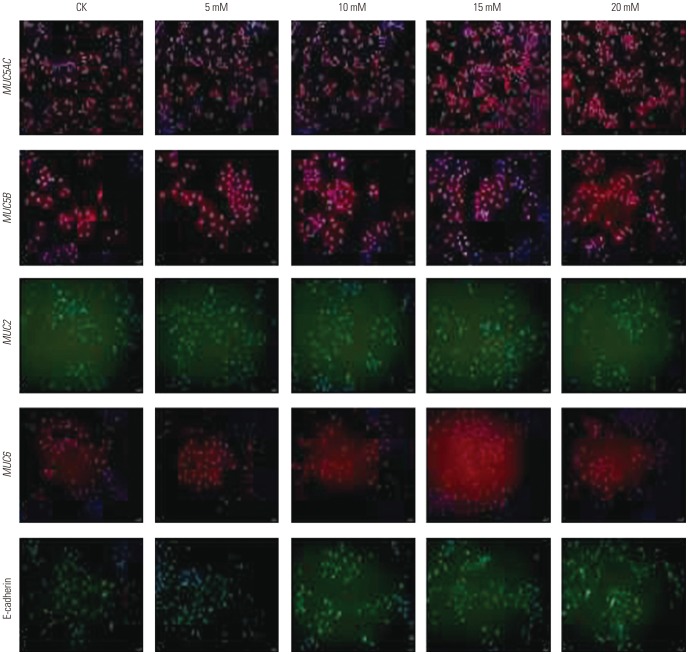
were examined for MUC5AC, MUC5B, MUC2, MUC6, and E-cadherin mRNA expression using qPCR. The expression of MUC5AC (p<0.01), MUC2 (p<0.05), and MUC6 (p<0.01) mRNA in CagA-transfected AGS cells at concentration of 15 mM were significantly higher than those at 0 mM. The expression of MUC5B mRNA increased with increases in concentration, and was significantly higher than that in untreated cells (5 mM vs. 0 mM, p<0.05; 10 mM vs. 0 mM, p<0.01; 15 mM vs. 0 mM, p<0.01; 20 mM vs. 0 mM, p<0.01). No significant change in the expression of E-cadherin mRNA was observed under different concentrations (Fig. 7).As shown in Fig. 8, these results were further confirmed by immunofluorescence assays, which demonstrated substantial changes of mucin expression following the treatment of CagA-transfected AGS cells cultured in the presence of different concentrations.
concentrations.DISCUSSION
H. pylori has been implicated as one of the major causative agents of GC. Previous studies have indicated a potential link between H. pylori, mucins and GCn714; however, the exact mechanism by which H. pylori contributes to changes in the expression patterns of mucins has not been clarified. It has been reported previously that H. pylori infection is correlated with a decrease in MUC5AC protein expression in GC tissue,3 and that it may further accelerate the GC progression by decreasing MUC5AC expression.6
MUC5B is expressed de novo in gastric mucosa only in gastric tumors,15 and infection with H. pylori was correlated with increased MUC5B expression.16 Moreover, it has also been reported that MUC6 is aberrantly expressed in response to H. pylori infection,17 and that its expression is lower in GC, compared with normal gastric mucus tissue.18 In GC, expression of MUC2 is increased21920 and may be activated by proinflammatory cytokines expressed after H. pylori infection, leading to its overexpression.21 E-cadherin methylation is an early event in gastric carcinogenesis and is initiated by H. pylori infection.22
Collectively, these data demonstrate that the occurrence and development of GC caused by H. pylori is often determined by its virulence factors.23 In addition, it has been shown that H. pylori infection causes alterations in the expression patterns of mucins in gastric mucosa, and it is suspected that these alterations are involved in H. pylori-induced gastric carcinogenesis.2425 However, little is known about whether H. pylori causes changes in the mucin expression patterns through its virulence factors, CagA and urease. Previous reports13 showed that alterations in mucin expression likely involve bacterial CagA and urease, as evident from experiments involving AGS GC cells infected with wild-type H. pylori strains and the UreB-isogenic mutant. Still, the exact interaction between H. pylori infection and mucin expression remained only partly resolved. We, therefore, decided to examine which of the two virulence factors, CagA or urease, influence the gene expression of different mucins in AGS GC cells.
In our study, MUC5AC expression was significantly upregulated upon the introduction of cellular CagA and/or in the ammonium chloride environment, which is consistent with individual literature reports,13 but contrary to other reports.362627 However, these two results may not be contradictory. Presumably, injection of CagA into the gastric epithelial cytosol and the release of urease to produce present two obvious countermeasures of H. pylori against gastric epithelial defensive downregulation of the MUC5AC glycoprotein in response to bacterial infection. Evidence that MUC5AC not only colocalizes with H. pylori but also functions as an important H. pylori receptor tethering it to the gastric mucosa5 is overwhelming and not disputed. Thus, it is reasonable to speculate that H. pylori creates a favorable environment by stimulating gastric epithelial MUC5AC production, which facilitates bacterial adherence. In this sense, injection of CagA into gastric epithelial cells and the release of urease to produce 28 may stimulate these cells to upregulate MUC5AC early in the infectious process, causing a transient increase in MUC5AC that facilitates further colonization. A subsequent interaction between the bacterium and the gastric cell provokes morphological changes in the cell and host-cell epithelial barrier injury that is associated with H. pylori infection.29
present two obvious countermeasures of H. pylori against gastric epithelial defensive downregulation of the MUC5AC glycoprotein in response to bacterial infection. Evidence that MUC5AC not only colocalizes with H. pylori but also functions as an important H. pylori receptor tethering it to the gastric mucosa5 is overwhelming and not disputed. Thus, it is reasonable to speculate that H. pylori creates a favorable environment by stimulating gastric epithelial MUC5AC production, which facilitates bacterial adherence. In this sense, injection of CagA into gastric epithelial cells and the release of urease to produce 28 may stimulate these cells to upregulate MUC5AC early in the infectious process, causing a transient increase in MUC5AC that facilitates further colonization. A subsequent interaction between the bacterium and the gastric cell provokes morphological changes in the cell and host-cell epithelial barrier injury that is associated with H. pylori infection.29
Previous studies indicated that human H. pylori infection increased MUC5B expression in the gastric mucosa,1630 which is consistent with our results. However, these studies did not explain how H. pylori induces the upregulation of MUC5B expression. Our results demonstrated that the expression of MUC5B was significantly upregulated in CagA-transfected AGS cells, as well as in AGS cells (non-transfected or CagA-transfected) exposed to ammonium salts. MUC5B is expressed only during a brief period of fetal life in the human stomach, and its expression is later detected only in GC.15 Therefore, MUC5B expression may be one of the events in the initial process of gastric carcinogenesis induced by H. pylori. Furthermore, in this process, CagA and ammonium ions are involved in the upregulation of MUC5B expression. In addition, MUC5B expression has previously been shown to be associated with the coexpression of MUC5AC,15 which may also allow for increased binding of H. pylori.30 Similarly, it can be speculated that CagA and ammonium ions are also involved in the upregulation of MUC2 expression, since its expression is increased in GC, compared to normal gastric mucosa,21920 and altered MUC2 expression has been reported in H. pylori-infected intestinal metaplasia.31 Previous studies have shown that MUC2 up-regulation is associated with the H. pylori virulence factors CagA and urease.13 In addition MUC2 might be activated by proinflammatory cytokines expressed after H. pylori infection, leading to its overexpression.14 However, CagA is just one of the proinflammatory cytokines of H. pylori,32 and ammonium ions are the final metabolite of urease function. Therefore, our results support the previous conclusions and support that CagA and ammonium ions might be factors inducing activation of MUC2 expression in AGS cells.
Interestingly, we found no effect of CagA on MUC6 expression, which is in contradiction with the upregulation or downregulation of MUC6 expression induced by H. pylori that has been reported previously.78 However, when AGS cells (nontransfected or CagA-transfected) were exposed to ammonium salt in our study, the expression of MUC6 was significantly upregulated. Our results, therefore, support the conclusion that H. pylori may induce the upregulation of MUC6 expression through its urease metabolites, ammonium irons, rather than CagA. Furthermore, increased MUC6 expression may help inhibit colonization, using MUC6 antibiotic properties.7
Downregulation of E-cadherin induced by H. pylori is a key step in the pathogenesis of GC. Indeed, few studies have shown that the downregulation of E-cadherin induced by H. pylori is regulated by its virulence factor, CagA.3334 However, our results do not corroborate these previous reports. In fact, in our study, AGS cells transfected with CagA or AGS cells (non-transfected or CagA-transfected) exposed to ammonium salts did not show any changes in E-cadherin expression. It is well known that H. pylori plays an important role in the carcinogenesis of intestinal type of GC. E-cadherin is closely related to the hereditary diffuse GC, which is caused by a genetic mutation rather than by H. pylori infection. In intestinal type GC cases, no significant difference in E-cadherin expression between H. pylori negative and positive cases was observed.35 Therefore, we speculate that CagA might have no effect on E-cadherin expression in AGS cells predominately exhibiting the intestinal phenotype.25
A limitation of this study is that we did not examine the influence of H. pylori VacA virulence factors or whether CagA and ammonium ions have an effect on expression of mucins of other GC cell lines. These issues will need be addressed in future studies.
In conclusion, H. pylori may affect the expression of mucins via CagA and/or urease ammonium ion. CagA was found to upregulate MUC5AC, MUC2, and MUC5B expression, but to have no effect on MUC6 and E-cadherin expression in AGS cells. Ammonium ions increased MUC5AC, MUC2, MUC5B, and MUC6 expression and had no effect on E-cadherin expression in AGS cells.
 XML Download