

 PDF
PDF ePub
ePub Citation
 Print
Print


INTRODUCTION
Ticagrelor, a rapid-onset, direct-acting P2Y12 receptor antagonist, demonstrated superior short- and long-term clinical outcomes over clopidogrel in large clinical trials.12 In addition to antagonizing P2Y12 receptor, ticagrelor has been reported to block adenosine receptor in patients with acute myocardial infarction (AMI) and increase endothelial progenitor cell numbers, which may contribute to endothelial regeneration.34 However, it is still unknown if ticagrelor accelerates neointimal healing at an early period after percutaneous coronary intervention (PCI) in patients with AMI. Therefore, we sought to compare the effect of ticagrelor and clopidogrel on strut coverage at 3 months after drug-eluting stent (DES) implantation in patients with AMI, using optical coherence tomography (OCT).
MATERIALS AND METHODS
Study population
This study was designed as a prospective, open-label, randomised controlled trial (NCT02037412). Patients (aged 20–80 years) with AMI who were undergoing early invasive strategy were eligible for this study. Exclusion criteria were as follows: 1) any contraindication to ticagrelor or clopidogrel, 2) cardiogenic shock, 3) PCI without stent implantation, 4) anemia or thrombocytopenia, 5) oral anticoagulation therapy, 6) pregnancy or potential for childbearing in women, and 7) life expectancy of <12 months. Study protocol was separately approved by the Institutional Review Board of each participating institute (IRB No. 4-2013-0764), and all patients signed a written informed consent form.
Randomization and procedures
Eligible patients were randomly assigned in a 1:1 ratio to receive either ticagrelor or clopidogrel, using an interactive webbased response system with a permuted block randomisation method. The patients received aspirin (300 mg as a loading dose or 100 mg if previously administered) and a loading dose of the study drug (180 mg of ticagrelor or 300 to 600 mg of clopidogrel) before PCI. All patients with ST-elevation AMI underwent primary PCI. For revascularisation of culprit lesions, only thin-strut biodegradable polymer sirolimus-eluting stent (Orsiro; Biotronik AG, Bülach, Switzerland) was allowed. Operator was able to use OCT imaging before or after stent implantation, if clinically needed. Operator evaluated OCT findings during the procedure, and decided to use further adjuvant ballooning for stent optimization. Final OCT (post-procedural) was performed at the treated culprit before completing the procedure. Patients took aspirin and study drug as allocated without cross-over during the study period, and underwent 3-month
follow-up OCT.
Endpoints
Primary endpoint was the percentage of uncovered struts on 3-month OCT. Secondary endpoints were neointimal thickness and increased malapposition on 3-month OCT.
OCT imaging and analysis
OCT images were acquired by a frequency-domain OCT system (C7-XR™ OCT imaging system; LightLab Imaging Inc., St. Jude Medical, St. Paul, MN, USA). OCT images were recorded at 100 frames/s, while catheter was pulled back at 20 mm/s within stationary imaging sheath. Acquired imaging data were analyzed with certified offline software (QIvus; Medis Medical Imaging System, Leiden, the Netherlands) at a core laboratory (Cardiovascular Research Center, Seoul, Korea) by independent analysts who were blinded to patient and procedural information. Contiguous cross-sectional images were quantitatively measured in 1-mm intervals along the entire stented segment. Stent and luminal cross-sectional areas (CSAs) were measured. Neointimal CSA was calculated as stent CSA minus lumen CSA. An uncovered strut was defined as having a neointimal thickness of 0 µm.56 Neointimal thickness was measured as the distance between endoluminal surface of neointima and strut. A malapposed strut was defined as a strut that had detached from the vessel wall by ≥90 µm (110 µm for stents ≥3.5 mm in diameter).78 Malapposed stent was further classified into persistent, resolved, and late-acquired by matching the OCT images obtained at post-procedure and 3-month follow-up.6 To comprehensively evaluate vascular responses, we adopted the definition of healing score as the weighted index based on OCT findings related to stent characteristics; a high score reflected higher incidence of uncovered or malapposed struts.9
Quantitative coronary angiography analysis
Quantitative coronary angiography analysis was performed before and after PCI and at 3 months, using an offline computerized quantitative coronary angiographic system (CASS system; Pie Medical Instruments, Maastricht, the Netherlands) in an independent core laboratory (Cardiovascular Research Center, Seoul, Korea). Minimal lumen diameter and reference diameters of coronary lesions were measured in view with the narrowest lumen and the least amount of foreshortening, in comparison to the diameter of guidance catheter from diastolic frames in a single, matched view.
Statistical analysis
We assumed that the mean percentage of uncovered struts on 3-month OCT was 6.2% in the control group with AMI (standard deviation, 6.9%) based on our previous OCT study10, and hypothesized that the use of ticagrelor might achieve further improvement to 2% uncovered struts when compared with clopidogrel. We considered a total of 444 subjects to be sufficient to demonstrate the superior strut coverage of ticagrelor considering a 15% dropout rate (80% power at 5% significance level).
Categorical data were expressed as number (%), and analyzed with χ2 statistics or Fisher's exact test. Continuous variables were expressed as mean±standard deviation or median (interquartile range), and were compared using Student's t-test or Mann-Whitney test. Considering the clustered nature of data, a generalized linear mixed model was applied for strutlevel and cross-section-level analysis while comparing the two study drugs with a patient indicator (patient and cross-section for strut level; patient for cross-section level) as a random effect and the study drug as a fixed effect. To determine the predictors for uncovered struts, strut-level analysis was applied using each clinical, quantitative coronary angiography-derived, and OCT-derived variable as a fixed effect. For modeling with multiple fixed effects, all variables having fixed effect with a p-value of <0.10, and ticagrelor use were entered into the model. In backward elimination manner, we sequentially deleted one non-significant interaction with the largest p-value at a time to obtain a parsimonious final model. A generalized linear model was also used to determine the predictors of increased malapposition between post-procedure and 3-month follow-up. To assess the reproducibility of measuring uncovered and malapposed struts, 50 cross-sections (504 struts) were randomly chosen at follow-up OCT. Inter- and intra-observer variabilities in OCT measurements of distance and area were previously reported.11 All statistical analyses were performed with R Statistical Software (version 3.3.2; R Foundation for Statistical Computing, Vienna, Austria). P-value <0.05 was considered statistically significant.
RESULTS
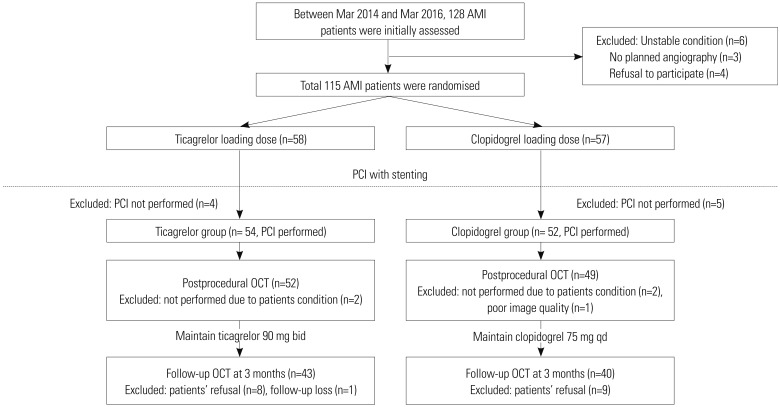
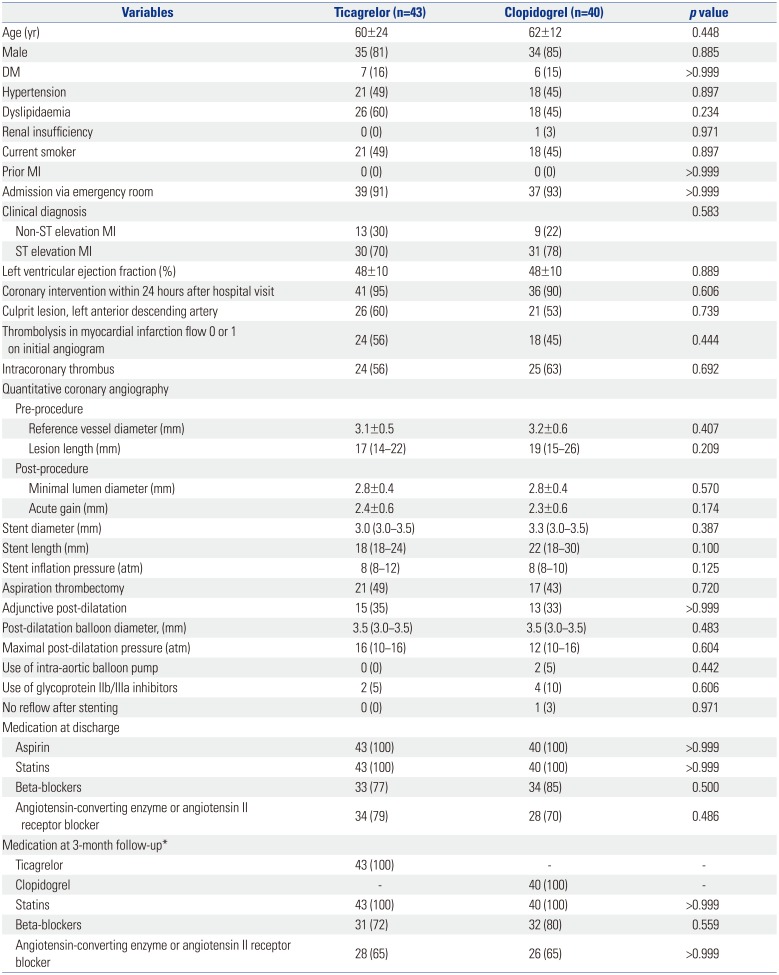
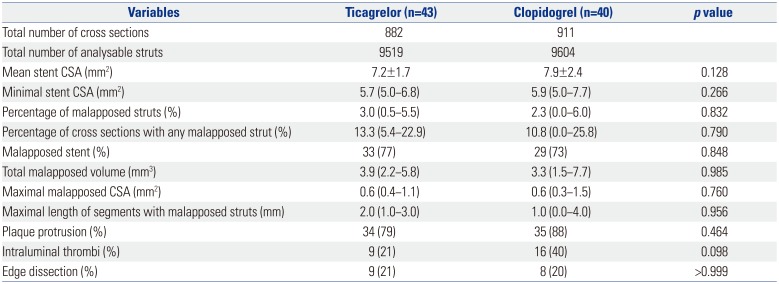
After a 2-year recruitment period, investigators and data safety monitoring board agreed to terminate the study before achieving target recruitment due to the following reasons: 1) slower patient enrollment than expected, 2) recently updated guidelines recommending the preferential use of ticagrelor in AMI patients, 3) evidence to ensure consistently favorable effects in Asian patients with ticagrelor12, and 4) overwhelming use of ticagrelor for AMI patients in Korea.13 Between March 2014 and March 2016, a total of 106 patients who met the study criteria underwent PCI. A detailed explanation of study flow is provided in Fig. 1. All lesions were treated with Orsiro stent as planned. Both groups were well-matched for clinical, angiographic, procedural characteristics (Table 1), and postprocedural OCT findings (Table 2).
Three-month follow-up OCT
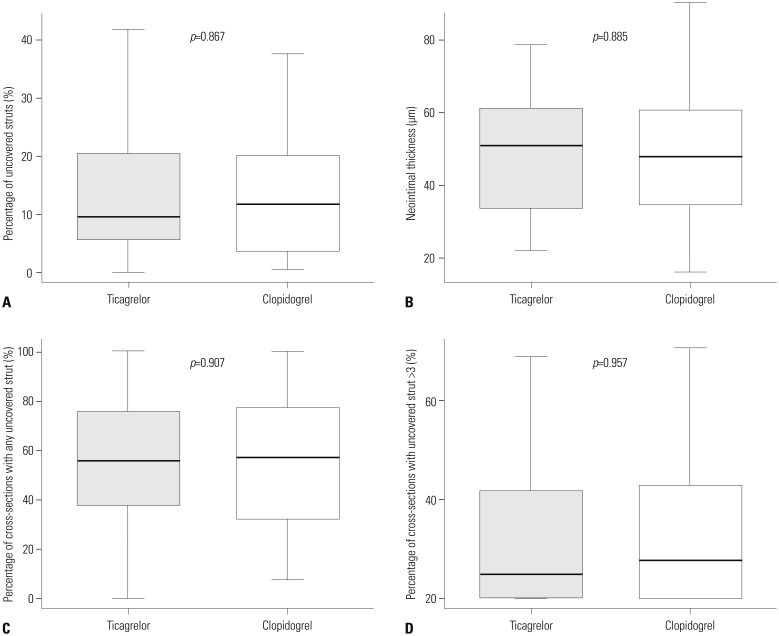
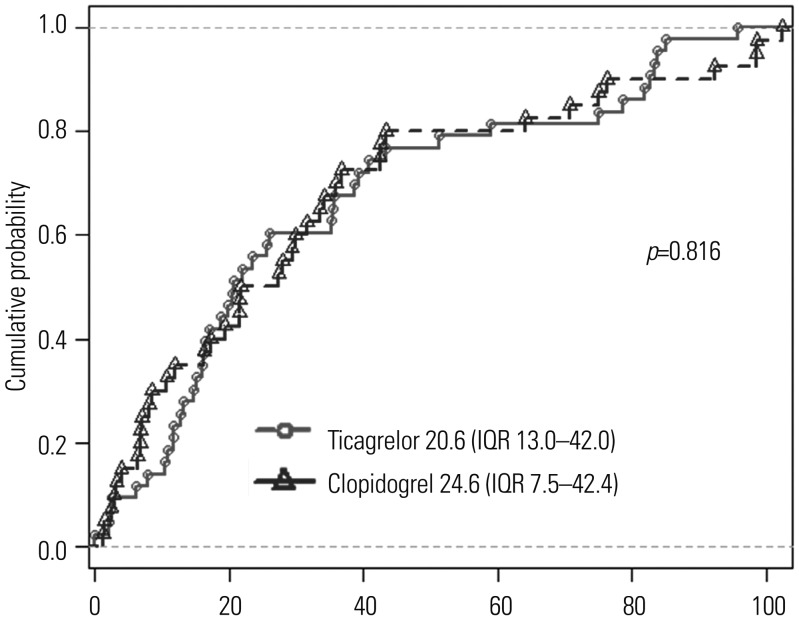
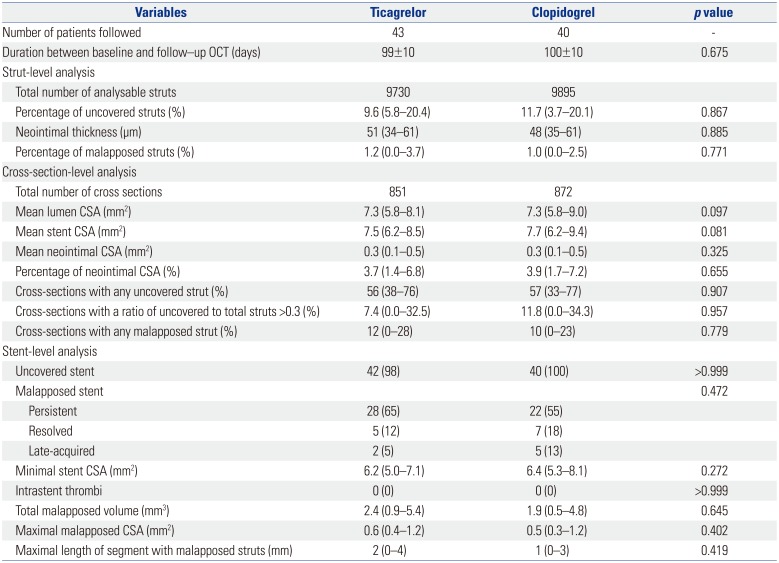
Difference in the percentages of uncovered struts between ticagrelor (9.6%) and clopidogrel groups (11.7%) did not reach statistical significance (p=0.867). There were no significant differences between groups in neointimal thickness, percentages of malapposed struts, or occurrence of late-acquired malapposition. Other levels of analyses showed no significant differences between groups (Table 3, Fig. 2). Furthermore, healing scores did not differ between the two groups (Fig. 3). Inter- and intra-observer variabilities were 0.970 and 0.990 for evaluation of uncovered struts, and 0.990 and 0.990 for malapposed struts, respectively.
Factors affecting 3-month strut coverage
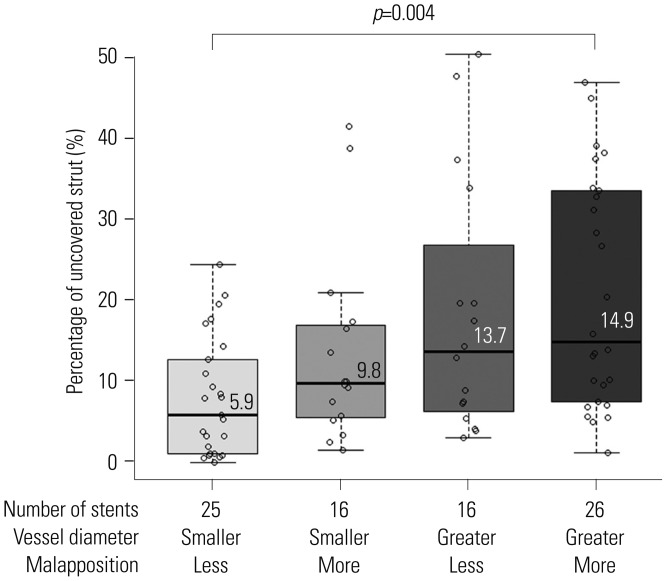
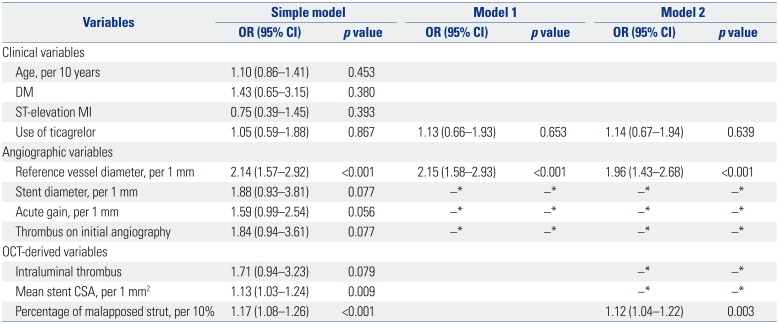
Including the use of ticagrelor and angiographic covariates as fixed effects into model 1, only reference vessel diameter was identified as a significant predictor of strut coverage. Further modeling with OCT-derived variables, model 2 determined the final independent predictors including reference vessel diameter [odds ratio (OR) 1.96, 95% confidence interval (CI) 1.43–2.68, p<0.001] and percentage of malapposed struts (OR 1.12, 95% CI 1.04–1.22, p=0.003) (Table 4). However, there were no significant clinical variables, including the use of ticagrelor, affecting strut coverage on 3-month OCT. Lesions were divided into four groups based on the median values of two significant predictors (reference vessel diameter, 3.02 mm; percentage of malapposed struts, 1.86%), and strut coverage was compared. Lesions with greater vessel diameter and more malapposition showed the highest rate of uncovered struts compared with other lesions (Fig. 4).
On serial OCT, percentage of malapposed struts was increased in 30 lesions (36%). Significant factors for increasing malapposition were total occlusion on initial angiogram (adjusted OR 3.21, 95% CI 1.21–8.98, p=0.021) and thrombus visualized on post-procedural OCT (adjusted OR 2.98, 95% CI 1.07–8.68, p=0.040). Percentage of uncovered struts in the lesions with increased malapposition was significantly higher than that in the lesions with reduced malapposition or nonmalapposition (median, 17.6% vs. 7.6%; p<0.001).
DISCUSSION
The current study was the first human trial comparing the effect of ticagrelor and clopidogrel on early strut coverage after DES implantation in patients with AMI. However, the present OCT study was terminated early (24% of planned participants enrolled), and underpowered to assess the superior effect of ticagrelor over clopidogrel on 3-month vascular healing in AMI patients; there were no significant differences in percentage of uncovered struts, neointimal thickness, or healing scores on 3-month OCT between groups.
Previous studies demonstrated beneficial effects of ticagrelor on vascular healing. Ticagrelor is known to increase the number of endothelial progenitor cells in patients with acute coronary syndrome.4 It may offer some benefit for the regeneration of endothelial cells, which modulate the reconstruction of neointima.14
In vivo study demonstrated a correlation between accelerated re-endothelialization and inhibition of neointimal formation after balloon injury.15 Ticagrelor was reported to inhibit deleterious neointimal growth after vascular injury in the mouse16 and rabbit carotid models.17 However, the effect of ticagrelor on early phase of vascular healing still requires further investigation.
OCT-defined strut coverage has been widely used as a surrogate indicator for vascular healing after stent implantation.1819 However, the process of vascular healing includes inflammation, cellular proliferation, and extracellular matrix deposition,20 which may not be differentiated with current OCT methods. Thin-layered fibrin or thrombus may be confused with neointimal coverage. Considering these limitations of OCT, the clinical implications of early strut coverage should be further investigated, and more advanced systems are needed. An upcoming OCT technology with greater resolution and various cell-tagging methods might help in understanding further processes of vascular healing after DES implantation.21
In our analyses, there were no significant clinical factors, including the use of ticagrelor, to predict strut coverage on 3-month OCT. Significant factors were vessel size and the degree of stent apposition on post-procedural OCT, suggesting that stent optimisation by improving apposition considering vessel size is more important for improving early strut coverage. As for lower strut coverage in larger vessels, various factors could be involved. First, under the setting of PCI for AMI, smaller diameter stents tend to be chosen and vigorous high-pressure post-dilation is hesitated, especially in large-vessel culprit lesions, owing to the risk of serious no-reflow after stenting. Also, it may be more difficult to determine the optimal stent size in large vessels due to the more dynamic variability of vessel diameter in the case of coronary artery occlusion or severe stenosis, spasm, or ectasia. Endothelial cells and another cellular milieu might also be involved.22 In smaller vessels, the increased contact surface area and higher resistance to blood flow may contribute to the interaction of circulating cells to promote migration and differentiation. However, in larger vessels, the opposite situation might hamper cellular responses, causing a worse strut coverage after stenting.
Our previous randomized trial demonstrated a significant correlation between the post-procedural percentage of malapposed struts and strut coverage at 3 months after DES implantation.6 In acute coronary syndrome, retained thrombus or strut penetration into necrotic core contributes to the occurrence of malapposition after stenting.23 The use of OCT may play a beneficial role in improving strut coverage or predicting the risk of uncovered or malapposed struts; however, further investigation is warranted to determine the association between strut coverage and procedural or clinical outcomes in the patients with AMI. Furthermore, our analysis showed that the percentage of uncovered struts was still high (up to 13%) in lesions, even without any risk factor determined. This may support the rationale for more potent antiplatelet therapy with ticagrelor to minimise stent thrombosis in patients with AMI.
Rate of uncovered struts in the present study was higher than our initial assumption, which was adopted from previous 3-month OCT follow-up study of non-MI patients.10 Possible reasons for the higher incidence of uncovered struts are as follows: 1) target population was definitely different from other OCT studies: diagnosis of patients enrolled in the present study was AMI, and 70% had ST-elevation AMI, expected to have worse coverage at early period; 2) most patients visited the emergency room and underwent urgent PCI, so clinical deterioration might inhibit healthy vascular healing; and 3) appropriate stent or balloon selection and complete apposition using full OCT assessment would be difficult in an emergency setting. Acute stent malapposition after PCI occurred in >70% patients in this study. As previously demonstrated, higher malapposition rate might aggravate strut coverage at 3-month OCT.6 Meanwhile, co-administered drugs such as statins and the use of new-generation DES might affect strut coverage. A future study, which assesses strut coverage according to different stent types, is required.
Importantly, our trial was terminated before full enrollment, in addition to being underpowered to identify a primary endpoint difference between two groups. Therefore, it may not be appropriate to refer to the present study to draw any definite conclusions regarding the effect of ticagrelor on the primary endpoint. Selection bias might have occurred, as there were only 106 patients who were included in the study despite the large inclusion and few exclusion criteria. Second, we did not evaluate the degree of platelet inhibition and plasma adenosine level in this study. The question of whether neointimal response is driven by P2Y12 inhibition or adenosine-like effects remains unanswered.24 Although strut coverage is known to be an important factor associated with clinical outcomes after stent implantation in pathologic and OCT studies, further study is needed to investigate the clinical implications of strut coverage at an early phase, and its roles in AMI.1925 Third, values used for power calculation were arbitrary. Although we predefined the 2% absolute difference of uncovered strut rate as the effect of ticagrelor, we still had insufficient evidence to demonstrate whether the treatment can reduce incidence of uncovered strut, and how much clinical significance is provided by the improvement of early neointimal healing. Finally, since 3-month OCT findings were assessed in this study for the evaluation of early neointimal responses in patients with AMI after stent implantation, a further extension beyond 3-month follow-up might be required.
In conclusion, we were not able to determine the favorable effect of ticagrelor on 3-month vascular healing after DES implantation, due to the early termination of the current OCT study. Vessel diameter and stent apposition were associated strut coverage in the present study. However, our findings were not conclusive, and should only be considered for generating hypothesis, due to the current study's premature termination and small number of study population. Adequately powered studies are needed to clarify the short- and long-term effects of ticagrelor on strut coverage, and to explain the mechanisms for improved clinical outcomes by ticagrelor use.
 XML Download