

 PDF
PDF ePub
ePub Citation
 Print
Print


INTRODUCTION
Articular cartilage contains a dense extracellular matrix (ECM) with highly specialized cells called chondrocytes [1]. The cartilage has a load-bearing function and provides mechanical stability to bones [2]. It contains a few chondrocytes with varying sizes and shapes according to the cartilage layer [1]. Chondrocytes modulate cartilage homeostasis by interacting with the extracellular environment that surrounds the matrix [2]. Degradation of the cartilage ECM is a major cause of articular destruction, which develops into rheumatoid arthritis, osteoarthritis, or septic arthritis. Chondrocytes respond to stimuli such as proinflammatory cytokines and mechanical load via cartilage-degrading enzymes and catabolic mediators [23]. Cartilage degradation is associated with increased expression of immunity mediators such as nitrogen oxide, interleukin-1 beta (IL-1β), and tumor necrosis factor alpha (TNF-α) [4]. The proinflammatory cytokines IL-1β and TNF-α are involved in the immune response in arthritis and cartilage degradation [2]. Inhibition of IL-1β and TNF-α signaling effectively reduces inflammation, cartilage degradation, and arthritis, although inhibiting the individual signaling pathways rarely protects the joint. There is a lack of studies on other signaling pathways mediating catabolism in the joint [56]. Several studies report that oncostatin M, fibronectin fragments, and retinoic acid induce chondrocyte-mediated catabolism, thereby reducing the aggrecan proteoglycan levels in cartilage [789].
Toll-like receptors (TLRs) have crucial functions in inflammatory diseases [101112] because they recognize pathogen-associated molecular patterns (PAMPs) and serve as the first line of defense against pathogen invasion [1314]. TLRs are major sensors of viral products and are expressed in dendritic cells and macrophages, both of which are sentinels of the immune system [1315]. A total of 13 TLRs have been identified in humans; TLR 1, 2, 4, 5, 6, and 11 are localized on the cell surface, whereas TLR 3, 7, 8, and 9 are localized inside the cell [16]. Human articular chondrocytes express several TLRs, including TLR-2 and TLR-4 [17]. All human TLRs are adaptor proteins, excluding MyD88 and TLR-3 [16]. TLR activation in chondrocytes increases the catabolic compartment, which induces matrix degradation [18]. TLR-2 and TLR-4 expression increases in the articular cartilage of people with osteoarthritis, and inflammatory mediators such as IL-1β and TNF-α induce increased expression of TLR-2 and TLR-4 in cultured chondrocytes [19].
Lipopolysaccharide (LPS) is a complex molecule containing a lipid moiety and a polysaccharide. LPS is an important constituent of Gram-negative bacteria and activates the congenital immune system [10]. LPS is used to induce cartilage matrix degradation and stimulate pyrogenic arthritis in in vitro experiments, and to stimulate cytokine production in chondrocytes [20]. In articular chondrocytes, LPS inhibits cellular proliferation and proteoglycan synthesis in a concentration-dependent manner, and stimulates proteoglycan degradation [2021]. TLR activation in articular chondrocytes increases matrix metalloproteinases (MMPs) [22]. A recent study suggested that TLRs mediate LPS signaling in target cells [23]. Although TLR-2 was reported to be involved in LPS signaling [24], the most essential receptor for LPS signaling is TLR-4 [25]. In arthritis mediated by the immune complex, TLR-4 modulates the early onset of immunity and cartilage destruction by increasing cytokine production and IL-10-mediated expression of Fc-gamma receptors [26]. TLR4–/– mice did not display LPS-induced chondrocyte activation and procatabolic response [14]. A previous proteomic study reported that TLR4-mediated activation of rat chondrocytes induced innate immune responses, which increased the production of long pentraxin-3, chitinase-3-like protein1, and osteoglycin [22]. However, TLR-4-mediated activation of time-dependent proteomic and genomic alterations in human chondrocytes has not been fully elucidated. In this study, both proteomic and genomic analyses were performed to elucidate the signaling mechanisms involved in TLR-4 activation in a human chondrocyte cell line.
METHODS
Chondrocyte cultures
Human chondrocyte cells CHON002, derived from a female patient (American Type Culture Collection, Manassas, VA, USA), were cultured in 100 mm dishes containing 10 ml of Dulbecco's modified Eagle's medium (DMEM; American Type Culture Collection, Manassas, VA, USA) supplemented with 10% fetal bovine serum (FBS; Premium Fetal Bovine Serum, Lonza, Basel, Switzerland) and 0.1 mg/ml G-418 sulfate (cell culture tested, Calbiochem, San Diego, USA). Cultures were incubated at 37℃ in humidified air with 5% CO2. When the chondrocyte cultures reached 80% confluence, the cells were washed with phosphate-buffered saline (PBS; Dulbecco's Phosphate-Buffered Saline, Invitrogen, Carlsbad, USA), treated with a Trypsin-Versene (EDTA) mixture (Lonza), and subcultured. The medium was routinely changed every 2 days. At passage 6, chondrocytes were cultured at 37℃ for 24 h in DMEM containing 1% FBS and 0.1 mg/ml G-418 sulfate, and stabilized. After a 24 h culture, chondrocytes were washed three times in PBS, and collected by centrifugation (1,000×g, 3 min) after each wash.
TLR-4 activation
The lipopolysaccharide (LPS) (L4391, Sigma, St. Louis, MO) was used for activation of TLR-4 in cultured chondrocytes. Twenty-four hours stabilized chondrocytes were treated with 1 µg/ml LPS and incubated for 12, 24, or 36 h. After each incubation period, the treated chondrocytes were harvested in the same way as the non-treated control group.
Two-dimensional gel electrophoresis and proteomics analysis
Proteomic analysis of chondrocytes was performed by two-dimensional gel electrophoresis (2DE) and matrix-assisted laser desorption/ionization-time of flight mass spectrometry (MALDI-TOF MS) analysis as described previously [27] (detailed methods are provided in the online Supplementary Materials). Protein expression levels were quantified using the digitized gel image analyzer PDQuest version 7.0 (Bio-Rad, Hercules, CA). Proteins that displayed >2-fold increases or decreases after LPS treatment (p<0.05), compared with matched control proteins, were selected for further analysis and identification. The search program MASCOT (http://www.matrixscience.com/cgi/search_form.pl?FORMVER=2&SEARCH=PMF) was used for protein identification by peptide mass fingerprinting. Spectra were calibrated with trypsin auto-digestion ion peak m/z (842.510, 2211.1046) as internal standards. The quality of protein identification was evaluated by Molecular Weight Search (MOWSE) score [28].
Microarray and genomics analysis
Genomic analysis of chondrocytes was performed using the Agilent Whole Human Genome Oligo Microarray (44K) as described previously (Agilent Technology, Santa Clara, CA, USA) [29] (detailed methods are provided in the online Supplementary Materials). The hybridized microarrays were scanned using the Agilent DNA Microarray Scanner, and then were quantified with Feature Extraction Software (Agilent Technology). All data normalization and selection of fold-changed genes were performed with GeneSpringGX v. 7.3 (Agilent Technology). The normalized ratio averages were calculated by dividing the average of normalized test channel intensity by the average of normalized control channel intensity. Functional annotation of genes was performed according to the Gene Ontology Consortium (http://www.geneontology.org/index.shtml) using GeneSpringGX v. 7.3 [2930].
Real-time PCR analysis
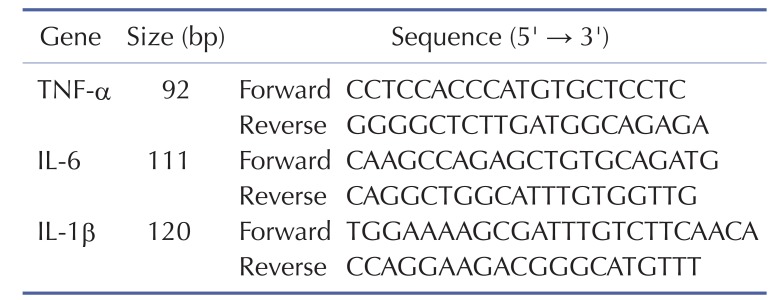
For real-time PCR analysis, 2 µg of total RNA were reverse-transcribed using TaqMan Reverse Transcription Reagent (ABI, Foster City, CA). Before reverse transcription, each sample of total RNAs was treated with 10U of DNase I. Each cDNA sample was additionally prepared in the absence of enzyme and used as a negative control to estimate the amount of contaminating DNA. From the final 20 µl reaction mix, 1 µl was used as a template in duplicate PCR reactions in a Prism 7900HT Sequence Detection System (ABI, Foster City, CA). Cycling conditions were as follows: 2 min at 50℃; 5 min at 95℃; and 35 cycles of 15 s at 95℃, 15 s at 55℃, and 20 s at 72℃. The GAPDH gene was used as a standard for each plate. The primers for each gene examined in our study are listed in Table 1. The relative quantity of each gene was calculated using data from standard curves, and all data were normalized with respect to that of GAPDH. to that of GAPDH.
Western blot analysis
The collected chondrocyte cells were sonicated in 1% NP-40 lysis buffer [150 mM NaCl, 20 mM Tris-HCl (pH 7.5), 1% glycerol, 1% Nonidet-P40, and 10% protease inhibitor] 10 times for 3 s each using a Sonoplus sonicator (Bandelin Electronic, Germany). The sonicated samples were centrifuged (16,000×g , 4℃, 30 min), and the supernatant was transferred to a new Eppendorf tube. Protein concentrations were measured using the 2-D Quant Kit (Amersham Biosciences, Little Chalfont, UK). Then, 15 µg of proteins were mixed with 1% NP-40 and 5× sample buffer and denatured at 98℃ for 5 min. The denatured proteins were loaded on a 7.5% SDS-polyacrylamide gel and separated by electrophoresis at 80 V for 30 min and 110 V for 90 min. Protein sizes were confirmed by comparison with the DokDo-MARK protein marker (EBM-1032, Elpis-Biotech, Daejeon, Korea). Separated proteins were transferred from the gel to a nitrocellulose membrane (Hybond-ECL, Amersham Biosciences, Little Chalfont, UK) at 25 V for 45 min. The membrane was blocked overnight in 5% non-fat milk at room temperature and then washed three times with TBS-T [10 mM Tris (pH 7.6), 3 mM NaCl, and 0.5% Tween 20] for 15 min. The blocked membrane was probed with antibodies to lamin A/C (Cell Signaling Technology, Beverly, MA, USA) or annexin 4/5/6 (Abcam, Cambridge, MA, USA), at 4℃ overnight, and then washed three times with TBS-T for 15 min. The membrane was incubated with HRP-conjugated Rabbit IgG (1:10,000 dilution, EnZo Life Sciences, Plymouth Meeting, PA, USA) at room temperature for 1 h, and then washed three times with TBS-T for 15 min. The resulting bands were visualized with SuperSignal West Pico Chemiluminescent Substrate (Thermo Fisher Scientific, Waltham, MA, USA) using the Las-3000 image reader (Fuji Film, Miyagi, Japan)[31].
Gene ontology analysis and functional annotation of proteins
We categorized and annotated identified proteins and genes using the Swiss-Prot and PANTHER (protein analysis through evolutionary relationships) databases to understand their molecular functions and biological processes. Protein-protein interactions between identified proteins and constructed protein networks were analyzed using the online STRING 8.3 database and Cytoscape software version 2.6.3. Gene ontology (GO) and functional enrichment analyses were performed using DAVID bioinformatics resources (https://david.ncifcrf.gov/) [32].
RESULTS
Changes in chondrocyte morphology during TLR-4 activation
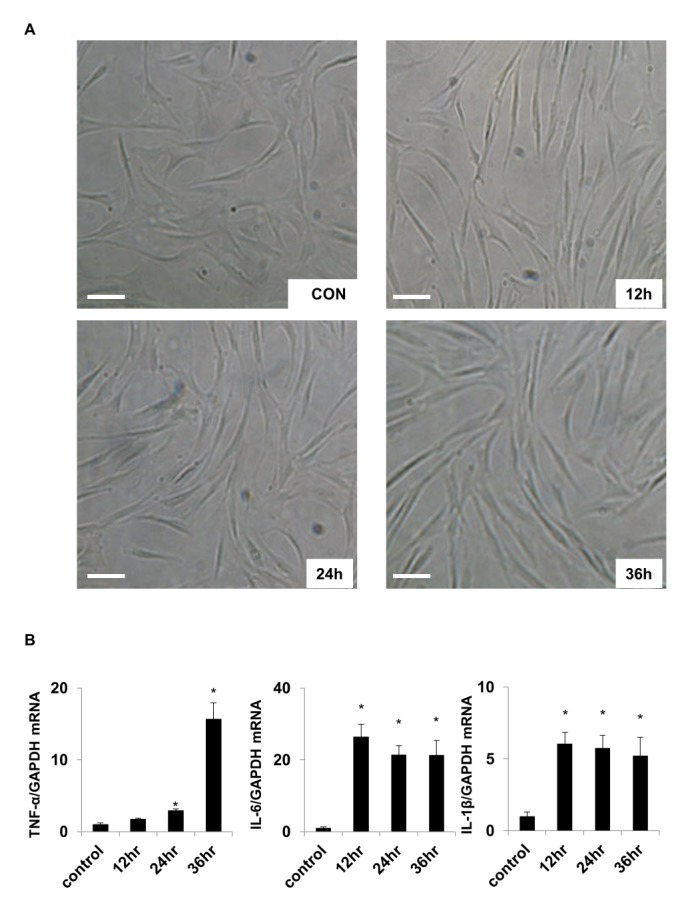
To examine the effect of TLR-4 activation on the external shape of chondrocytes, chondrocytes were treated with 1 µg/ml LPS for 12, 24, and 36 h. Treated cells were viewed under a microscope (×200). The cellular shapes of chondrocytes in control and experimental groups did not significantly differ (Fig. 1A).
Changes in cytokine expression in LPS-treated chondrocytes
Changes in cytokine expression in LPS-treated chondrocytes were investigated using real-time PCR analysis. The results indicated that the expression levels of TNF-α, IL-1β, and IL-6 were higher in the LPS-treated group than in the control group (Fig. 1B). The TNF-α level increased 15.65-fold after 36 h of LPS treatment compared with that of the control. The expression of IL-1β and IL-6 peaked after 12 h, and then slightly decreased over time. These results indicate that activation of the LPS ligand TLR-4 in chondrocytes led to increased expression of the inflammatory mediators TNF-α, IL-1β, and IL-6, which was followed by increased expression of TLR-4 and the consequent inflammatory response.
Proteomic profiling of LPS-activated chondrocytes
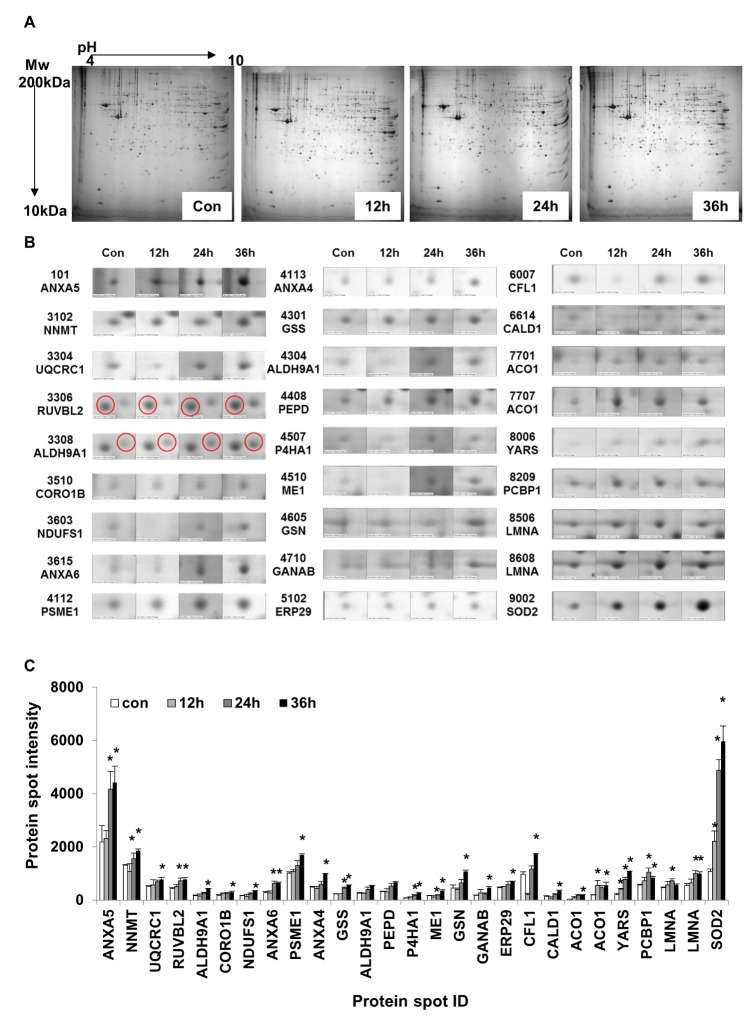
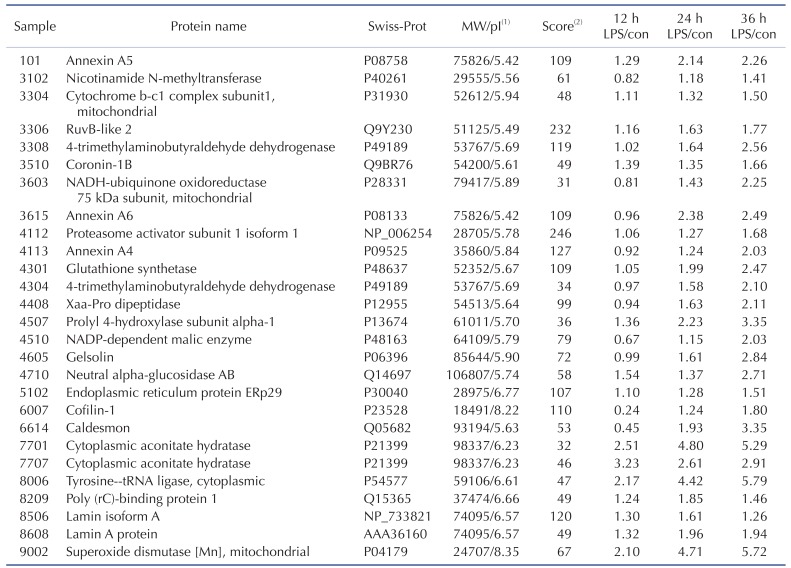
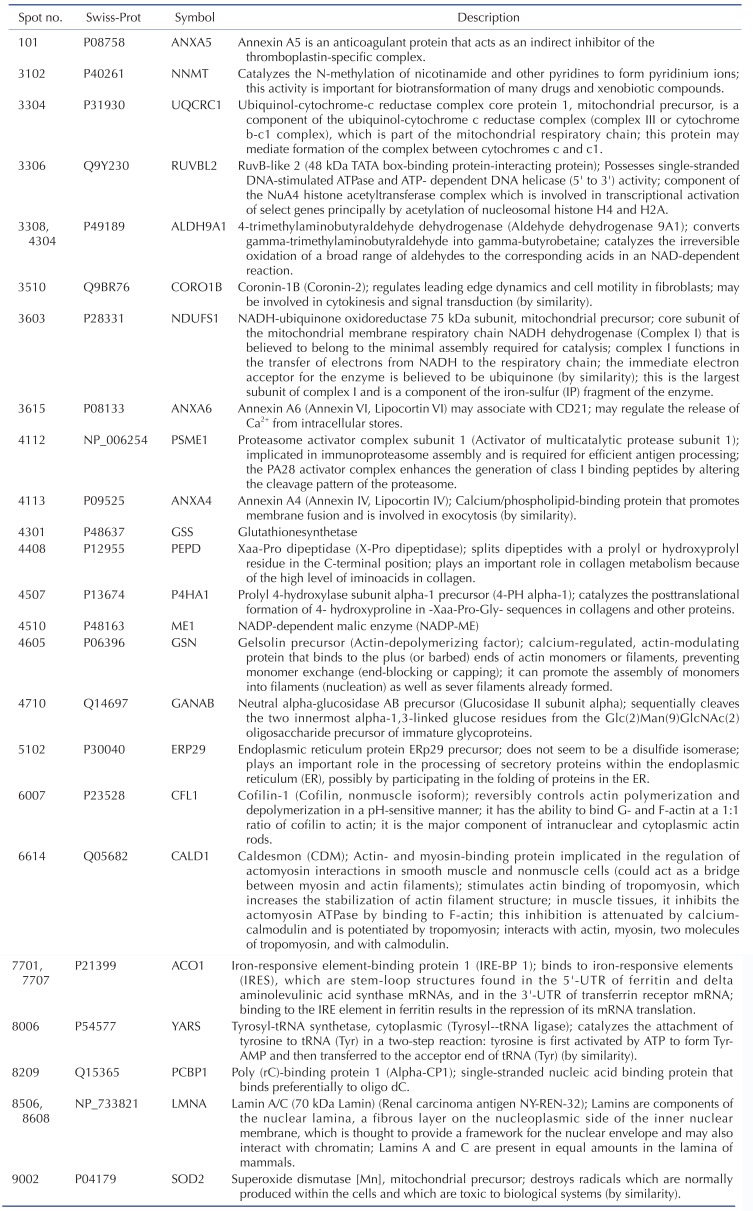
TLR-4 was activated by treating the chondrocytes with LPS for 12, 24, and 36 h. Then, 2DE was performed to examine changes in protein expression (Fig. 2A). The protein spots were separated using a pH gradient that ranged from 4 to 10 and a molecular weight (MW) gradient that ranged from 10 to 200 kDa. A total of 900 protein spots were observed (Supplementary Fig. 1). Of these, 27 protein spots (3%) displayed ≥1.5-times changes in expression levels at 12, 24, and 36 h. Of these 27 protein spots, seven changed after LPS treatment for 12 h (five increased and two decreased), 17 changed after 24 h treatment (17 increased), and 24 changed after 36 h treatment (24 increased) (Fig. 2B). These spots were cut from the gel and digested with trypsin. Then, the digested proteins were analyzed by performing MALDI-TOF MS. Of the 27 protein spots, A total of 26 proteins were identified using MS/MS data according to the degree of activated TLR-mediated expression and the time of LPS treatment (Table 2). We listed the protein information including, protein name, SWISS Prot ID, protein molecular weight (MW) and isoelectric point (pI), MOWSE score, and relative protein expression level of LPS treated chondrocyte/control chondrocyte group at different time points (12 h, 24 h and 36 h) in the Table 2. Changes in the protein expression levels were examined according to the protein identification results. Lamin A/C expression increased ≥1.5 times when chondrocytes were treated with LPS for 24 or 36 h. SOD-2 expression increased ≥2 times at 12 h of LPS treatment. Cofilin and Caldesmon expression decreased ≥1.5 times at 12 h of LPS treatment, but increased at 24 and 36 h (Fig. 2C).
Annotation of identified proteins and systemic analysis
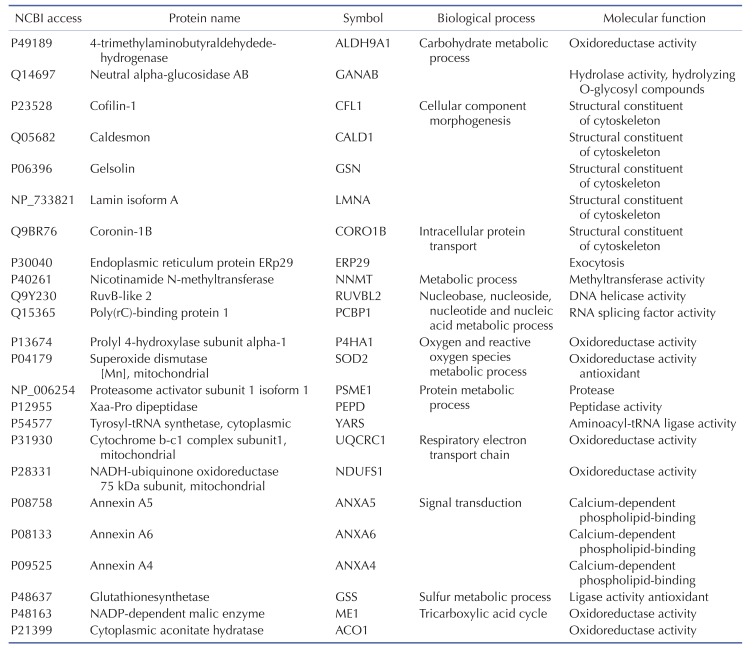
Several types of systemic analyses were used to identify the molecular functionality and biological process of the identified proteins and interactions between the proteins. First, detailed information on the identified proteins was obtained using the STRING 8.0 database (Table 3), and the degree of expression change was examined by process and function using the PANTHER Classification System (Supplementary Fig. 2 and Table 4). Table 4 shows the biological process and molecular function of each identified proteins. Briefly, activation of TLR-4 in chondrocytes changed the molecular functions in the following order: catalytic activity (47%), binding (33%), structural molecule activity (13%), and transcription regulator activity (7%) (Supplementary Fig. 2A). The biological processes of metabolic process (32%), cellular process (15%), and transport (9%) were most affected by TLR-4 activation in PANTHER classification algorithm (Supplementary Fig. 2B).
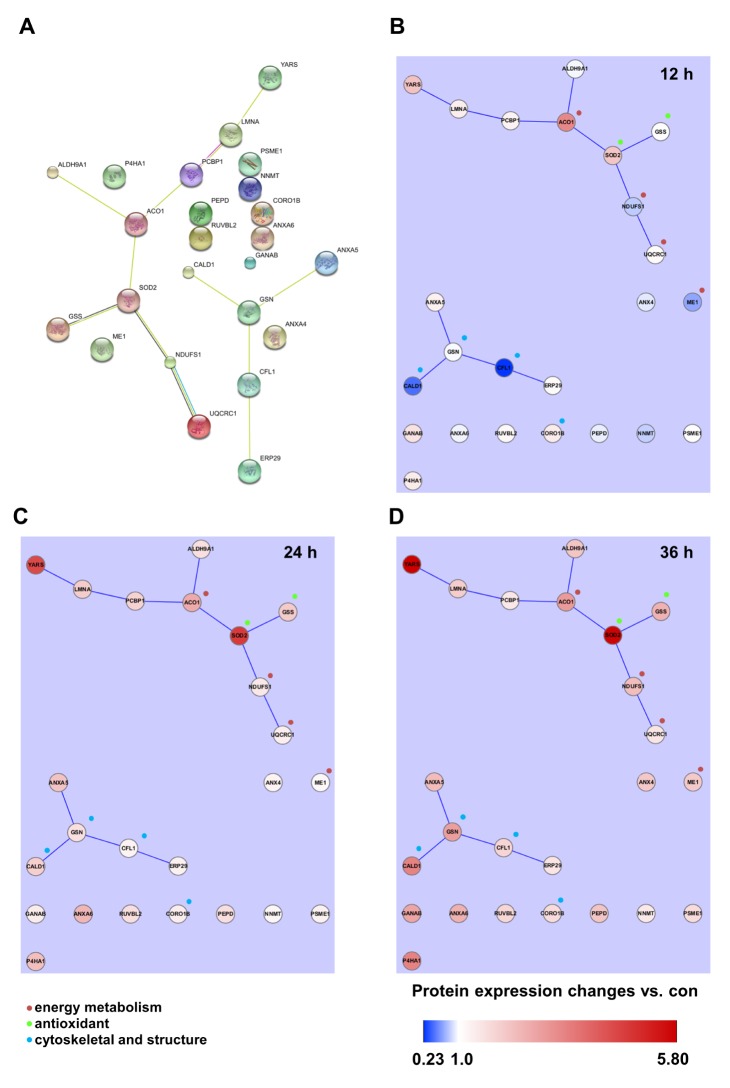
Table 4 shows the identified protein functions based on the Swiss-Prot database. Lamin A/C is a structural constituent of the cytoskeleton. The protein-protein interactions (PPI) of the identified proteins were analyzed as follows. First, the network map of the identified proteins was investigated using the STRING 8.3 analysis program (Fig. 3A). The network consisted of 24 proteins and 12 interactions, and the 12 interactions involved 14 (58.3%) of the total of 24 proteins. Upregulation or downregulation of protein expression was marked in the network map, and showed dynamic alterations in protein expression levels during LPS-induced inflammation in chondrocytes. The largest number of proteins changed expression after LPS treatment for 36 h. Then, the 36 h and 12 h treatment groups were compared and visualized on the network map using Cytoscape to identify changes in expression levels according to the LPS treatment time (Figs. 3B-D). When chondrocytes were treated with LPS for 12 h, the levels of NNMT, NDUFS1, ANXA6, ANXA4, ALDH9A1, PEPD, ME1, GSN, CFL1, and CALD1 decreased (Fig. 3B). When chondrocytes were treated with LPS for 24 and 36 h, the expression of all proteins clearly increased (Figs. 3C and D). When lamin A/C was viewed as the center of the network map, it formed a directly connected network with YARS and PCBP1. This network also included ACO1, ALDH9A1, SOD2, GSS, NDUFS1, and UQCRC1, which are involved in mitochondrial energy metabolism and antioxidant regulating proteins.
Genomic profiling of LPS-activated chondrocytes
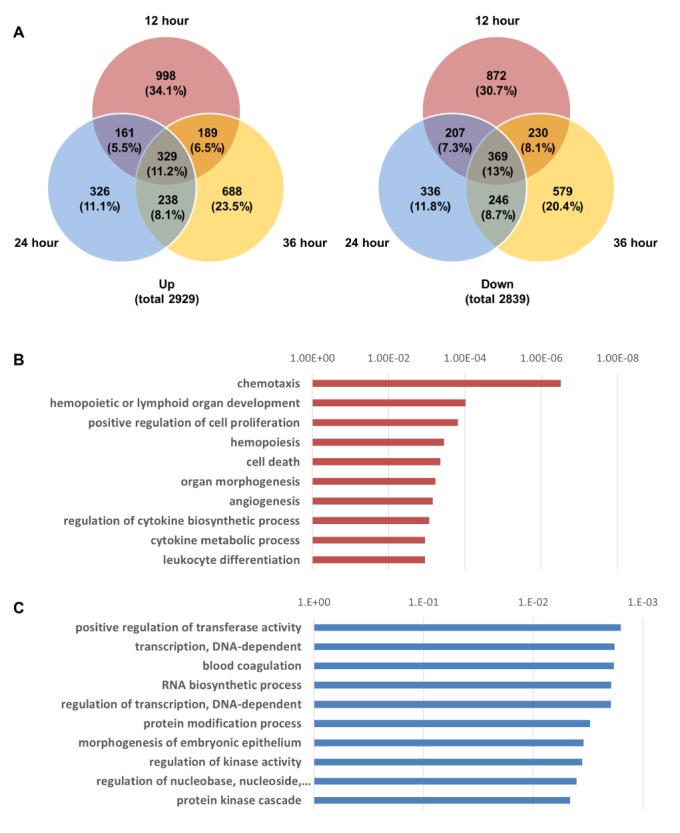
Total RNA was extracted from LPS-treated chondrocytes using the same conditions that were used for 2DE proteomic analysis. Then, cDNA was synthesized and changes in genomic expression profiles were analyzed using the Agilent Human Whole-Genome 44K DNA Chip Microarray (Supplementary Fig. 3). We compared the degree of gene expression of the LPS-treated groups that were classified according to their LPS treatment time for the activation of TLR-4 with that in the control group. A significance test was performed using a scatter plot. In the supplementary Fig. 3A, the red dots over the slope that is close to the longitudinal axis represent the genes that were found to have increased two fold or more when each LPS-treated group and the control group were compared, and the green dots under the slope that is close to the horizontal line represent the genes that were found to have decreased two fold or more when each of the LPS-treated groups and the control group were compared. A total of 2,929 genes increased more than two fold, and 2,839 genes decreased more than two fold in all groups. The degree of expression of the genes differed in the groups that were treated with LPS for different times (12, 24, and 36 h) (Fig. 4A). The gene expression changes were highest in 12 h (998 up-regulated, 872 down-regulated). The number of commonly altered genes in all time points was 329 (up-regulated) and 369 (down-regulated) (Fig. 4A).
The results of the clustering of these genes are shown in Supplementary Fig. 3B. The top 10 upregulated or downregulated biological pathways in chondrocytes, treated with LPS for 36 h, were analyzed using a gene function enrichment analysis tool (Figs. 4B and C). The following upregulated biological pathways were identified: chemotaxis, hemopoietic or lymphoid organ development, positive regulation of cell proliferation, hemopoiesis, cell death, organ morphogenesis, angiogenesis, regulation of cytokine biosynthetic process, cytokine metabolic process, and leukocyte differentiation (Fig. 4B). The following downregulated biological pathways were identified: positive regulation of transferase activity; transcription; DNA-dependent; blood coagulation; RNA biosynthetic process; regulation of transcription; protein modification process; morphogenesis of embryonic epithelium; regulation of kinase activity; regulation of nucleobase, nucleoside, nucleotide, and nucleic acid metabolic processes; and protein kinase cascade (Fig. 4C).
Differentially expressed genes in cytokine-cytokine receptor interaction
Because the cytokine-cytokine receptor interactions play key role in the inflammation responses, we analyzed the time-dependent mRNA expression alterations in cytokine-cytokine receptor interaction map of the KEGG pathway.
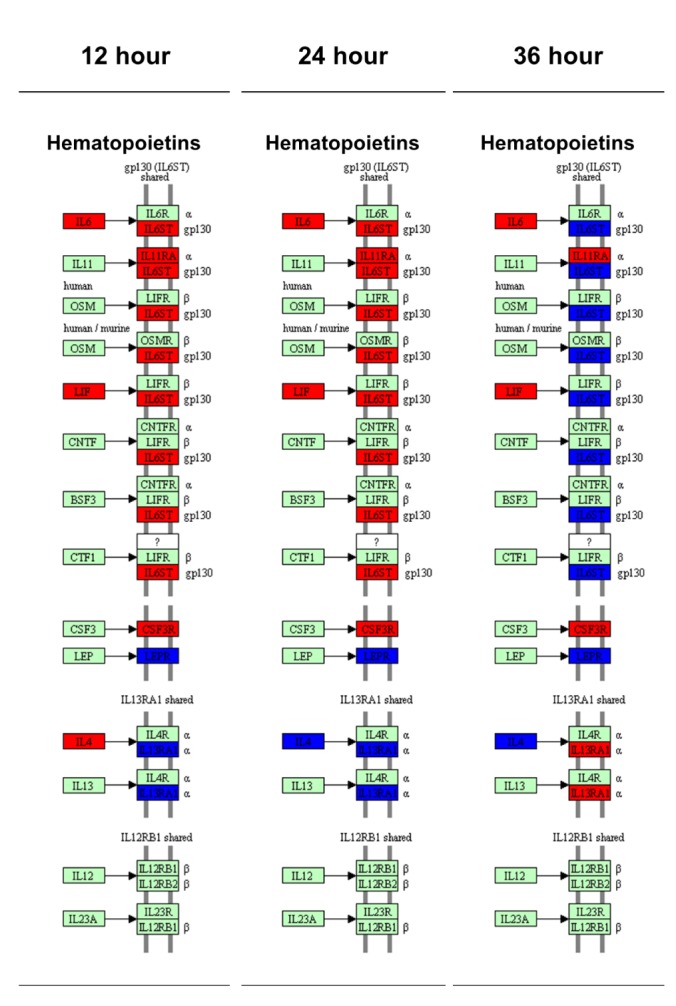
The cytokine-cytokine receptor interaction map was classified by the sub-family of each cytokines including chemokine, hematopoietins, PDGF family, TNF family and TGF-β family. The results showed that 41 genes increased and 16 decreased in the 12-h LPS-treated chondrocytes, (Supplementary Fig. 5); 41 genes increased and 16 decreased in the 24-h and 40 genes increased and 18 decreased in 36-h LPS-treated chondrocytes, (Supplementary Figs. 6 and 7). The gene expression patterns in chemokines, PDGF family, TNF family and TGF-β family were relatively constant at all time points, however the time dependent changes of mRNA level in hematopoietins and its receptor were remarkably altered at 36 h (Fig. 5). At 36 h, mRNA expression pattern of interleukin 6 signal transducer (IL6ST) and interleukin 13 receptor subunit alpha 1 (IL13RA1) was reversed from the previous time points. In detail, the IL6ST expression was decreased and IL13RA1 expression was increased than control group at 36 h (Fig. 5).
Comparison of proteomic and genomic results
We compared the results from 2DE proteomics and microarray genomics analyses, and identified nine pattern-matched proteins that displayed increased expression in both proteomics and genomics data (Supplementary Fig. 4). These nine proteins were NNMT, RUVBL2, ALDH9A1, ANXA6, PSME1, GSS, ACO1, LMNA, and SOD2.
Western blot confirmation of lamin A/C and annexin 4/5/6 expression
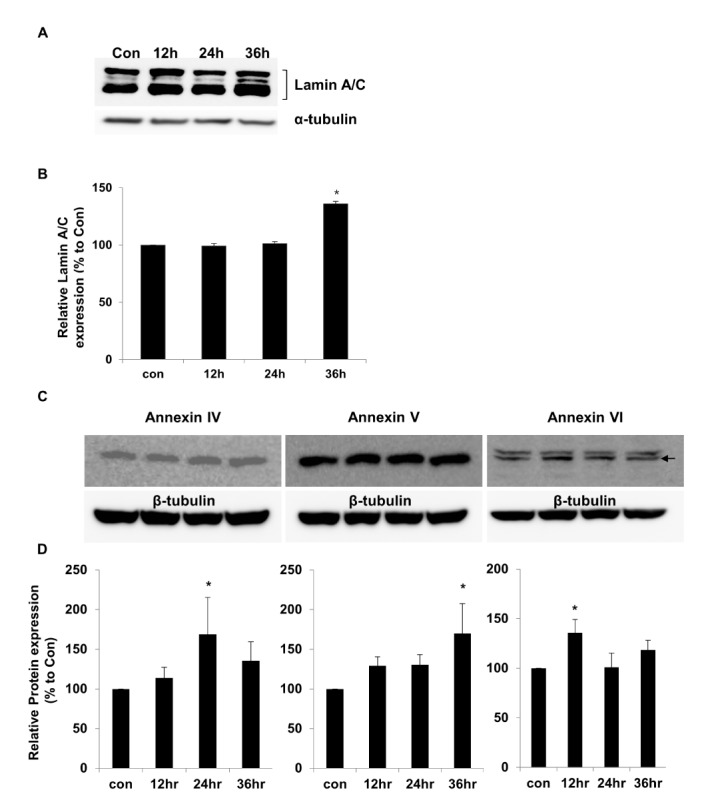
To confirm the proteomics and genomics results, the protein expression levels of lamin A/C and annexins were assessed in LPS-treated chondrocytes by performing western blot analysis. The results showed that lamin A/C expression was significantly higher (136±2.11%) after 36 h of LPS treatment than in controls (Fig. 6A). The relative lamin A/C expression levels are shown in Fig. 6B. The levels of annexin 4/5/6 expression also were investigated by performing western blot analysis (Fig. 6C). The relative expression levels of annexin 4/5/6 were significantly higher at 24, 36, and 12 h of LPS treatment, respectively (Fig. 6D). We used α-tubulin or β-tubulin as internal control standards for protein expression levels in control and TLR-4-activated chondrocytes.
DISCUSSION
LPS-mediated TLR-4 activation in chondrocytes
TLR has an important role in inducing immune and inflammatory responses [33]. LPS is commonly used to activate TLR-4. In this study, chondrocytes were treated with 1 µg/ml LPS to activate TLR-4, which consequently activated the NF-kB signaling pathway and induced the synthesis and secretion of proinflammatory mediators such as IL-1/6/8 and TNF-α [34]. TNF is one of several important executors of the LPS-induced cytotoxic response [35]; it is known to be produced by nuclear translocation of NF-kB [36].
Many in vivo and in vitro studies showed that IL-1 and TNF-α are major catabolic cytokines that destroy articular chondrocytes in rheumatoid arthritis [373839]. Other studies showed that the cytokines IL-1, IL-6, and TNF-α are produced during the early phase of the TLR-4-mediated response [22]. To examine cytokine expression in LPS-treated chondrocytes, we performed real-time PCR analysis of cDNA synthesized from total RNA extracted from LPS-treated and control chondrocytes. The results showed that IL-β, IL-6, and TNF-α levels increased in chondrocytes treated with LPS for 12, 24, and 36 h. TNF-α increased 15 times, suggesting that this activated the downstream NF-kB signaling pathway of TLR-4. These results indicate that LPS treatment activated TLR-4 and downstream inflammatory pathways in chondrocytes.
Proteomic alterations in LPS/TLR-4-activated chondrocytes
Proteomic analysis is a very effective method for comparing protein expression profiles in multiple target cells or tissues [4041]. Of the 11 TLRs in humans, TLR-4 is the most extensively studied receptor [42]. Kim et al. [19] showed that the expression of TLR-2 and TLR-4 strongly increased in the cartilage of patients with osteoarthritis. Activation of TLR-2 and TLR-4 ligands strongly induced catabolism in chondrocytes. We performed 2DE proteomics analysis to compare TLR-4-mediated changes in protein expression levels in LPS-treated chondrocytes with those in controls. These results enabled us to determine TLR-4-mediated changes in the protein expression profiles in LPS-treated chondrocytes and the functional classifications and networks of these proteins. These functions can be divided into 11 groups. Two major alterations in functional networks were observed in the time-dependent network analysis (Fig. 3, Table 4). In the protein-protein interaction network, one functional module primarily related to mitochondrial energy metabolism (UQCRC1, NDUFS1, ACO1, and ME1) and antioxidant regulation (SOD2 and GSS). The other functional module primarily related to cytoskeletal or structural proteins (GSN, CALD1, CORO1B, and CFL1). Inflammation is a cellular process that is highly energy dependent and mediated by oxidative stress [434445]. The cytoskeleton network, including coronin and cofilin-1, has an important role in inflammation and immune responses under both physiological and pathological conditions [464748]. A recent study suggested that mitochondrial energy metabolism and ROS generation are strongly related to LPS/TLR-4-induced Nlrp3 inflammasome activation [45]. Thus, the time-dependent increased expression of those proteins could activate the functional networks and lead to LPS/TLR-4-induced inflammation of chondrocytes in our model system. These results are consistent with those reported in a previous atherosclerosis model [49], which also observed a combination of energy metabolism and oxidative stress pathways in the proteomic response.
Genomic alterations in LPS/TLR-4-activated chondrocytes
We performed cDNA microarray analysis [5051] to determine the changes in gene expression profiles in LPS/TLR-4-activated chondrocytes. Previous microarray analyses have investigated gene expression in tissues of patients with rheumatoid arthritis and osteoarthritis [52]. However, these studies have not determined TLR-4-induced changes in gene expression profiles in cartilage cells during the development of arthritis. Therefore, we used microarrays to collect these data during time-course experiments in LPS-treated chondrocytes. Unlike the observed changes at the protein level, which were mainly altered at 36 h, gene expression profiles changed most significantly when TLR-4 was activated with LPS for 12 h. At 12 h, 1,677 or 1740 genes underwent ≥2-fold increases or decreases, respectively. Among those genes, 998 (34.1%) of total up-regulated genes and 872 (30.7%) of total down-regulated genes were exclusively altered at 12 h (Fig. 4A).
Gene ontology analysis clearly showed the activation of essential pathways involved in inflammation, including chemotaxis, hematopoiesis, regulation of cytokine biosynthetic process, and cytokine metabolic process (Fig. 4B). Representative highly expressed genes responding to LPS/TLR-4-induced activation include the following: G-protein coupled receptor 111 (average 66-fold greater than control); Interleukin 8 (58-fold increase); serum amyloid A1 (33-fold increase); chemokines CXCL1, CXCL2, and CXCL3 (21-fold, 14-fold, and 10-fold increase, respectively); Claudin 1 (19-fold increase); 2',5'-oligoadenylae synthetase (13-fold increase); Progastricsin (12-fold increase); Interferon-inducible protein p78 (10-fold increase); and superoxide dismutase 2 (9-fold increase). Of the 2,839 genes that displayed reduced expression, 245 (4.70%) were involved in the GO pathway for the modulation of nucleobase, nucleoside, nucleotide, and nucleic acids (Fig. 4C). These genomic data provide valuable information about chondrocyte genes and cellular mechanisms targeted by TLR4 activation during the development of chondrocyte-mediated arthritis.
Cytokine plays an important role in immunity, infection, the hematogenous function, tissue repair, and the development and growth of cells. It particularly plays a major role in the immune system. Most of the immunologic functions involve more than one type of cytokine. LPS, a substance that induces bacterial inflammation, stimulates immunocytes via TLR-4. The activated immunocytes secrete various types of inflammation-inducing cytokines, and induce apoptosis and cell death. Cytokines can be divided into various families according to their structure or binding receptors.
To understand the inflammatory response that was induced in the chondrocytes, 62 genes that are involved in the cytokine-cytokine receptor interaction in the KEGG pathway were selected, and the change in the expression of such genes was examined on the KEGG pathway map. Unlike the relatively constant gene expression patterns in chemokines, PDGF family, TNF family and TGF-β family, mRNA level of cytokine receptors in hematopoietins were remarkably altered at 36 h. (Fig. 5). The mRNA expression of IL6ST was keep increased until 24 h but decreased at 36 h. In contrast, the expression of IL13RA1 was repressed until 24 h but increased at 35 h. IL6ST and IL13RA1 play important role in downstream activation of interleukins signaling pathways [5354]. IL6ST is an important signal transducer which can be shared by interleukin 6 and 11 (IL6, 11), ciliary neurotrophic factor (CNTF), leukemia inhibitory factor (LIF), B-cell stimulating factor 3 (BSF3) and oncostatin M (OSM) [53]. IL13RA1 forms a receptor complex with IL4 receptor, which mediates the signaling processes of JAK1, STAT3 and STAT5 activation [54]. Interestingly, the gene expressions of major receptors (IL6R, LIFR, CNTFR, IL4R and OSMR) for those cytokines were comparable to control group all the time, however the expression of IL6ST and IL13RA1 had been altered dynamically (Fig. 5) which suggest the important regulatory role of these genes. These results suggested the existence of IL mediated temporal regulatory mechanism in the TLR-4 induced chondrocyte inflammation.
Lamin and annexin function in chondrocyte inflammation
Lamin A/C
Among the nine proteins with proteomic and genomic pattern matching, we performed western blot analysis to confirm increased expression of lamin A/C and annexin 4/5/6 in LPS-treated chondrocytes. Lamin A/C is a constituent of the cytoskeleton and is a type A lamin (there are two types of lamins, type A and type B) [555657]. Lamin A/C maintains nuclear integrity and participates in nuclear membrane reformation after somatic cell division [5859]. Helfand et al. reported that lamin is a type V intermediate fiber that is responsible for cellular shape and structure, and it localizes in the nucleus [60]. Helfand et al. also reported that lamin A/C localizes in the bone matrix, and lamin A/C expression declines as chondrocyte cells age in mice [5660]. Our 2DE results indicate that lamin A/C expression increased in TLR-4-actived chondrocytes after LPS treatment for 24 or 36 h (Fig. 2). The increase in lamin A/C levels after LPS treatment for 36 h was confirmed with western blots (Fig. 6).
A 2DE proteomic study of chondrocytes from patients with osteoarthritis also reported increased expression of lamin A (type A) compared with control chondrocytes [61]. Several studies reported that lamin A/C affects chromatin organization, DNA replication, transcriptional regulation, and signal transduction [6263]. Lamin proteolysis was observed in apoptotic cells [64]. The cellular changes that occur during apoptosis are due to cleavage of cellular proteins such as lamin A/C and Poly (ADP-ribose) polymerase (PARP) [656667]. When apoptosis is induced, lamin A/C is cut into small fragments of 29 kDa [68]. Mutations in the lamin A (LmnA) gene are related to diseases such as cardiomyopathy, lipodystrophy, and segmental premature aging syndrome [63]. A recent study suggested the important role of lamin A in aging and inflammation [6970]. Mutation of LmnA increased the transcript levels of inflammatory markers in arteries, liver, and skin of mouse Hutchinson-Gilford progeria syndrome models, which suggested that changes in gene expression and gene mutation-induced posttranslational modification of lamin A are important in aging and inflammation [6970]. Our results suggest that lamin A/C is involved in TLR-4 induced inflammation and chondrocyte cell death, which leads to the development and progression of arthritis. Future studies should analyze posttranscriptional modifications and perform functional validation of increased levels of lamin A/C during TLR-4 activation to clarify the role of lamin A/C in chondrocyte inflammation.
Annexins
Annexins are a family of membrane-binding proteins that share structural properties and biological activities associated with membrane-related processes. Members of the annexin family bind to negatively charged phospholipids in the presence of Ca2+, and regulate important biological functions including vesicle trafficking, cell division, apoptosis, and growth regulation [71]. Changes in annexin expression and localization are implicated in diseases such as cancer, diabetes, and immune dysfunction [7273]. Terminally differentiated hypertrophic chondrocytes release matrix vesicles containing annexins to the surrounding extracellular matrix; these annexins can initiate Ca2+ influx into matrix vesicles, thereby causing cartilage mineralization [74]. These results indicate that annexins have a fundamental role in bone and cartilage biology.
Annexin A1 is an anti-inflammatory protein that inhibits iNOS expression, cytochrome oxidase-2 activity, and cytokine-induced activation of phospholipase A2 (PLA2) [75]. Silencing of constitutively expressed annexin 1 significantly increases TNF-α and IL-6 production [76]. However, the present proteomic and genomic analyses did not detect changes in annexin A1 expression. Annexin 4 is a calcium/phospholipid-binding protein that promotes membrane fusion; it is involved in exocytosis and inhibits PLA2 [7778]. Annexin 4 overexpression was reported in renal cell carcinoma and is related to anti-cancer drug resistance [72]. The relationship between annexin 4 and chondrocyte inflammation remains to be elucidated. Annexin 5 is an anticoagulant protein that acts as an indirect inhibitor of thromboplastin-specific complex and PLA2 [7279]. Previous studies suggested an important roles for annexin 5 in the inflammation of tissues such as the heart, vascular endothelial cells, and lung, and in systemic sepsis [8081828384]. Modifications in annexin 5 expression have been implicated in cardiovascular diseases [85], cancers [72], osteoarthritis [86], and rheumatoid arthritis [87]. Annexin 5 has important roles in chondrocyte adhesion, differentiation, and apoptosis [88899091]. Annexin 6, another calcium/phospholipid-binding protein, has been implicated in endosome aggregation and vesicle fusion; it is reported as a late differentiation marker for osteoarthritic chondrocytes [92]. Double deficiency of annexin 5 and 6 changes the transcriptome in growth plate cartilage, but does not induce any bone abnormality in the double-knockout mouse model [74]. These combined results suggest that increases in annexin 5 and 6 expression are important indicators of chondrocyte inflammation and osteoarthritis.
Although, there are independent studies demonstrated the increase or activation of TLR-4 [93], annexin 2, 5 and 6 [9294] or lamin A/C [58] under the osteoarthritic conditions separately. However no study demonstrated expressional alteration of those components at same spatial and temporal condition yet. In the best of our knowledge, this is the first study demonstrated the increased expression of those annexins and lamin A/C under the TLR-4 activation condition. However further studies are needed to elucidate the underlying mechanism of between TLR-4 activation and increases of those key proteins.
CONCLUSION
In this study, we collected data on proteins and genes that showed distinct differences in LPS-treated chondrocytes and were closely related to the TLR-4-mediated inflammatory response leading to arthritis. These data demonstrate that the use of -omics analyses enable greater understanding of the molecular mechanisms involved in TLR-4-mediated chondrocyte inflammation and osteoarthritis.


 XML Download