

 PDF
PDF ePub
ePub Citation
 Print
Print


INTRODUCTION
Classically, a gutta-percha (GP) cone with sealer is used for canal obturation. GP cones are available in standardized and non-standardized sizes. Currently, manufacturers offer corresponding GP cones that match the taper and diameter of the instruments. Previous studies demonstrated that such taper-matched GP points obturate the canal effectively when a single cone technique is used [12].
Three-dimensional obturation of the radicular space is essential for long-term success [3]. Regardless of the obturation technique used, it is important to select a master cone that is well adapted to the canal for a fluid-tight apical seal [4]. Previous studies reported that root canal obturation with a matched-taper single cone provided a better apical seal as compared to other master cones [25].
Adaptation of the master cones is assessed by visual, tactile, and radiographic methods. When fitting a cone, a clinician confirms that the GP cone is inserted to the established working length (WL) with a tug-back. Radiographs could be additionally used to confirm the fit of the master cone.
Tug-back is defined as a slight frictional resistance of a master point to withdrawal, which indicates a relative degree of adaptation at least in 2 dimensions, according to the American Association of Endodontists [6]. Tug-back has also been described as a slight resistance to pull [7], a tactile sensation of apical snugness [8], and a slight back-pull or resistance to dislodgement of the GP master cone that is felt when it is removed from the canal [9].
The influence of master cone adaptation on apical sealing has been investigated by several studies [910]. However, no attempts have been made to quantitatively compare the subjective tug-back sensation to the fitness of the master cone. The objective of this study was to examine the correlation between the degree of tug-back and apical cone adaptation. We developed a protocol to quantify the subjective tug-back by measuring the pulling force with a spring balance. We compared tactile tug-back scores, pulling force, and percentage of the gutta-percha occupied area (pGPOA) by micro-computed tomography (µCT) imaging in conjunction with a master GP cone of different taper.
MATERIALS AND METHODS
Extracted human single-rooted teeth were collected following informed consent approved by the Wonkwang University Daejeon Dental Hospital Institutional Review Board (W1601/0011). Twenty-eight human single-rooted teeth with a single straight canal (curvature < 5°) including maxillary incisors, mandibular incisors, maxillary premolars, and mandibular premolars were used in this study [11]. A preoperative periapical radiographic view was obtained, based on which teeth with previous root canal treatment, extensive root caries, calcification, internal resorption, severe curvature, and open apex were excluded from the study. Additionally, teeth with a similar apical foramen size were selected, whereas teeth with an initial apical size larger than size 20 K-file (Mani Inc., Tochigi, Japan) were excluded. All teeth were embedded in acrylic resin blocks (20 × 20 × 15 mm) to ease manipulation. Root length was standardized at 15 mm by decoronation. This flat surface provided a reference point and allowed straight-line access.
Specimen preparation
After access to the pulp chamber was obtained, a size 10 K-file was inserted into the canal until its tip was visible at the apical foramen. The WL was determined by subtracting 1 mm from this length. The glide path was established with a size 15 K-file, and ProTaper SX file (Dentsply Maillefer, Ballaigues, Switzerland) was used for coronal flaring.
Teeth were randomly divided into 2 experimental groups (n = 14) based on the rotary nickel-titanium (NiTi) file systems: ProTaper Next (PTN; Dentsply Maillefer) and ProFile (PF; Dentsply Maillefer). All canals were prepared by reaching an apical canal size of 30.
Canal preparation was performed using the Smart X plus (Dentsply Maillefer) engine according to the manufacturer's recommendation. Files were discarded after a single-use. A 2% sodium hypochlorite solution (NaOCl; Duksan Pure Chemicals, Ansan, Korea) was used for irrigation, and apical patency was maintained during the experimental procedure. All procedures were performed by one endodontist with extensive experience of using NiTi rotary files.
1. PTN group
A PTN instrument was used to the full length of the canals. The instrumentation sequence was X1, X2, and X3. The files were used with a brushing motion at a rotational speed of 300 rpm and 200 gcm torque. A PTN X3 GP point (Dentsply Maillefer) was used as master cone.
2. PF group
The instrumentation sequence was sizes 25/0.06, 30/0.04, and 30/0.06. The files were used with in-and-out motion at a rotational speed of 300 rpm and 200 gcm torque. All canals were enlarged to size 30/0.06 to WL. A size 30/0.06 GP cone (Diadent ML.029, Diadent Group International Inc., Cheongju, Korea) was used as master cone.
Evaluation of tug-back
After canal preparation, each canal was irrigated with 2 mL of 17% ethylenediaminetetraacetic acid solution (InterMed Inc./Vista Dental Products, Racine, WI, USA) for one minute as a final rinse and then dried with paper points. Then, the master cone was inserted to the WL to evaluate the adaptation of the GP cones. Radiographs were taken additionally to confirm the apical fitness. By making mark on the cone, the master cone was placed in the same position.
1. Subjective assessment of tug-back scoring (tactile test)
Two endodontists evaluated tug-back of the master cone for each specimen. The degree of tug-back was scored as follows: 1) none, the cone was loose at the WL; 2) slight tug-back, the cone could be removed with very small resistance; 3) strong tug-back, there was a need for a considerable force to remove the cone. An inter-examiner reliability analysis using the kappa coefficient was performed, and disagreement was dealt with by discussion.
2. Objective assessment of pulling force
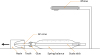
A unique test was developed to assess tug-back using a spring balance (NaRiKa Spring Balances SO-2N, NaRiKa, Tokyo, Japan), which has a 0.02 N minimal value (Figure 1). The master cones were attached to the end of the spring balance via a fast-setting glue (quick setting cyanoacrylate gel). The test path was guided by 2 parallel walls, 20 mm in width, to ensure the pulling direction coincided with the spring balance axis and the long axis of the tooth. The balance value was recorded while pulling the tooth specimen by slow motion video at a rate of 240 frames per second (iPhone 6, Apple Inc., Cupertino, CA, USA). The video was then re-played to determine the maximum value of each specimen. The peak value of the spring balance when pulling the master cone from the specimen was achieved when the specimen started to slide. For each tooth, each measurement was repeated 3 times, and the means were calculated. To assure repeatability of this method, measurements were repeated by same operator after 3 weeks. Spearman's coefficient was calculated.
µCT analysis
The specimens were subjected to tomographic analysis using a µCT scanner (SkyScan 1174, SkyScan bvba, Aartselaar, Belgium) with a voltage of 60 kV and a current of 167 µA with a 0.5 mm aluminum filter. The master cone was fixed to the specimen with sticky wax during scanning.
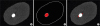
Sectional images of axial views were obtained for assessment. Apical 1, 2, and 3 mm of the apex were the regions of interest. ImageJ software (National Institutes of Health, Bethesda, MD, USA) was used to calculate the pGPOA from cross-sectional images. By image processing called thresholding, pixels of the gutta-percha occupied area (GPOA) and void were classified (Figure 2). The pGPOA was calculated by dividing the pixels of the GPOA by the sum of pixels of the GPOA and void area from all 3 levels.
Statistical analysis
Data were analyzed statistically with SPSS Statistics 18.0 software (IBM, Chicago, IL, USA). Because the data were normally distributed (Kolmogorov-Smirnov test), parametric methods were used. Potential correlation between tug-back scores, pulling force, and pGPOA was analyzed using Pearson's correlation analysis. The t-test and χ2 test were used to compare tug-back, pulling force, and pGPOA between the groups. The pulling force and pGPOA were compared with the scores of tug-back by using one-way analysis of variance (ANOVA) and Tukey's test. The significance level was set at p < 0.05.
RESULTS
One specimen in the PTN group and one specimen in the PF group lacked true tug-back and were scored 1 (none). In the PTN group, 8 specimens had slight tug-back (score 2) and 5 specimens had strong tug-back (score 3). In contrast, there were 5 specimens with a slight tug-back and 8 specimens with a strong tug-back in the PF group. The inter-examiner reliability for the tug-back scoring was represented by a kappa coefficient of 0.759, which indicates good agreement [12].
The pulling force measured by a spring balance when removing the GP cone ranged from 0.15 to 1.70 N. The repeatability of pulling force was represented by Spearman's coefficient, (0.877, p < 0.01), indicating high repeatability. There was a positive correlation between tug-back score, pulling force, and pGPOA (Table 1). However, there was no significant difference in tug-back scores, pulling force, and pGPOA by t-test between the PTN and PF groups (p = 0.577, p = 0.064, and p = 0.546, respectively). The mean values of tug-back score, pulling force (N), and pGPOA (%) of the groups are shown in Table 2.
Table 1
Pearson's coefficient between tug-back score, pulling force, and pGPOA

| Measurement | Tug-back score | Pulling force | pGPOA |
|---|---|---|---|
| Tug-back score | - | - | - |
| Pulling force | 0.812a | - | - |
| pGPOA | 0.723a | 0.535a | - |
Table 2
Tug-back score, pulling force (N), and pGPOA (%) of each group

| Measurement | Group (n = 14) | p value | |
|---|---|---|---|
| PTN | PF | ||
| Tug-back score | 2.29 ± 0.61 | 2.50 ± 0.65 | 0.577 |
| Pulling force (N) | 0.72 ± 0.32 | 1.03 ± 0.47 | 0.064 |
| pGPOA (%) | 84.37 ± 7.92 | 82.57 ± 9.02 | 0.546 |
Without a distinction between groups, the pGPOA and pulling force according to tug-back scores were significantly different (Table 3). Specimens with strong tug-back (score 3) had a significantly higher pulling force compared with specimens with a score of 1 or 2. In addition, pGPOA showed a significant difference among scores of 1, 2, and 3. The higher tug-back scores had a larger pGPOA (p < 0.000).

DISCUSSION
Tug-back of the master cone is recommended to provide an apical seal [13]. The master cone should fit within 3 mm from the end of the canal [9]. Inconsistent conclusions regarding the effect of tug-back have been reported. One study [10] found that the presence or absence of tug-back had no effect on the apical seal. In another study [9], tug-back was effective for enhancing the apical seal. However, this effect was not quantified, and the clinical significance of tug-back correlated with apical sealing ability has not been investigated.
Tug-back is a slight resistance to pull of the GP master cone when it is removed from the canal. However, it is a subjective tactile indicator that cannot be quantitatively measured. The measurement of subjective variables is a great challenge. This study is the first to attempt to quantify tug-back using a spring balance. Specimens with a strong tug-back had a mean pulling force of 1.24 N. The pulling force ranged from 0.15–0.41 N for no tug-back, 0.39–1.10 N for slight tug-back, and 0.75–1.70 N for strong tug-back. The pulling force had a significant correlation with subjective tug-back (Table 1). In addition, Spearman's coefficient was calculated to evaluate the repeatability of the experimental method. The value was 0.877, and this difference did not change the significance of the results.
However, when the master cone is fitted at the middle or coronal third, it may give a false impression of apical fitting. In the present study, we used teeth with a straight canal as determined by straight access by decoronation, and confirmed by apical cone adaptation with a radiographic exam to decrease the effect of false tug-back.
With the widespread use of rotary NiTi instruments, matched-taper GP cones have been developed and the single-cone technique has become popular again [14]. In the present study, we used 2 NiTi instruments and a matched GP cone, PF, and PTN. The PF 0.06 ISO rotary instrument has a constant taper and produces a uniformly tapered prepared canal space [15]. However, PTN has a variable taper. The PTN X3 file has a constant taper of 0.07 at the first 3 mm of the apical tip, and then a decreased taper over the rest of the upper active portions. In this study, we found no significant difference in tug-back scores, pulling force, and pGPOA between the different NiTi instruments. However, Schäfer et al. [16] reported that the use of single-cone technique with constant tapered GP cones resulted in a higher percentage of GP-filled area at the apical levels than with variable tapered GP cones. In respect to this comparison, further research using other NiTi instrumentation systems is needed. Based on the present results, the use of a matched-taper GP cone resulted in high pGPOA, which represented good apical cone adaptability. Thus, the use of matched GP cones in relation to taper and size as per the manufacturer's recommendation may ensure a clinically adaptable fit of the master cone.
However, in this study, the degree of tug-back was found to be different although the master GP cone corresponded in size and taper with the final NiTi instrument used to enlarge the canal. This may be explained by variations of anatomical and morphological characteristics of the teeth and a lack of consistency and accuracy in endodontic instruments and GP cones. Several investigations reported standardization problems for both root canal instruments and GP cones [17181920]. Even size 30/0.04 GP cones of the same size show a significant variability in diameter and taper depending on the brand [19]. Furthermore, the inconsistency in size and taper between NiTi instruments and GP cones was found within manufacturers' systems [20]. In this study, GP points of 2 brands were used: Diadent ML.029 and PTN. According to the manufacturer's information, Diadent GP points are hand jig rolled and laser inspected to produce precise and resilient points. PTN GP points are precision-machined GP cones, and the manufacturer claims that there should be no more size irregularities caused by hand rolling. However, differences according to the manufacturing process have not been proven to be significant.
Various experimental methods have been used to assess the quality of root canal sealing, such as fluid filtration [1], bond strength test [2122], photo-micrographic analysis [2516232425] and µCT imaging [4132627]. Above all, µCT imaging and stereoscopic microscopic methods allow the assessment of cross-sectional images of the space occupied by GP, sealer, and void. µCT imaging has several advantages over stereoscopic microscopic examination. It has a higher accuracy and nondestructive features and the quality of canal filling can be qualitatively and quantitatively evaluated [28]. Cross-sectional analysis has a potential problem of movement and distortion of the GP during the sectioning process even if the sealer allows a locking-in of the GP cones within the canal [5]. In this study, the µCT sections of 1, 2, and 3 mm from the apex were performed, because apical 3 mm of the root canal system is considered a critical zone in the management of infected canals [29]. The GPOA from µCT sections may represent the actual cone fitness for the root canal wall.
In the present study, the pulling force measured with a spring balance and pGPOA determined by µCT imaging were compared with tactile tug-back scores to examine their relation when assessing master cone adaptation. Within the limitations of this study, the tug-back scoring system and pulling force can be applied to determine the amount of cone adaptation to the root canal. Further study is required to investigate the effect of tug-back in relation to master cone adaptation and quality of the apical seal after canal filling.
CONCLUSIONS
The degree of tug-back, pulling force, and pGPOA had a strong correlation. The stronger the tug-back, the higher the pGPOA. There was no significant difference in pGPOA between the PTN and PF groups. The use of the tug-back scoring system and pulling force allows the interpretation of subjective tug-back in a more objective and quantitative manner.
 XML Download