

 PDF
PDF ePub
ePub Citation
 Print
Print


INTRODUCTION
Prediabetes is an altered metabolic state characterized by increased insulin resistance and decreased insulin secretion that occurs prior to the development of type 2 diabetes. Prediabetes is clinically significant because of its association with the progression of macrovascular and microvascular pathology, which results in high risks of retinopathy [1], cardiovascular diseases [234], and chronic renal diseases [5].
Albuminuria is an established risk factor for cardiovascular morbidity and mortality and for end-stage renal disease in individuals with diabetes mellitus [6789]. Microalbuminuria, which is defined as 30-300 mg/g creatinine, is a sign of progression towards nephropathy in patients with diabetes [10]. Albuminuria is a sensitive marker of renal dysfunction, and the American Diabetes Association has recommended annual testing for albuminuria in 12- or 24-hr urine samples to predict the risk of cardiovascular disease and renal dysfunction in cases of diabetes mellitus [11]. However, collecting urine for 12 or 24 hr is difficult in practice, and sometimes unreliable if the urine sample is incomplete. Measuring the 24-hr urine is the gold-standard method for detecting microalbuminuria [12], but measuring the albumin-to-creatinine ratio (ACR) in spot urine samples has also been recommended [13]. A point-of-care test utilizing a strip is expected to make the diagnosis and management more rapid and simpler than the conventional laboratory method, as the samples do not require transport, processing, and analysis in a clinical laboratory. Studies of the urinary ACR test using strips in diabetic patients have been reported [141516], but none of these studies evaluated prediabetic individuals.
The aim of this study was to determine the clinical and diagnostic values of a strip test for measuring the ACR in the urine of prediabetic subjects and to clarify the practical utility of this test for prediabetes management.
METHODS
1. Study subjects and sample selection
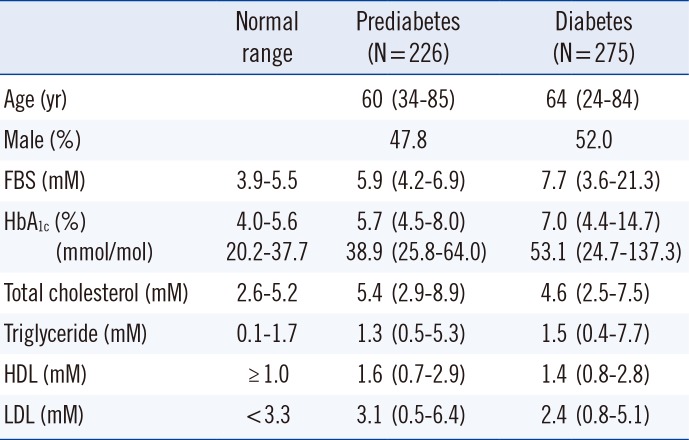
Table 1 shows the study subjects. A total of 501 morning fasting spot urine samples of 226 prediabetics and 275 diabetics were randomly selected from regular health checkup examinees at the Health Promotion Center from August to October 2015. The health checkup program screens apparently healthy individuals who visit the Health Promotion Center on a regular basis and provides them with information to further examine cases of abnormal findings or values. On the basis of their medical records, examinees with fasting blood glucose levels of 100-125 mg/dL or 5.7-6.4% (38.9-45.6 mmol/mol) HbA1c without any history of oral antidiabetic medication or insulin injection were classified as having prediabetes [17], while those with values of ≥126 mg/dL or ≥ 6.5% (47.7 mmol/mol) were classified as having diabetes. Serum glucose was measured using a Hitachi 7600 (Tokyo, Japan) using the hexokinase method. HbA1c was measured on a HLC-723 G8 (Tosoh, Tokyo, Japan) using HPLC. HbA1c assessments have been validated and certified by National Glycohemoglobin Standardization Program (NGSP) and compared against the Secondary Reference Laboratory.
ACR strip and laboratory quantitative tests were completed within 2 hr of urine collection.
This study was approved by the institutional review board of Korea Association of Health Promotion (130750-201601-HR-001).
2. ACR strip test
Urinary ACR was measured by a laboratory technician using CLINITEK Microalbumin 2 reagent strips (Siemens, New York, NY, USA) with a CLINITEK Advantus Analyzer (Siemens). This reagent strip test is a colorimetric assay that measures the concentrations of albumin and creatinine based on the color changes of the strip detected by reflectance spectrometry in the strip analyzer. The analyzer can provide a semiquantitative ACR value based on the measured albumin and creatinine concentrations; the albumin concentration is measured as 10, 30, 80, or 150 mg/L, while the creatinine concentration is measured as 10, 50, 100, 200, or 300 mg/dL, and thus, the ACR can be calculated as <30 mg/g (normal), 30-300 mg/g (microalbuminuria), or >300 mg/g (macroalbuminuria). Liquichek Urine Chemistry control levels 1 and 2 (Bio-Rad, Hercules, CA, USA) were used for the quality control of the ACR strip test. Level 1 of albumin was matched to categories defined as 10 or 30 mg/dL in the strip. Level 2 of albumin was matched to categories defined as 80 or 150 mg/dL in the strip. Level 1 of creatinine was matched to categories defined as 10, 50, or 100 mg/dL in the strip. Level 2 of creatinine was matched to categories defined as 200 or 300 mg/dL in the strip.
3. Laboratory quantitative test
To compare the results of the strip tests with a standard reference, the concentrations of albumin and creatinine in urine samples were also measured with a Hitachi 7600 using a turbidimetric immunoassay and an enzymatic method, respectively. These analytical methods provided measurement ranges for albumin and creatinine of 0.1-40.0 and 0.1-100 mg/dL, respectively. If the measurements were lower than the detection limit in the albumin and creatinine assays, they were denoted as 0.1. Liquichek Urine Chemistry control levels 1 and 2 were used for the quality control of albumin and creatinine assays. The intraassay and interassay coefficients of variation for the urinary albumin assay were 2.5% and 3.0%, respectively. The intraassay and interassay coefficients of variation for the urinary creatinine assay were 1.5% and 2.5%, respectively. The calculated ACR was classified as <30, 30-300, or >300 mg/g as in the strip test.
4. Data analysis
Statistical analyses were performed by using SAS version 9.4 (SAS Institute Inc., Cary, NC, USA). All results of the laboratory quantitative tests and strip tests from the 226 prediabetic and 275 diabetic subjects were analyzed. Data distributions were evaluated by using the Kolmogorov-Smirnov test. The variables that did not show a Gaussian distribution were expressed as the median [range]. Samples with ACR values of 30-300 or >300 mg/g were considered "positive," while those with values of <30 mg/g were considered "negative." Using ACR for quantitative analysis as the "gold standard," the sensitivity, specificity, accuracy, positive predictive value (PPV), and negative predictive value (NPV) of the ACR strip test were evaluated. The agreements in ACR between the strip test and quantitative test were expressed as simple κ coefficients in the prediabetes and diabetes groups. A test was based on the null hypothesis that κ was equal to zero, and the standardized test statistic had an asymptotic standard normal distribution.
RESULTS
1. Positive rates of albuminuria, urine albumin, creatinine, and ACR in prediabetes and diabetes
The strip tests revealed that the prevalence rates of albuminuria were 15.5% (microalbuminuria, 14.6%; macroalbuminuria, 0.9%) and 30.5% (microalbuminuria, 25.1%; macroalbuminuria, 5.5%) in subjects with prediabetes and diabetes, respectively; the corresponding values determined by the laboratory tests were 11.1% (microalbuminuria, 9.3%; macroalbuminuria, 1.8%) and 30.9% (microalbuminuria, 26.5%; macroalbuminuria, 4.4%).
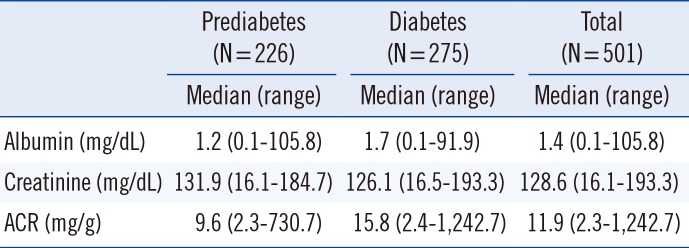
In the prediabetic group, the medians [range] of albumin, creatinine in urine, and ACR were 1.2 [0.1-105.8], 131.9 [16.1-184.7], and 9.6 [2.3-730.7], respectively. In the diabetic group, the medians [range] of albumin, creatinine in urine, and ACR were 1.7 [0.1-91.9], 126.1[16.5-193.3], and 15.8 [2.4-1242.7], respectively (Table 2).
2. Sensitivity and specificity of ACR strip test
In the prediabetic population, the sensitivity, specificity, PPV, NPV, and overall accuracy of the ACR strip method were 92.0% (95% confidence interval [CI], 81.4-100%), 94.0% (95% CI, 90.8-97.3%), 65.7% (95% CI, 50.0-81.4%), 99.0% (95% CI, 97.5-100%), and 93.8% (95% CI, 90.7-97.0%), respectively; the corresponding values in the diabetic population were 80.0% (95% CI, 71.5-88.5%), 91.6% (95% CI, 87.6-95.5%), 81.0% (95% CI, 72.6-89.3%), 91.1% (95% CI, 87.1-95.1%), and 88.0% (95% CI, 84.2-91.8%), respectively.
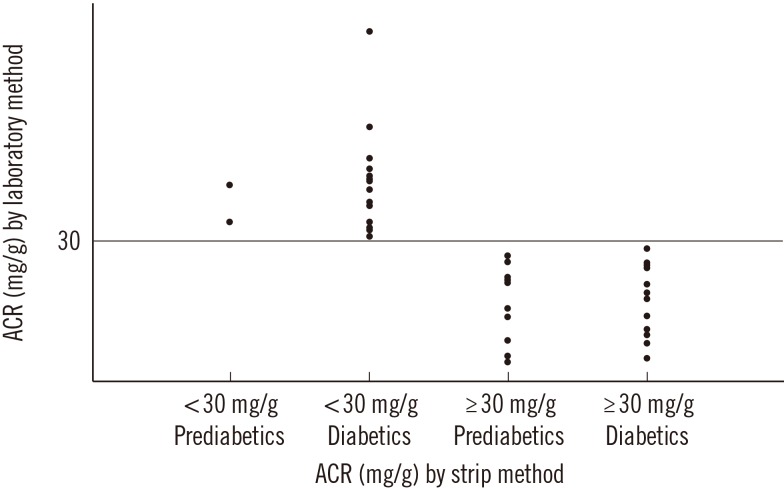
3. Comparison of ACR values measured using the strip and laboratory methods in prediabetes and diabetes
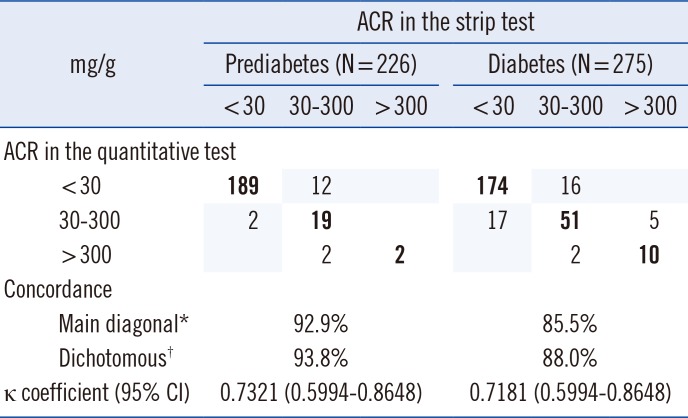
The concordance rates between the strip test and quantitative test for the ACR in prediabetes and diabetes subjects in the same categories were 92.9% and 85.5%, respectively, and the concordance rates in positive or negative categories were 93.8%, and 88.0%, respectively. The corresponding κ values of the ACR strip tests compared to those of the laboratory quantitative test were 0.7321 in prediabetes subjects and 0.7181 in diabetes subjects, indicating good agreement between the strip test and quantitative test, respectively (Table 3).
4. Discordance between ACR strip tests and laboratory quantitative tests
The ACR values for 16 of the prediabetic samples (7.1%) measured by using the strip method did not correspond to those obtained by using the laboratory method, with 2 false-negatives, 12 false-positives, and 2 underestimated-positives. The ACR values for 40 of the diabetic samples (14.5%) measured by using the strip method did not correspond to those obtained by using the laboratory method, with 17 false-negatives, 16 false-positives, 2 underestimated-positives, and 5 overestimated-positives.
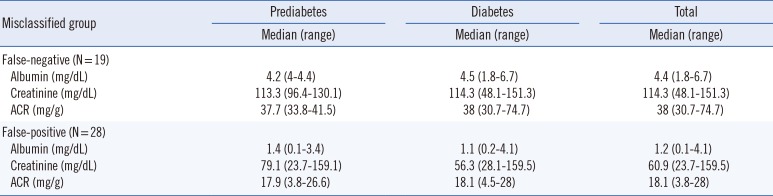
Albumin, creatinine in urine, and ACR in samples that had been misclassified by the strip test were as follows. In 19 cases of false-negatives by strip test, albumin was 1.8-6.7 [median; 4.4] mg/dL, creatinine was 48.1-151.3 [median; 114.3] mg/dL, and ACR was 30.7-74.7 [median; 38.0] mg/g. In 28 cases of false-positives by strip test, albumin was 0.1-4.1 [median; 1.2] mg/dL, creatinine was 23.7-159.5 [median; 60.9] mg/dL, and ACR was 3.8-28.0 [median; 18.1] mg/g (Fig. 1, Table 4).
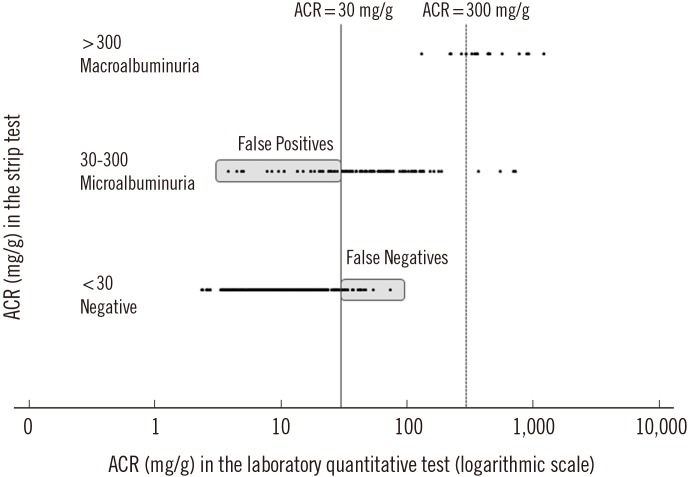
5. Distribution of urinary ACR in each category of urinary ACR by strip test
The subjects were classified into three groups on the basis of the ACR values obtained by using the strip method: <30, 30-300, and >300 mg/g. In the <30 mg/g group, the ACR range was 2.3-74.7 mg/g, and the median was 9.4 mg/g with an interquartile range (IQR) of 6.3-15.4 mg/g. In the group with ACR values of 30-300 mg/g, the ACR range was 3.8-730.7 mg/g, and the median was 46.9 mg/g with an IQR of 26.5-87.7 mg/g. In the >300 mg/g group, the ACR range was 131.5-1,242.7 mg/g, and the median was 368.8 mg/g with an IQR of 296.2-575.2 mg/g (Fig. 2).
DISCUSSION
We found that the positive rate of albuminuria was 15.5% in prediabetic subjects, which was lower than that in diabetes subjects (30.5%). In the Diabetes Prevention Program (DPP) study [18] involving individuals with a mean body mass index of 34 kg/m2 and impaired glucose tolerance, 6.0% of prediabetes subjects (impaired oral glucose tolerance test [OGTT]) had ACR values within the range of albuminuria (≥30 mg/g). In contrast, the prevalence of albuminuria was 13.0% in a Chinese population [19]. The prevalence of albuminuria in this study was close to that found in the Chinese population [19], but differed from that found in the DPP study [18]. The reasons for these different prevalence rates for albuminuria in prediabetes subjects across studies remain unclear, but they may be attributable to differences in the definitions of prediabetes (e.g. impaired fasting glucose or impaired OGTT), methods used to measure the ACR, and characteristics of the study subjects.
The early stage of renal dysfunction is known to be clinically silent and can be detected only by conducting a laboratory screening test for albuminuria in at-risk groups such as those with prediabetes or diabetes. National Kidney Foundation in the United States reported that random untimed spot urine samples were suitable for initial testing of albuminuria [20]. Furthermore, semiquantitative point-of-care tests for urinary ACR using strips have been used in studies involving renal outpatients [21] as well as diabetes and hypertensive patients [22].
Microalbuminuria in prediabetes was found to be related to its progression to diabetes [23], and the early detection of microalbuminuria in prediabetes using an easier and faster method is important for the management of prediabetes. This is the first study to apply an ACR strip method to prediabetes subjects. Among false-negative samples, 9 samples showed low levels of creatinine in the urine, suggesting that the urine was diluted, which may have affected the ACR. Thus, proper urine sampling is required for the ACR test. Excluding dilute specimens with a urine creatinine level lower than 50 mg/dL would further improve the diagnostic performance of the strip test. Among the 19 false-negative cases, 17 ranged from 30 to 45 mg/g in ACR, which appeared to be at the borderline between the two categories. Only 2 false-negative cases, which were revealed to be 33.8 and 41.5 mg/g using the laboratory quantitative method, were noted among the 191 cases of strip-negatives in prediabetes subjects, and NPV was notably high (99.0%). These findings indicate that a negative result in the strip method ensures that the patient does not have albuminuria. All false-negative cases in diabetes also showed borderline values between the two categories except in 2 cases. More frequent false-negative results in the diabetes subjects were considered to be related to the higher positive rate of microalbuminuria near the borderline value in the diabetes than in the prediabetes subjects. Among the 28 false-positive cases, 19 showed low specific gravity and very low creatinine in the urine, suggesting that the urine was diluted (data not shown). Thus, proper urine sampling and calibration for urine dilution appears to be required to increase the diagnostic sensitivity and specificity of the ACR strip test. Several studies of albuminuria have applied the strip method in diabetes. McTaggart et al [14] obtained sensitivity, specificity, PPV, and NPV of 78.0%, 80.0%, 55.0%, and 92.0%, respectively, in 274 diabetes patients. In another study, which included 259 diabetes patients [15], the sensitivity, specificity, PPV, and NPV of the ACR strip method were 91.5%, 92.0%, 71.0%, and 98.0%, respectively. Le Floch et al [16] obtained sensitivity, specificity, PPV, and NPV of 79.0%, 81.0%, 46.0%, and 95.0%, respectively, in 302 diabetes patients. The differences in PPV among these studies (including the present study) appeared to depend on the prevalence of albuminuria in the study subjects.
The ACR strip test can distinguish ACR values of >300 mg/g from those of 30-300 mg/g. All 17 cases of albuminuria (ACR>300 mg/g) detected in the strip tests in this study were confirmed by using the laboratory quantitative method. There were no false-positives in cases with ACR >300 mg/g as measured by using the ACR strip test, indicating that all such cases can be diagnosed as having albuminuria. The ACR strip test was considered to be useful for screening for albuminuria because of its advantage in selecting out negative samples from prediabetes and diabetes subjects.
There were some limitations to this study. First, electrophoresis was not performed for the urine samples, for further evaluation of false-positive and false-negative findings. Second, although discrepant samples were re-analyzed, it was difficult to obtain second samples from the health examinees. Third, the study subjects participated through a medical checkup program; hence, the results may exhibit selection bias.
In conclusion, the ACR strip test showed high sensitivity, specificity, and NPV in prediabetes and diabetes subjects, suggesting that this test can be used to screen for albuminuria in cases of prediabetes and diabetes. However, caution should be exercised in urine sampling and interpretation of the results of the urinary ACR strip test.
 XML Download