

 PDF
PDF ePub
ePub Citation
 Print
Print


INTRODUCTION
Cell-free DNA is a well-known type of DNA existing in the bloodstream but outside of blood cells, which was first described in 1948 [1]. Since Leon et al [2] discovered elevated levels of cell-free DNA in cancer patients in 1977, there has been great progress in cell-free DNA quantification research [3], and this emerging field has attracted much interest, resulting in reports on its numerous potential clinical applications for many pathologic conditions such as malignancy [4567891011], prenatal diseases [1213], trauma [1415], organ dysfunction [16], autoimmune diseases [17], and organ transplantation [18]. However, notable disagreements concerning the quantitative analysis of plasma DNA from a large number of laboratories have become a considerable pitfall, hampering its application in clinical laboratories [19]. In 2004, a large prospective investigation of plasma DNA concentrations in healthy subjects and cancer patients was carried out by using the PicoGreen double stranded (ds)DNA quantification reagent kit (Invitrogen, Waltham, MA, USA) with reference to a standard curve [20]. The results showed high variability in the plasma DNA levels of healthy control subjects across the 20 participating laboratories, which was mainly derived from differences in the DNA extraction process. Recently, several protocols have been developed for DNA extraction. However, the inevitable and various loss of circulating cell-free DNA during extraction may have a significant impact on the outcome [212223242526].
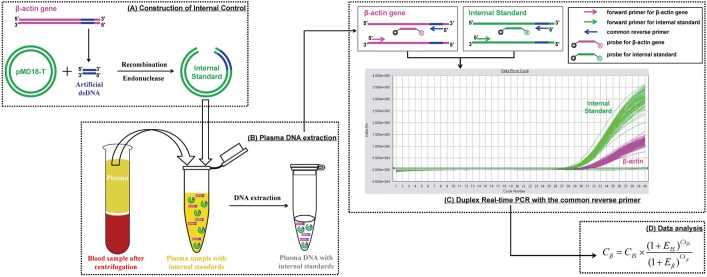
To overcome this problem, a precise assay with low uncertainty is needed for clinical application of plasma DNA quantification. Herein, we describe the development and evaluation of a duplex real-time PCR assay with a novel internal standard for plasma DNA quantification. The principle of this assay is depicted in Fig. 1. In brief, a 41-bp corresponding sequence selected from the human housekeeping β-actin gene was recombined with the plasmid vector. After endonuclease digestion, the linear recombinant plasmid DNA of known concentration was added to the plasma sample as an internal standard and extracted along with endogenous nucleic acids. The internal standard and target β-actin gene were then amplified simultaneously in the same tube by duplex real-time PCR using a common reverse primer, enabling the close amplification efficiency. After amplification, the concentration of the target β-actin gene was calculated according to the known internal standard quantity.
METHODS
1. Ethics statement
This study was approved by the Ethics Committee of the First Affiliated Hospital of Nanjing Medical University. Written informed consent for the use of the clinical samples was obtained from all of the healthy adults and patients involved in this study.
2. Internal standard
A 41-bp artificial dsDNA sequence corresponding to the human β-actin gene was cloned and inserted into the pMD18-T vector using a Takara Reagent Set (Takara, Dalian, China). After the identification of the cloned insert by Sanger sequencing, one confirmed clone was selected, and the recombinant plasmid DNA was extracted with the E.Z.N.A Plasmid Miniprep Kit (Omega Bio-Tek, Norcross, GA, USA), which was then linearized by restriction enzyme digestion (Omega Bio-Tek). After quantification according to absorbance measurements at 260 nm, the copy number of recombinant plasmid DNA was determined by dividing the total DNA concentration by the weight of each plasmid molecule. The recombinant plasmid DNA was then used as the internal standard in our duplex real-time PCR assay.
3. Primers and probes
Primers and probes for the target β-actin gene and the internal standard were designed by using Primer Express Software, version 3.0 (Life Technologies, Carlsbad, CA, USA). The reverse primer for both the β-actin gene and internal standard was located in the 41-bp corresponding sequence. The sequences were as follows: (a) forward primers, 5'-GGACCTGACTGACTACCTCATGAA-3' (β-actin), 5'-AAACAGCTATGACCATGATTACGAA-3' (internal standard); (b) common reverse primer, 5'-CTTAAT GTCACGCACGATTTCC-3' (β-actin and internal standard); (c) probes, 5'-JOE-CACCGAGCGCGGCTACAGCTTC-ECLIPSE-3' (β-actin), 5'-FAM-CCACCAACCGCTCCCGTAATCTCTAG-ECLIPSE-3' (internal standard), JOE and FAM representing 2,7-dimethyl-4,5-dichlorine-6-carboxyfluorescein and 6-carboxyfluorescein, ECLIPSE, respectively, are kind of non-fluorescent quenchers. All PCR primers and fluorescent probes were custom-synthesized by Invitrogen (Shanghai, China).
4. Duplex real-time PCR assay with internal standard for plasma DNA quantification
Duplex real-time quantitative PCR was carried out in a reaction volume of 50 µL by using components of the Takara Ex Taq R-PCR system, version 2.1 (Takara). Each PCR mixture consisted of 200nM each forward primer; 700nM reverse primer; 100nM each probe; 1 unit of Takara Ex Taq HS polymerase; 400µM each dATP, dTTP, dCTP, and dGTP; 6mM MgCl2; 1× real-time PCR buffer and 5 µL purified plasma DNA. Thermal reaction conditions were as follows: 95℃ for 5 min, followed by 50 cycles of 95℃ for 15 sec, 56℃ for 30 sec, and 72℃ for 40 sec. Amplifications were carried out in the 7,500 Sequence detector (Applied Biosystems, Foster City, CA, USA). After the baseline value of the amplification plot was set, normalized reporter signals (Rn) data were exported and analyzed with linear regression by using LinRegPCR software to obtain the average amplification efficiencies of the target gene and internal standard [27]. An optimal threshold was then selected to check the threshold cycle (Ct) values. Because the same threshold was used for the amplification plots of the β-actin gene and internal standard, the plasma DNA concentrations, expressed in copies/mL, were calculated with the following equation:
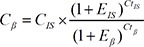
where C = β-actin gene concentration in plasma (copies/mL), E=average amplification efficiency, and the subscripts β and IS represent the β-actin gene and internal standard, respectively. The concentration (ng/mL) was calculated by using 3.3 pg of single-copy human genomic DNA as a conversion factor.
5. Other two traditional quantification methods
Single real-time quantitative PCR was carried out for the β-actin gene as described above for the duplex real-time PCR assay. Plasma DNA concentrations were extrapolated according to the external standard curve with five-point human genomic DNA standards ranging from 0.1 to 1,000 ng/mL. Fluorescent PicoGreen assay was performed using the PicoGreen dsDNA kit (Invitrogen) and the fluorescence intensity was measured on a fluorescence spectrophotometer (Spectra Max Gemini EM, Molecular Devices, Sunnyvale, PA, USA) at an emission wavelength of 520 nm and excitation wavelength of 480 nm. The standard curve constructed by serial dilution of lambda DNA stock provided by the manufacturer (0.1-1,000 ng/mL) was used to extrapolate plasma DNA concentrations.
6. Assay evaluation
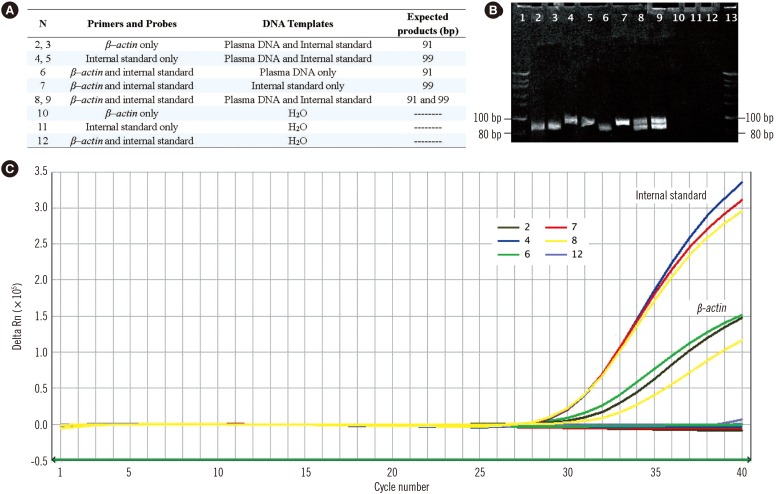
Duplex real-time PCR amplification of plasma DNA, internal standard DNA, and the mixture of both in parallel PCRs were performed in preliminary experiments to confirm the specificity of the duplex PCR assay.
After quantified by ultraviolet spectrophotometry, the plasma sample separated from the long-term preserved blood (standing at room temperature for 48 hr) was diluted by normal saline in a 10-fold serial pattern (10-2, 10-1, 100, 101, 102, and 103 ng/mL) and quantified by using the three different methods described above to evaluate their sensitivities. To evaluate the precision of these methods, plasma samples with different DNA concentrations (10-1, 100, 101, 102, and 103 ng/mL) were quantified 10 times in one run to determine the intra-assay variability, and were repeatedly quantified in 10 runs to calculate the inter-assay variability.
The accuracies of the three different methods were determined by a recovery test. Briefly, the purified plasma DNA (0, 0.02, 0.2, 2, 20, and 200 ng) was poured into 200 µL of plasma sample. Total plasma DNA was extracted and quantified by the three different methods.
These three methods were applied to quantify the concentrations of plasma DNA extracted from the same pooled plasma by three different DNA purification protocols including the E.Z.N.A Blood DNA Kit (Omega Bio-Tek, Norcross, GA, USA), QIAamp DNA Blood Mini Kit (Qiagen, Valencia, CA, USA), and the traditional phenol-chloroform extraction followed by ethanol precipitation. These three methods were also applied to quantify plasma DNA levels of 400 healthy adults.
7. Healthy subjects and trauma patients
A total of 5,442 healthy adults (median age, 44 yr; 2,350 females) undergoing an annual health check and 200 patients (median age, 49 yr; 112 females) with an acute traumatic injury requiring admission to the department of emergency surgery at the First Affiliated Hospital of Nanjing Medical University were recruited with informed consent. Patients who were younger than 18 yr old, pregnant, or admitted because of thermal injury were excluded. The total extent of the trauma was calculated by the injury severity score (ISS) at the time of hospitalization.
8. Blood sample collection and processing
Fasting blood samples (2 mL) were collected from healthy adults during physical examination. Peripheral blood (2 mL) was withdrawn from the antecubital vein of each trauma patient at 20-100 min (median, 50 min) after injury. All blood samples were processed within 2 hr of sample collection. In brief, EDTA blood samples were centrifuged at 1,600g at room temperature for 10 min. The supernatant was transferred into polypropylene tubes with particular care to avoid disturbance of the buffy coat, and further subjected to additional centrifugation at 16,000g and 4℃ for 10 min to remove any residual blood cells. After addition of 50,000 copies of the internal standard, the double-centrifuged cell-free plasma samples with 2.5×10⁵ copies/mL internal standard were frozen at -70℃ before DNA extraction.
DNA was extracted from 200 µL plasma sample by using the Bilatest DNA/RNA kit (Bilatec AG, Viernheim, Germany), and the purified plasma DNA were stored at -70℃ for further analysis.
9. Statistical analysis
All statistical analyses were performed in a blinded manner by using Stata/SE 9.2 (Stata Corporation, College Station, TX, USA). The concordance of plasma DNA concentrations quantified by the duplex real-time PCR assay and ultraviolet spectrophotometry was determined by Spearman's rank correlation test, which was also used for the correlation of plasma DNA concentrations and ISS in trauma patients. One-way ANOVA was used to detect differences among the four groups with different DNA extraction protocols. The median plasma DNA concentrations of healthy males and females and of the trauma patients were analyzed with the Mann-Whitney two-sample rank sum test. The reference intervals of the plasma DNA concentration were determined at the 95% confidence interval. The t-test was used to compare the recovery rates of different quantitative assays.
RESULTS
1. Assay specificity and sensitivity
The target β-actin gene and internal standard were amplified by their corresponding primers to obtain 91-bp and 99-bp PCR products, respectively, without cross-species amplification. Based on the 5' nuclease Taqman assay, fluorescent signals from FAM and JOE were released and detected in channels 1 and 2, respectively, of the ABI 7500 Sequence Detector (Fig. 2).
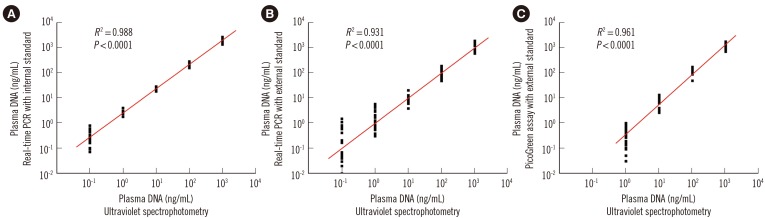
There was a high correlation between circulating DNA concentrations in serial diluted plasma samples quantified by ultraviolet spectrophotometry and those determined by the duplex real-time PCR assay (R2=0.988; Spearman's rank correlation test, P <0.0001; Fig. 3A) and the single real-time PCR assay with external standards (R2=0.931; Spearman's rank correlation test, P <0.0001; Fig. 3B). Amplification of the β-actin gene continued until the DNA concentration of the plasma sample decreased to 0.1 ng/mL; thus, the sensitivities of both real-time PCR assays were 0.1 ng/mL. In the PicoGreen assay, a high correlation (R2>0.90) was only observed once the plasma sample concentration was above 1.0 ng/mL (R2=0.961; Spearman's rank correlation test, P <0.0001; Fig. 3C); thus, the sensitivity was 1.0 ng/mL.
2. Assay precision and accuracy
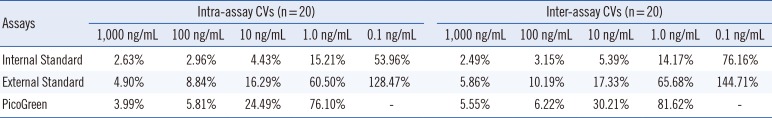
The intra- and inter-assay CVs of the duplex real-time PCR, single real-time PCR, and PicoGreen assays for plasma samples with different DNA concentrations are shown in Table 1. There was an increasing trend in the precision of the three methods for plasma samples with higher DNA concentrations. However, the duplex real-time PCR with internal standard showed better precision than the other two methods, especially for plasma samples with lower DNA concentrations (≤10 ng/mL).
The mean recovery rates of the internal standard assay (111.9%, 109.3%, and 99.4%) for plasma samples with different DNA concentrations (10, 100, and 1,000 ng/mL) were all close to 100% (P =0.066, 0.165, and 0.896; t-test), while the mean recovery rates of the external standard assay by real-time PCR (58.6%, 80.3%, and 75.8%)or the PicoGreen assay (62.6%, 73.8%, and 77.2%) for plasma samples with different DNA concentrations (10, 100, and 1,000 ng/mL) were all significantly lower than 100% (P <0.001, t-test). The mean recovery rate of external standard assays for plasma samples with low DNA concentrations (10 ng/mL) was significantly lower than that of samples with higher concentrations (100 and 1,000 ng/mL) (P < 0.0001, t-test).
3. Assay stability
Although there were significant differences in plasma DNA concentrations determined by real-time PCR with the external standard and the PicoGreen assay in samples purified by the three different protocols (one-way ANOVA, P=0.0041 and<0.0001), no such difference was observed using our duplex real-time PCR assay (one-way ANOVA, P=0.5821).
4. Plasma DNA concentrations of healthy adults and trauma patients
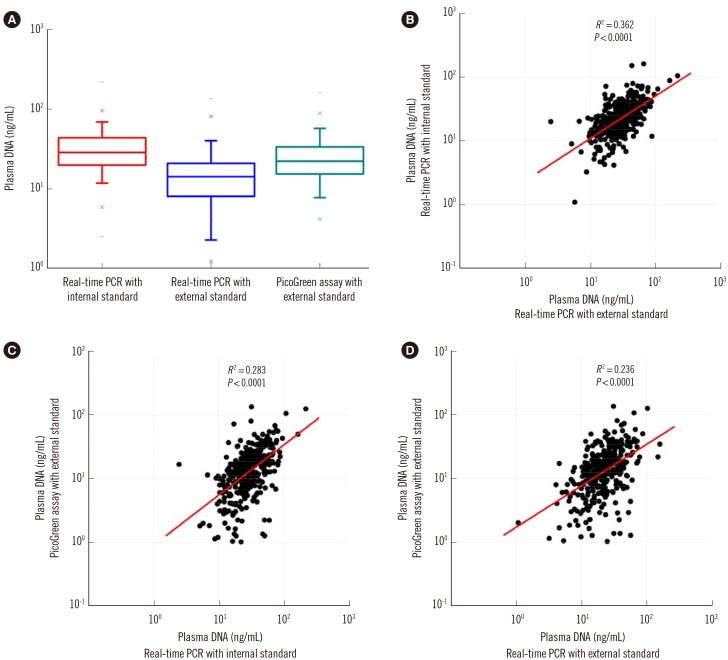
Plasma DNA levels of 400 healthy adults were determined by three different methods. Although the median plasma DNA concentration determined by duplex real-time PCR with the internal standard (18.1 ng/mL) was significantly higher than those determined by real-time PCR and the PicoGreen assay with external standards (8.2 ng/mL and 13.3 ng/mL; Wilcoxon matched-pairs signed-rank test, P<0.0001; Fig. 4A), there were statistically significant but weak positive correlations among plasma DNA levels determined by these three different methods (Fig. 4B-D).
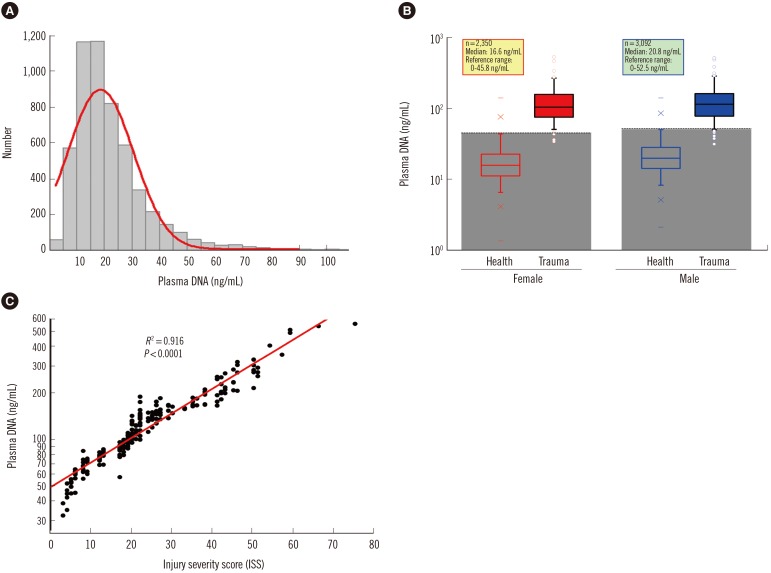
The sampling distribution in the plasma DNA levels of 5,442 healthy adults is shown in Fig. 5A. There was no statistically significant difference in the median age between males and females (Mann-Whitney two-sample rank sum test, P=0.3589), but the median plasma DNA concentration of males (20.3 ng/mL) was significantly higher than that of females (16.1 ng/mL) (Mann-Whitney two-sample rank sum test, P<0.0001; Fig. 5B). There was no statistically significant correlation of plasma DNA levels with age (Spearman's rank correlation test, R2=0.003). Within the 95% confidence interval, the upper normal cutoff values of the plasma DNA level were 52.5 ng/mL and 45.8 ng/mL for males and females, respectively.
As shown in Fig. 5B, the plasma DNA concentrations of the majority of trauma patients (96%) were higher than the reference range. There was a significant difference in the median plasma DNA concentrations among trauma patients with moderate (ISS<16, n=53, median 68.2 ng/mL), severe (ISS 16-25, n=78, median 109.2 ng/mL), and very severe (ISS>25, n=69, 201.1 median ng/mL) injury (Kruskal-Wallis test, P<0.001). Comparison of plasma DNA concentrations in trauma patients with their ISS values revealed a statistically significant positive correlation (Spearman rank correlation test, R2=0.916, P<0.0001, Fig. 5C).
DISCUSSION
There are various methods available for circulating cell-free DNA quantification, including real-time PCR [567891011121314151618212223242526], fluorescence spectrophotometry [4172023242528], ultraviolet spectrophotometry [22], capillary electrophoresis [2930], mass spectrometry [3031], surface plasmon resonance [3233], and electrochemical luminescence [34]. However, because DNA extraction inevitably leads to DNA loss, all of these methods have thus far been used for scientific research only and have not been applied in clinical laboratories. An internal control is helpful to eliminate pre-analytical errors and increase the precision for absolute quantification [35]. In the current study, a recombinant plasmid with an artificial 41-bp dsDNA containing the corresponding sequence of the human β-actin gene was designed as the internal standard. Simultaneous amplification of this internal standard and target gene was conducted with a common reverse primer, and similar fragment lengths were obtained with close amplification efficiencies. Moreover, two Taqman probes labeled with different fluoresceins as reporter dyes (FAM and JOE) were designed and applied to this duplex real-time PCR. Fluorescent signals from amplifications of the internal control and target gene could be detected separately in different channels of the ABI 7500 Sequence Detector. During the quantification process, the internal standard can be extracted and amplified along with the target human genomic DNA in the same tube to eliminate the variation introduced during DNA extraction and amplification.
Compared with the other two quantitative methods with external standards [10121423], this novel duplex PCR assay is more sensitive, repeatable, and accurate. The PicoGreen assay, which detects nucleic acids by direct fluorescence binding, is less sensitive than real-time PCR methods, which detect nucleic acid fragments by exponential amplification. Because the same basic methodology and DNA extraction kits were used, our duplex real-time PCR assay showed the same sensitivity as the single real-time PCR assay with external standards. In terms of the precision, the inter-assay CV values of the DNA concentrations of the plasma samples increased and had repeatable results in the range of 1-1,000 ng/mL, which covered the plasma DNA levels of both healthy individuals and clinical patients. The precisions of the single real-time PCR assay were worse at high concentrations (≥100 ng/mL) and better at low concentrations (≤10 ng/mL) than those of the PicoGreen assay. The precision of the duplex real-time PCR assay was better than the other two methods at all concentrations, which is likely due to the elimination of variables among different tubes by the internal standard. This correction from the internal standard also contributed to the accuracy of our novel assay, which was assessed with a recovery test that showed a consistently more pronounced bias at low plasma DNA input levels (≤1 ng/mL) than at high input DNA levels (≥10 ng/mL).
DNA extraction is an important factor influencing quantitative measurements of cell-free circulating DNA levels. Significant differences in the extraction efficiency for different commercial DNA extraction kits have been reported [192021]. In the present study, we could obtain a constant quantitative result of plasma DNA regardless of the DNA extraction protocol used when applying the novel duplex real-time PCR assay, by adding a known amount of recombinant plasmid DNA as an internal standard into each plasma sample, so that the target human genomic DNA is extracted and amplified together with the internal standard in the same tube. Therefore, this method shows great advantages over traditional quantitative methods using external standards.
Interestingly, the plasma DNA levels of 400 healthy adults determined by two popular DNA quantitative methods were lower than those determined by our duplex real-time PCR assay, which may be due to the loss of plasma DNA during sample extraction. This factor has been ignored by other studies, but is considered in our assay since we and others have consistently confirmed variations in the isolation efficiencies from different kits, which may be one of the major sources of variability in plasma DNA quantification.
Circulating cell-free DNA has potential to be a useful disease biomarker, and there has been an explosion of studies demonstrating the presence of elevated plasma or serum DNA in patients. However, the reference intervals of circulating cell-free DNA concentrations have not been established by large-scale studies, except a few reports including less than 100 healthy individuals [567891012131415161736]. In this large-sample study, we quantified the plasma DNA levels of 5,442 healthy volunteers using our precise duplex real-time PCR assay with the novel internal standard, and for the first time found a slight but statistically significant difference between males and females, which may be due to different metabolic rates between the sexes; therefore, this difference should be carefully considered in future studies. The reference interval of plasma DNA from our results was slightly higher than that of other reports based on single real-time PCR and PicoGreen assays, both with external standards [91014], which simply ignored the loss of nucleic acid during DNA extraction. Previous studies have demonstrated that plasma DNA concentrations in patients with severe injuries were significantly higher than those of patients with less severe injuries [1437]. The current study further showed that plasma DNA concentrations, which increase significantly early after injury, were closely correlated with the overall ISS scores of patients with multiple injuries. Although cell apoptosis and necrosis are the main sources of free circulating DNA in plasma, tissue damage and cell death during injury will cause a dramatic increase of plasma DNA levels, which should correlate with injury severity. The newly developed assay with an internal control allows for more precise quantitative measurements of plasma DNA than the traditional methods, and showed a higher correlation (R2=0.916) of ISS values and plasma DNA levels compared with that reported previously (R2=0.572) [14]. However, the application of plasma DNA quantification in clinical laboratories requires more detailed and reliable detection methods.
In conclusion, our newly developed plasma DNA quantification method with the power of eliminating variation introduced during plasma sample processing shows stable analytical performance and acceptable reproducibility, precision, and accuracy. Therefore, this method has a very promising future in multi-center studies of plasma DNA quantification and in clinical applications for the diagnosis and monitoring of certain diseases.
 XML Download