Journal List > Ann Lab Med > v.36(1) > 1091449

Schüring, Kelsch, Pierściński, and Nofer: Establishing Reference Intervals for Sex Hormones on the Analytical Platforms Advia Centaur and Immulite 2000XP

Abstract

Reliable reference intervals for sex hormones are indispensable in evaluations of the hypothalamo-pituitary-gonadal axis. This study established reference intervals for estradiol, progesterone, luteinizing hormone, follicle-stimulating hormone, and prolactin with the immunoassay platforms Advia Centaur and Immulite 2000XP (Siemens Healthcare, Germany). We recruited healthy men (n=220), women in the follicular (n=139) or luteal (n=87) phases of the menstrual cycle, and postmenopausal women (n=103). Data was analyzed according to CLSI EP28-A3c guidelines. Although reference intervals established with both platforms showed good agreement with ranges quoted by the assay manufacturer, two discrepancies were noted. First, intervals for prolactin in women were influenced by hormonal status, and the partition analysis supported their separation into subgroups based on menstrual cycle. Second, the upper limit for estradiol in the follicular phase was nearly a half of that provided by the manufacturer. This discrepancy was attributed to the stringent definition of the follicular phase (consistently set at days 3-5 after menstruation onset). Our findings suggest that reference values for prolactin should both be gender specific and account for menstrual cycle phase. The results also emphasize that clear-cut selection criteria are required when assembling populations for establishing endocrine reference intervals.

Determinations of estradiol (E2), progesterone (Prg), luteinizing hormone (LH), follicle-stimulating hormone (FSH), and prolactin (Prol) levels are indispensable in functional evaluations of the hypothalamo-pituitary-gonadal axis. The measurement of these serum concentrations requires assays with robust analytical performance [12]. Notably, the precise and accurate measurement of both steroid and peptide hormones is technically demanding, and the availability of gold-standard methods such as mass spectrometry remains limited to a few reference laboratories [34]. On the contrary, platform immunoassays-although rapid, automatable, and easy to perform-have inadequate specificity, sensitivity, and precision. Therefore, the results provided by various laboratories are often difficult to compare, which considerably narrows their clinical usability. This limitation is further compounded by differences in the reference intervals provided by assay manufacturers.
To facilitate the comparability of parameters useful in the assessment of hypothalamo-pituitary-gonadal axis function, we established reference intervals for E2, Prg, LH, FSH, and Prol with two widely used immunoassay platforms: Advia Centaur and Immulite 2000XP (both from Siemens Healthcare, Eschborn, Germany). The results document discrepancies in the reference intervals provided by the manufacturer that may be relevant to the correct interpretation of laboratory results. Our study underscores the importance of adhering to guidelines and using clear-cut selection criteria when assembling and analyzing populations to establish endocrine reference intervals.
Serum samples were collected from 549 subjects (96% Caucasians of European descent) from whom informed consent had been obtained. Women (n=226) of reproductive age (25-44 yr) were recruited at the Reproductive Medicine Unit at the University Hospital Münster, Germany in 2013 and 2014. They were anamnestically free of acute or chronic inflammatory, infectious, hematooncologic, metabolic (including diabetes mellitus), and other diseases, had regular menstrual cycles (25-35 days with <4 days of variation from cycle to cycle), and had not been using hormonal contraceptives or other regular medications for at least three months. Their status as healthy was confirmed with corporal examination and standard laboratory procedures. The follicular and luteal phases were defined as days 3-5 and 21-23 after the onset of menstruation, respectively. Men (n=220, aged 20-68 yr) and postmenopausal women (n=103, aged 49-66 yr) were recruited from voluntary donors at the University Hospital Münster blood bank. These subjects were free of acute or chronic inflammatory, infectious, hematooncologic, metabolic (including diabetes mellitus), and other diseases by anamnestic, corporal, and laboratory examination, and they had not taken regular medications for at least six months. The postmenopausal phase was defined as spontaneous amenorrhea for at least 12 months. Blood samples were collected in the morning (0800-1200) and centrifuged, and the sera were frozen at -80℃. All samples were analyzed in parallel on the Advia Centaur and Immulite 2000XP platforms in a single run.
Data was analyzed according to CLSI EP28-A3c [5]. Distribution of normality was assessed with the Kolmogorov-Smirnov test. Non-normally distributed parameters were analyzed after logarithmic transformation. The Tukey test or Dixon range statistic [6] was used to identify outliers in groups with normal or non-normal distributions, respectively. When necessary, the appropriateness of partitioning of the study population into subgroups was assessed by using the proportion criteria suggested by Lahti et al. [7]. Reference intervals for combined subgroups were considered unreliable if >4.1% or <0.9% of a subgroup fell outside the upper or lower limits, respectively, of a combined reference interval. Concentrations below the limit of detection (LOD) were ascribed the value of half the LOD. Parametric or robust methods were used for n >120 or 40 <n <120 reference groups, respectively, with normal distribution. A non-parametric method was used for reference groups with non-normal distribution.
The 2.5th and 97.5th percentiles were used to form reference limits with 90% confidence intervals. No lower reference limits were reported if the 2.5th percentile fell below the LOD. Passing-Bablok regression analysis with the Cusum test for linearity was used for method comparison [8]. The Mann-Whitney U test (two-sided) was used to compare mean values in the examined groups. Statistical analysis was performed with MedCalc Statistical Software (MedCalc 13.0 Software bvba, Ostend, Belgium).
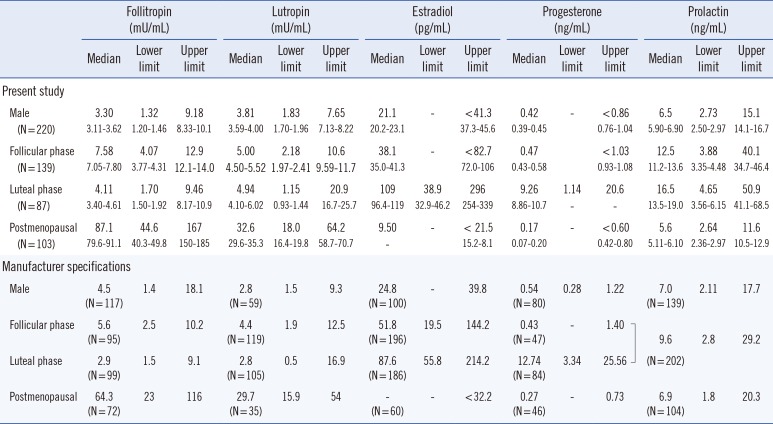
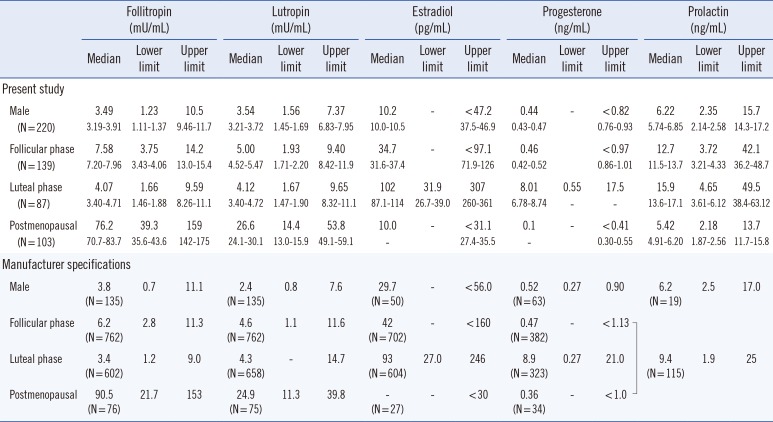
The comparison of results obtained with the Advia Centaur and Immulite 2000XP platforms with Passing-Bablok regression revealed linear relationships without significant deviations for all parameters tested in the present study (not shown). The reference intervals for gonadotropins established with the two platforms tested showed good agreement with the normal ranges quoted by Siemens (Table 1 and 2) and other major assay manufacturers (Roche Cobas, Abbott Architect, and Axsym, not shown). This result is concordant with the less pronounced cross-method discrepancies observed for peptide hormones [910] and may be attributable to the widespread availability of international standards.
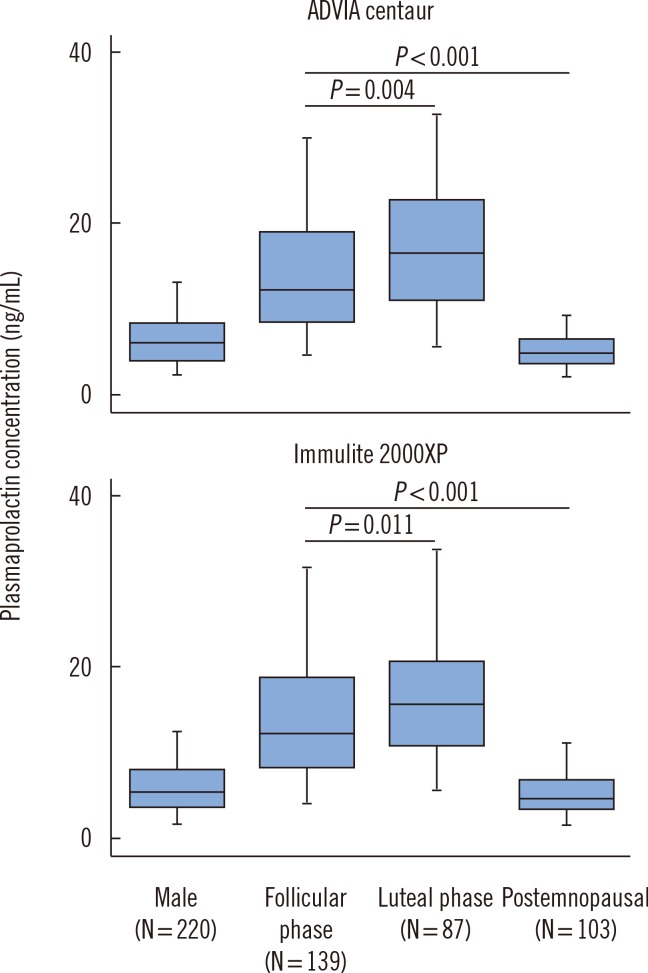
However, we observed substantial alterations in Prol levels throughout the menstrual cycle (Fig. 1, Table 1) with upper limits in the luteal phase that were higher than those in the follicular phase and upper limits in both phases that were higher than those in postmenopausal women. Moreover, the proportion of Prol values in the luteal phase that fell outside the upper limit of combined reference intervals for both phases exceeded 4.1% for both the Advia Centaur and the Immulite 2000XP platforms, which justifies the partitioning of Prol into subgroups in women of reproductive age based on menstrual cycle phase.
The modulatory effect of sex hormones on pituitary Prol secretion is well known, and the variability of Prol reference ranges depending on cycle phase was reported in a previous study [11]. Despite this variability, most manufacturers continue to provide combined Prol reference values for the follicular and luteal phases (Siemens) or even for the follicular, luteal, and postmenopausal phases (Siemens, Roche, Abbott), which may result in the misdiagnosis of mild functional hyperprolactinemia in healthy women. The present findings strongly suggest that applying specific reference intervals for each phase of the menstrual cycle may aid the correct interpretation of plasma Prol levels in female patients and is more appropriate than using common reference ranges for each sex.
Compared with those for peptide hormones, the reference intervals for sex steroids established herein deviated more from those provided by platform assay manufacturers. In particular, the upper limit for E2 in the follicular phase was almost a half that quoted by Siemens for the Advia Centaur and Immulite 2000XP platforms. Although the reason for this discrepancy remains unknown, we hypothesize that it is related to the rigorous definition of the follicular phase, which was consistently set to days 3-5 after menstruation onset in the present study. A more liberal inclusion criterion-as apparently specified by the major assay providers-could lead to the inclusion of female subjects at later stages of the follicular phase, skewing the reference intervals for E2 toward higher values.
Some limitations of the present study must be acknowledged. First, 96% of the included subjects were Caucasians of European descent. This makeup limits the applicability of the established reference intervals to populations with other ethnic backgrounds. Second, we were able to recruit only a limited number of women in the luteal phase for the study. Therefore, our recommendation to partition Prol ranges in reproductive-age women into subgroups based on menstrual cycle phase must be re-evaluated in a larger and more representative cohort.
In conclusion, our findings emphasize the cycle dependency and association with menopausal status of Prol levels in plasma and suggest that reference intervals for Prol should be not only gender-specific but also given according to the cycle phase. In addition, these findings underscore the importance of defining precise selection criteria when assembling populations to establish endocrine reference intervals.

Acknowledgments

We thank Ms. Elke Börger for technical assistance. This study was supported by the intramural resources of the Center for Laboratory Medicine (to J.-R. N.) and by Siemens Healthcare Diagnostics.

Notes

Authors' Disclosures of Potential Conflicts of Interest: No potential conflicts of interest relevant to this article were reported.

References

1. Casanueva FF, Molitch ME, Schlechte JA, Abs R, Bonert V, Bronstein MD, et al. Guidelines of the Pituitary Society for the diagnosis and management of prolactinomas. Clin Endocrinol (Oxf). 2006; 65:265–273. PMID: 16886971.
2. Mulders AG, Laven JS, Eijkemans MJ, Hughes EG, Fauser BC. Patient predictors for outcome of gonadotrophin ovulation induction in women with normogonadotrophic anovulatory infertility: a meta-analysis. Hum Reprod Update. 2003; 9:429–449. PMID: 14640376.
3. Bellem A, Meiyappan S, Romans S, Einstein G. Measuring estrogens and progestagens in humans: an overview of methods. Gend Med. 2011; 8:283–299. PMID: 21907634.
4. Stanczyk FZ, Jurow J, Hsing AW. Limitations of direct immunoassays for measuring circulating estradiol levels in postmenopausal women and men in epidemiologic studies. Cancer Epidemiol Biomarkers Prev. 2010; 19:903–906. PMID: 20332268.
5. Horowitz GL, Altaie S, et al. Defining, establishing and verifying reference intervals in the clinical laboratory; Approved guideline-3rd ed. CLSI document C28-A3E. Wayne, PA: Clinical Laboratory Standards Institute;2008.
6. Dixon WJ. Processing data for outliers. Biometrics. 1953; 9:74–89.
7. Passing H, Bablok W. A new biometrical procedure for testing the equality of measurements from two different analytical methods. Application of linear regression procedures for method comparison studies in Clinical Chemistry, Part I. J Clin Chem Clin Biochem. 1983; 21:709–720. PMID: 6655447.
8. Lahti A, Petersen PH, Boyd JC, Rustad P, Laake P, Solberg HE. Partitioning of nongaussian-distributed biochemical reference data into subgroups. Clin Chem. 2004; 50:891–900. PMID: 15010425.
9. Sikaris K, McLachlan RI, Kazlauskas R, de Kretser D, Holden CA, Handelsman DJ. Reproductive hormone reference intervals for healthy fertile young men: evaluation of automated platform assays. J Clin Endocrinol Metab. 2005; 90:5928–5936. PMID: 16118337.
10. Radicioni A, Lenzi A, Spaziani M, Anzuini A, Ruga G, Papi G, et al. A multicenter evaluation of immunoassays for follicle-stimulating hormone, luteinizing hormone and testosterone: concordance, imprecision and reference values. J Endocrinol Invest. 2013; 36:739–744. PMID: 24196213.
11. Tanner MJ, Hadlow NC, Wardrop R. Variation of female prolactin levels with menopausal status and phase of menstrual cycle. Aust N Z J Obstet Gynaecol. 2011; 51:321–324. PMID: 21806583.
Fig. 1

Distribution of prolactin in the examined population. Prolactin was determined in apparently healthy male (N=220) and female subjects (N=329; 139 in the follicular phase, 87 in the luteal phase, and 103 postmenopausal). Box-Whisker plots show the distribution of prolactin values as measured with the Advia Centaur (Siemens Healthcare) or Immulite 2000XP (Siemens Healthcare) platforms. Middle lines represent medians. The central box represents the values from the lower to upper quartile. Outliers were identified and disregarded as indicated in the text. Significances were calculated with the Mann-Whitney test.

alm-36-55-g001
Table 1

Reference intervals for sex hormones determined with the Advia Centaur system

alm-36-55-i001
Follitropin (mU/mL) Lutropin (mU/mL) Estradiol (pg/mL) Progesterone (ng/mL) Prolactin (ng/mL)
Median Lower limit Upper limit Median Lower limit Upper limit Median Lower limit Upper limit Median Lower limit Upper limit Median Lower limit Upper limit
Present study
 Male (N = 220) 3.30
3.11-3.62
1.32
1.20-1.46
9.18
8.33-10.1
3.81
3.59-4.00
1.83
1.70-1.96
7.65
7.13-8.22
21.1
20.2-23.1
- <41.33
7.3-45.6
0.42
0.39-0.45
- <0.86
0.76-1.04
6.5
5.90-6.90
2.73
2.50-2.97
15.1
14.1-16.7
 Follicular phase (N = 139) 7.58
7.05-7.80
4.07
3.77-4.31
12.9
12.1-14.0
5.00
4.50-5.52
2.18
1.97-2.41
10.6
9.59-11.7
38.1
35.0-41.3
- <82.7
72.0-106
0.47
0.43-0.58
<1.03
0.93-1.08
12.5
11.2-13.6
3.88
3.35-4.48
40.1
34.7-46.4
 Luteal phase (N = 87) 4.11
3.40-4.61
1.70
1.50-1.92
9.46
8.17-10.9
4.94
4.10-6.02
1.15
0.93-1.44
20.9
16.7-25.7
109
96.4-119
38.9
32.9-46.2
296
254-339
9.26
8.86-10.7
1.14
-
20.6
-
16.5
13.5-19.0
4.65
3.56-6.15
50.9
41.1-68.5
 Postmenopausal (N = 103) 87.1
79.6-91.1
44.6
40.3-49.8
167
150-185
32.6
29.6-35.3
18.0
16.4-19.8
64.2
58.7-70.7
9.50
-
- < 21.5
15.2-8.1
0.17
0.07-0.20
- <0.60
0.42-0.80
5.6
5.11-6.10
2.64
2.36-2.97
11.6
10.5-12.9
Manufacturer specifications
 Male 4.5
(N = 117)
1.4 18.1 2.8
(N = 59)
1.5 9.3 24.8
(N = 100)
- 39.8 0.54
(N = 80)
0.28 1.22 7.0
(N=139)
2.11 17.7
 Follicular phase 5.6
(N = 95)
2.5 10.2 4.4
(N = 119)
1.9 12.5 51.8
(N = 196)
19.5 144.2 0.43
(N = 47)
- alm-36-55-i003.jpg 9.6
(N = 202)
2.8 29.2
 Luteal phase 2.9
(N = 99)
1.5 9.1 2.8
(N = 105)
0.5 16.9 87.6
(N = 186)
55.8 214.2 12.74
(N = 84)
3.34
 Postmenopausal 64.3
(N = 72)
23 116 29.7
(N = 35)
15.9 54 -
(N=60)
- < 32.2 0.27
(N = 46)
- 0.73 6.9
(N = 104)
1.8 20.3

*Reference intervals are presented as 2.5th to 97.5th percentiles. The numbers below the lower or upper limits represent the respective 90% confidence intervals.

Table 2

Reference intervals for sex hormones determined with the Immulite 2000XP system

alm-36-55-i002
Follitropin (mU/mL) Lutropin (mU/mL) Estradiol (pg/mL) Progesterone (ng/mL) Prolactin (ng/mL)
Median Lower limit Upper limit Median Lower limit Upper limit Median Lower limit Upper limit Median Lower limit Upper limit Median Lower limit Upper limit
Present study
 Male (N = 220) 3.49
3.19-3.91
1.23
1.11-1.37
10.5
9.46-11.7
3.54
3.21-3.72
1.56
1.45-1.69
7.37
6.83-7.95
10.2
10.0-10.5
- <47.2
37.5-46.9
0.44
0.43-0.47
- <0.82
0.76-0.93
6.22
5.74-6.85
2.35
2.14-2.58
15.7
14.3-17.2
 Follicular phase (N = 139) 7.58
7.20-7.96
3.75
3.43-4.06
14.2
13.0-15.4
5.00
4.52-5.47
1.93
1.71-2.20
9.40
8.42-11.9
34.7
31.6-37.4
- <97.1
71.9-126
0.46
0.42-0.52
<0.97
0.86-1.01
12.7
11.5-13.7
3.72
3.21-4.33
42.1
36.2-48.7
 Luteal phase (N = 87) 4.07
3.40-4.71
1.66
1.46-1.88
9.59
8.26-11.1
4.12
3.40-4.72
1.67
1.47-1.90
9.65
8.32-11.1
102
87.1-114
31.9
26.7-39.0
307
260-361
8.01
6.78-8.74
0.55
-
17.5
-
15.9
13.6-17.1
4.65
3.61-6.12
49.5
38.4-63.12
 Postmenopausal (N = 103) 76.2
70.7-83.7
39.3
35.6-43.6
159
142-175
26.6
24.1-30.1
14.4
13.0-15.9
53.8
49.1-59.1
10.0
-
- <31.1
27.4-35.5
0.1
-
- <0.41
0.30-0.55
5.42
4.91-6.20
2.18
1.87-2.56
13.7
11.7-15.8
Manufacturer specifications
 Male 3.8
(N = 135)
0.7 11.1 2.4
(N = 135)
0.8 7.6 29.7
(N = 50)
- < 56.0 0.52
(N = 63)
0.27 0.90 6.2
(N = 19)
2.5 17.0
 Follicular phase 6.2
(N = 762)
2.8 11.3 4.6
(N = 762)
1.1 11.6 42
(N = 702)
- < 160 0.47
(N = 382)
- alm-36-55-i004.jpg
 Luteal phase 3.4
(N = 602)
1.2 9.0 4.3
(N = 658)
- 14.7 93
(N = 604)
27.0 246 8.9
(N = 323)
0.27 9.4
(N = 115)
1.9 25
 Postmenopausal 90.5
(N = 76)
21.7 153 24.9
(N = 75)
11.3 39.8 0 - < 30 0.36
(N = 34)
-

*Reference intervals are presented as 2.5th to 97.5th percentiles. The numbers below the lower or upper limits represent the respective 90% confidence intervals.

TOOLS
Similar articles