

 PDF
PDF ePub
ePub Citation
 Print
Print


INTRODUCTION
The classic Philadelphia chromosome-negative (Ph-) myeloproliferative neoplasms (MPNs) include polycythemia vera (PV), essential thrombocythemia (ET), and primary myelofibrosis (PMF). In 2005, Janus kinase 2 (JAK2) V617F mutations were detected in 95%, 50%, and 60% of PV, ET, and PMF patients, respectively [1]. A few patients carry other JAK2 mutations, such as insertions or deletions in exon 12 or mutations in the thrombopoietin receptor (MPL). Approximately 40% of ET and PMF patients lack a reliable genetic marker of disease [2]. At the end of 2013, recurrent mutations in the calreticulin (CALR) gene were identified in two studies using whole-exome sequencing [34]. These studies identified recurrent mutations in CALR in 60-88% of patients with ET and PMF who were negative for JAK2 and MPL mutations. CALR mutations were not found in healthy control subjects or in cases of lymphoid neoplasia, acute leukemia, or solid tumors, indicating specificity for ET and PMF [34]. All CALR mutations are insertions or deletions in exon 9, and the most common mutations, accounting for 80-90% of mutation cases, were either type 1, a 52-bp deletion (c.1092_1143del; p.L367fs*46), or type 2, a 5-bp insertion (c.1154_1155insTTGTC, pK385fs*47). Other infrequent mutations in exon 9 account for up to 15% of CALR mutations [2]. All known recurrent CALR mutations lead to a frameshift that generates a common 36 amino acid C-terminal end, and to the loss of the KDEL motif. The distribution of CALR mutation types differs according to the MPN type [5].
In most previous reports, CALR mutations were analyzed by Sanger sequencing [3467]. However, this sequencing method is time-consuming and cannot be performed in every laboratory. Here, we present a convenient system for screening major CALR mutations that does not require sequencing analysis. We investigated the efficiency of the screening PCR to detect CALR mutations in the Korean patients with thrombocytosis and compared the results with those from Sanger sequencing, the reference method, and fragment analysis, a sensitive detection method.
METHODS
1. Patient selection
Eighty-one patients with thrombocytosis who underwent a bone marrow (BM) study at Gachon University Gil Medical Center in Korea from April 2007 to February 2015 were enrolled in this retrospective study. BM samples were obtained from patients at diagnosis (81 samples) or in a follow-up visit (2 samples). The patients included 54 with ET; three with PMF; three with myelodysplastic neoplasms (MDNs) or MPNs, unclassifiable (MDS/MPN, U); two with MPNs, unclassifiable (MPN, U); one with hypereosinophilic syndrome (HES); and 20 that were benign disease cases. The clinical and laboratory data were obtained from medical records. This study was approved by our institutional review board (GCIRB2015-73), and informed consent was obtained from all enrolled patients at that time of BM study.
2. Patient characteristics
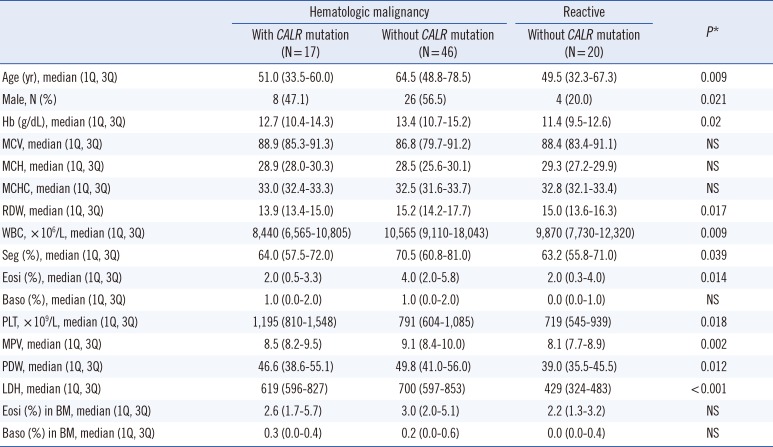
We compared the laboratory data of patients according to disease and CALR mutation status. Statistical differences in age, sex, hemoglobin levels, red cell distribution width (RDW), white blood cell count, percent segmented neutrophils, percent eosinophils, platelet count, mean platelet volume (MPV), platelet distribution width (PDW), and lactose dehydrogenase (LDH) level were observed among the patient groups. These results are shown in Table 1.
3. Detection of JAK2 V617F by PCR
DNA from the BM aspirates was isolated by using a QIAamp DNA Blood Mini Kit (Qiagen, Valencia, CA, USA). A Seeplex JAK2 Genotyping kit (Seegene, Seoul, Korea) or Real-Q JAK2 V617F Detection kit (BioSewoom, Seoul, Korea) was used to detect JAK2 V617F mutations.
4. Screening PCR
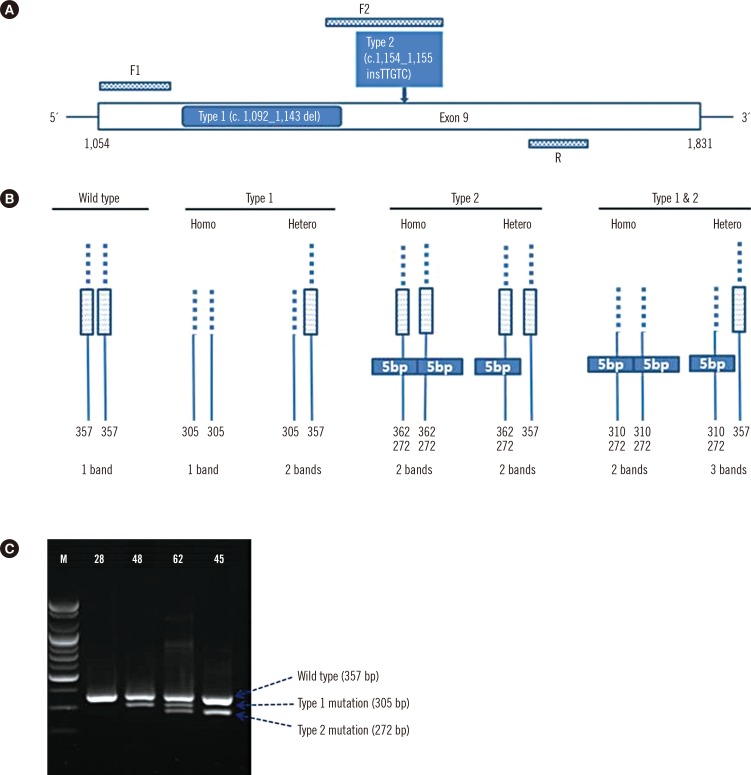
For analysis of CALR mutations, oligonucleotide primers targeting exon 9 of CALR were used to amplify the mutation hot spot. PCR primer sets were designed to detect type 1 and type 2 mutations in one reaction, including primers F1 (forward primer 1) 5'-GCA GCA GAG AAA CAA ATG AAG G-3', F2 (forward primer 2) 5'-GCA GAG GAC AAT TGT CGG A-3', and R (reverse primer) 5'-AGA GTG GAG GAG GGG AAC AA-3' (Fig. 1A, B). Ten nanograms of DNA template, 0.5 µL (10 pmol) of each forward primer, and 1.0 µL (10 pmol) of the reverse primer were added to the PCR premix (20 µL, final volume) (Bioneer, Daejeon, Korea). An initial preheating at 94℃ for 10 min was followed by denaturation at 94℃ for 30 sec, annealing at 64℃ for 30 sec, and extension at 72℃ for 30 sec for 40 cycles followed by a final extension at 72℃ for 7 min. After PCR amplification, gel electrophoresis was performed in a 2% agarose gel at 130 V for 30 min to detect the amplified regions of DNA, and agarose gels were exposed under UV light in a Bio-Rad Gel DOC EZ imager (Bio-Rad, Hercules, CA, USA) (Fig. 1C). Interpretation was done by comparing bands to the expected product size (wild type CALR: 357 bp, CALR type 1 mutation: 302 bp, and CALR type 2 mutation: 272 bp).
5. Sensitivity of screening PCR in detecting CALR type 1 and type 2 mutations
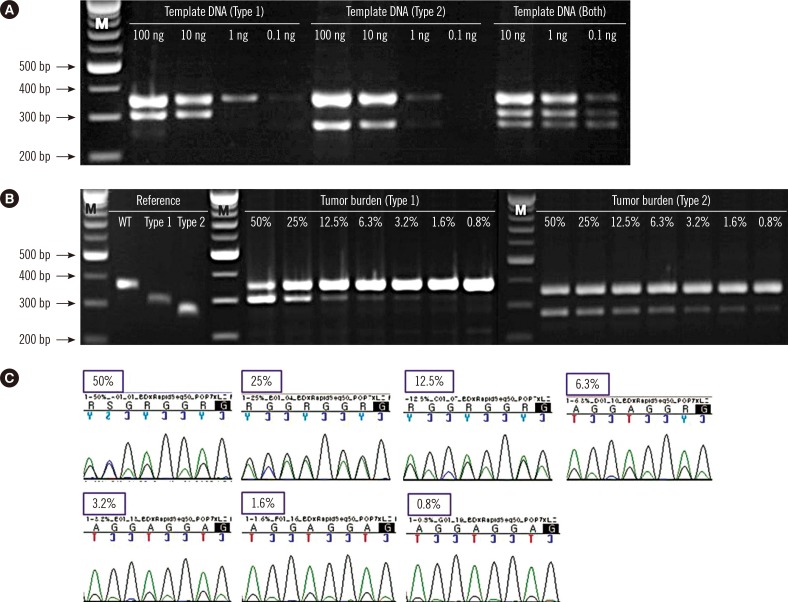
To study the limit of detection (LoD) of the screening PCR, patient BM DNA carrying CALR type 1 (No. 48) and type 2 (No. 45) were serially diluted in different concentrations (100 ng, 10 ng, 1 ng, and 0.1 ng). In the case of both mutations (No. 62), three concentrations were tested (10 ng, 1 ng, and 0.1 ng) owing to lack of sample quantity. To determine the assay sensitivity according to tumor burden, the reference sequences for wild-type CALR and type 1 and type 2 CALR mutants were obtained by gel extraction (GeneAll, Seoul, Korea) from PCR products. The weight of DNA to copy number was calculated (http://scienceprimer.com/copy-number-calculator-for-realtime-pcr), and the samples were diluted to the same copy number with different tumor burdens (50% mutant, 25% mutant, 12.5% mutant, 6.3% mutant, 3.2% mutant, 1.6% mutant, and 0.8% mutant). Type 1 mixtures were analyzed by Sanger sequencing for a comparison of assay sensitivity.
6. Sanger sequencing
Ten nanograms of DNA template and 1.0 µL (10 pmol) each of primers F1 and R were added to the PCR premix (20 µL final volume) (Bioneer). PCR was performed according to the conditions described above, and then PCR products were purified and sequenced by using the reverse primer and a BigDye Terminator v3.1 Cycle Sequencing kit (Applied Biosystems, Foster City, CA, USA) on an ABI 3500XL Genetic Analyzer (Applied Biosystems).
7. Fragment analysis
For the fragment analysis, PCR was carried out with 6-FAM-labeled F1 and R primers. PCR products were analyzed by capillary electrophoresis on an ABI 3500XL Genetic Analyzer (Applied Biosystems), followed by fragment analysis using GeneMapper Software 4.1 (Applied Biosystems).
8. Statistical analysis
Sensitivity, specificity, positive predictive value and negative predictive value were calculated by MedCalc software (https://www.medcalc.org/calc/diagnostic_test.php). Kruskal–Wallis test was used for the analysis of continuous variables, and Fisher's exact test was used for the analysis of categorical variables. P<0.05 was considered statistically significant. Agreement between results of the detection methods was assessed by using the Kappa statistic (Cohen's kappa coefficient [κ]: <0=poor, 0-0.2=slight, 0.21-0.4=fair, 0.41-0.6=moderate, 0.61-0.8=substantial, and 0.81-1=almost perfect) [8]. The SPSS 17.0 (SPSS Inc., Chicago, IL, USA) statistical program was used for all calculations.
RESULTS
1. Comparison of laboratory findings and CALR mutation status in patients with hematologic malignancies and reactive condition
Among the patients with thrombocytosis, CALR mutations were detected in 17 samples by Sanger sequencing; however, no CALR mutations were detected in patients with reactive condition.
2. Sensitivity of screening PCR in detecting CALR type 1 and type 2 mutations
The LoD of the multiplex screening PCR was estimated by determining the minimal genomic DNA required for generation of all of the expected bands. We first evaluated the ability of the screening PCR to detect each mutation type with different quantities of template in three patient samples (type 1: No. 48; type 2: No. 45; and both types: No. 62). The minimal quantity of template genomic DNA required for the reaction was approximately 10 ng to detect type 1 mutation, 1 ng for type 2 mutation, and <0.1 ng for both mutations (Fig. 2A). The sensitivity of the screening PCR was estimated by the minimal tumor burden required for all of the expected bands to be present. The screening PCR detected CALR type 1 and type 2 mutants with a maximal sensitivity of 3.2% and <0.8%, respectively (Fig. 2B), whereas the sensitivity of Sanger sequencing in detecting type 1 mutation was 6.3% (Fig. 2C). All sensitivity tests were performed with duplicate samples.
3. Comparison of Sanger sequencing, screening PCR, and fragment analysis for mutation detection
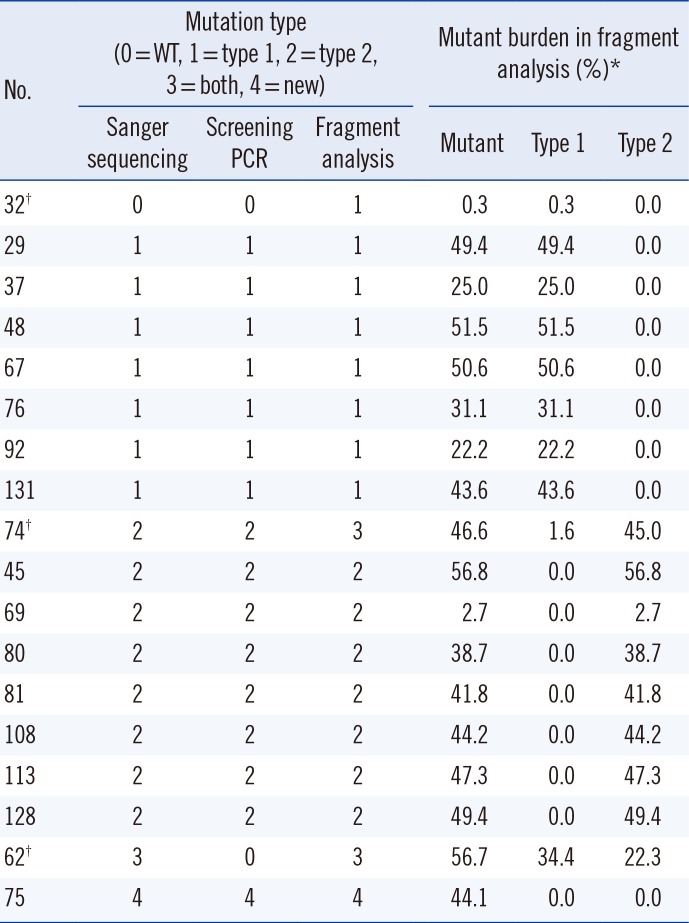
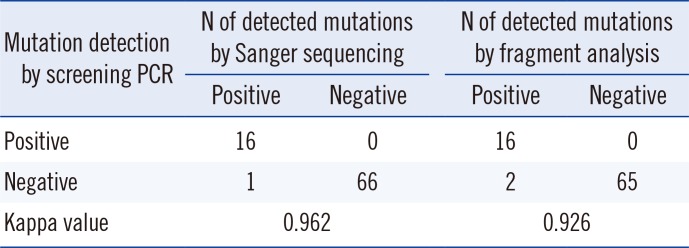
With Sanger sequencing, the three types of CALR mutations, type 1, type 2, and a novel mutation (c.1123_1132delinsTGC), were detected in 16 ET patients and one PMF patient. Type 2 mutation was the most common (9/17, 53.0%), followed by the type 1 mutation (6/17, 35.3%), and then type 1 and type 2 (1/17, 5.9%) and the novel mutation (1/17, 5.9%). The screening PCR resulted in products of different sizes depending on the mutation type (Fig. 1C). The screening PCR detected 94.1% (16/17) of mutations, and this method showed results concordant with Sanger sequencing in the cases of type 1 and type 2 mutations. However, one novel mutation was not detected in the screening PCR. Two patients (No. 32 and No. 74) showed discrepant results between the fragment analysis and the sequencing analysis and screening PCR. These samples had very low type 1 mutation burdens (0.3% and 1.6%) (Table 2). After 10-fold dilution of the PCR products from the patients No. 32 and No. 74, nested PCR was performed with same primers, and type 1 mutations were detected in the second PCR products. Almost perfect agreement between the screening PCR and the other methods was observed for CALR mutation detection (κ=0.962, Sanger sequencing and κ=0.926, fragment analysis) (Table 3). The screening PCR, relative to sequencing, showed 94.1% sensitivity (95% confidence intervals [CI]: 71.3-99.9%), 100.0% specificity (95% CI: 94.6-100.0%), 100.0% positive predictive value (95% CI: 79.4-100.0%), and 98.5% negative predictive value (95% CI: 92.0-100.0%). The screening PCR showed 88.9% sensitivity (95% CI: 65.3-98.6%), 100.0% specificity (94.5-100.0%), 100.0% positive predictive value (95% CI: 79.4-100.0%), and 97.0% negative predictive value (95% CI: 89.6-99.6%) compared with the fragment analysis results. All mutations, including the novel mutation, resulted in a common +1 bp altered reading frame and induced a novel C-terminal peptide sequence lacking the KDEL motif.
4. Frequency of mutations and clinical characteristics in different patient groups
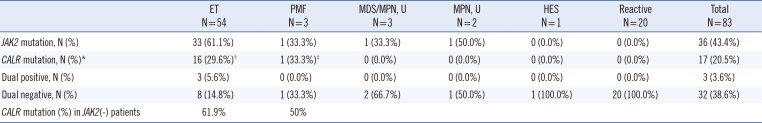
By sequencing, CALR mutations in malignancy group were detected in 17 samples (17/63, 27.0%). The CALR mutational frequencies in each disease subtype were 29.6% (16/54) for ET and 33.3% (1/3) for PMF (Table 4). In patients without JAK2 V617F mutations, the CALR mutational frequency was 61.9% (13/21) for ET and 50% (1/2) for PMF. Three ET patients had both CALR and JAK2 V617F mutations. The prevalence of dual negative (negative for both CALR and JAK2 V617F mutations) patients was 14.8% (8/54) in ET and 33.3% (1/3) for PMF patients.
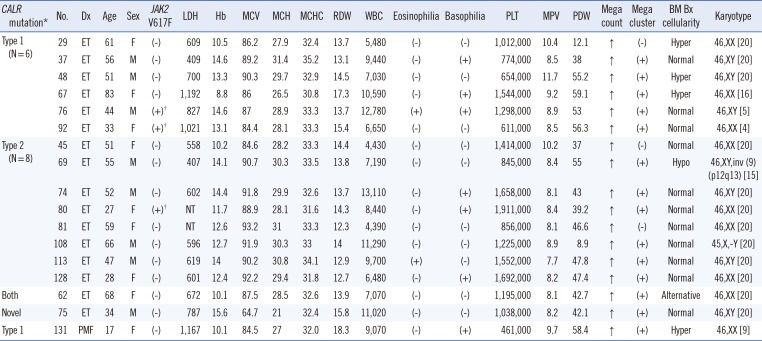
In the ET group, mutational frequencies were 61.1% for JAK2 V617F, 29.6% for CALR, 5.6% for dual positive, and 14.8% for dual negative mutations. Among ET patients without JAK2 V617F, the frequency of CALR mutation was 61.9% (13/21). The frequency of type 2 CALR mutation (8/16, 50.0%) was higher than that of type 1 mutation (6/16, 37.5%). Interestingly, one patient with both mutations (1/16, 6.3%) was identified, and the novel mutation (c.1123_1132delinsTGC) was detected only by Sanger sequencing. No CALR or JAK2 V617F mutation was detected in the reactive disease group. Laboratory findings in patients with CALR mutations are summarized in Table 5.
5. Follow-up samples
Follow-up samples from two patients were included in the study. One patient had shown mild thrombocytopenia since 2002, and the first BM study was performed in April 2007. A BM biopsy showed normal cellularity with increased megakaryocytes. Reactive disease could not be ruled out, but the first BM study did not test for the JAK2 V617F mutation. Anagrelide (2 mg/day) was given because the thrombocytosis persisted even after using hydroxyurea. Another BM study was conducted in November 2011, and the JAK2 V617F mutation was detected; however, no CALR mutations were detected. At that time, the first BM sample was tested for JAK2 V617F and CALR mutations, and the JAK2 V617F mutation was detected.
Another patient (No. 80) was 20 weeks pregnant at the time of sample collection. Thrombocytosis was detected during a regular checkup, and a BM study was performed. The BM was normocellular with an elevated megakaryocyte count. The JAK2 V617F mutation was not found. Even though the physician highly suspected ET, the patient refused BM suppression therapy and took 100 mg aspirin a day. In March 2012, another BM study was performed because of persistent thrombocytosis after childbirth. BM findings did not change from those of the previous study. However, mutations were detected in the follow-up sample, even though neither JAK2 V617F nor CALR mutation was detected in the first BM study. The patient started taking anagrelide (2 mg/day).
DISCUSSION
Detection of CALR mutations in JAK2 V617F-negative ET and PMF patients has been helpful in diagnosing and predicting the prognosis of patients with previously difficult-to-characterize disease [4]. CALR mutations have been associated with longer survival times in PMF cases [9]. Several reports have also suggested that patients with CALR mutations have a lower incidence of thrombosis and hematologic progression than those with the JAK2 V617F mutation [2610].
In many studies, CALR mutational analysis was performed by PCR followed by Sanger sequencing [341112]. Some researchers have reported the use of other methods, such as targeted next generation sequencing (NGS) [13], fragment analysis [14], and high-resolution melting analysis (HRMA) [1516]. Sanger sequencing showed a sensitivity of 10% in CALR type 1 and type 2 mutations; it was less sensitive in samples with a low mutant allele burden [17]. The maximal reported sensitivity of HRMA in the detection of both CALR type 1 and type 2 mutations was 2.5% [17]. Jones et al. [13] who tested several methods for the detection of CALR mutations found that the most sensitive method was targeted NGS, which detected mutations down to a 1.25% mutant burden, followed by HRMA at 5%, fragment analysis at 5-10%, and Sanger sequencing at 10-25%. Methods for the detection of acquired mutations within hematologic malignancies showed a range of sensitivities. Here, we showed that our screening PCR can detect type 1 and type 2 mutations in the CALR gene, since the differential product sizes can be used to discriminate mutants from wild-type alleles.
The screening PCR detected CALR type 1 and type 2 mutants with a maximal sensitivity of 3.2% and <0.8%, respectively, compared with the higher sensitivities obtained by Sanger sequencing (6.3%, type 1 mutation). Because a specific primer for the detection of the type 2 mutation was used in the screening PCR, this system showed higher sensitivity in detecting the type 2 mutation than the type 1 mutation. In this study, the fragment analysis showed greater sensitivity in detecting the type 1 mutation (No. 32 and No. 74) than either Sanger sequencing or the screening PCR (Table 2). The fragment analysis identified two samples with low type 1 mutant burden (0.3% in No. 32 and 1.6% in No. 74); however, these mutations were not detected by using the other methods. Based on our results, maximal sensitivity in detecting the type 1 mutation was 6.3% by Sanger sequencing, 3.2% by the screening PCR, and <1% by the fragment analysis. The tumor burden of the two samples was too low to detect using Sanger sequencing and the screening PCR. This showed that the screening PCR could result in false negatives in cases with low allele burdens of CALR mutations. However, no false positive was detected in our screening PCR. Another limitation of the screening PCR is that it cannot detect a single nucleotide substitution or small deletion/insertion like the novel mutation found in one case in this study; however, the frequency of these mutations is rare. Therefore, this screening PCR would be useful as a screening test to detect the major CALR mutations in laboratories without sequencing equipment.
CALR mutations induce a frameshift through exon 9 deletions or insertions; type 1 and type 2 mutations constitute more than 80% of these mutations [18]. According to a previous report, at least 36 different indels account for the remaining variants [413]. In this study, the frequency of CALR mutations, except for type 1 and type 2 mutations, was markedly low, probably owing to the small sample size. The majority of CALR mutations are believed to be heterozygous [4], and all mutations detected in the current study were also heterozygous. The prognostic value or clinical characteristics of zygosity have not yet been studied.
Other researchers have reported a slightly higher frequency of type 1 than type 2 mutation in the ET group (type 1: 45% vs. type 2: 39% [18] and type 1: 53.6% vs. type 2: 32.1% [12]). In this study, the frequency of the type 2 mutation (9/16, 56.3%) in ET patients was higher than that of type 1 (6/16, 37.5%). The small sample size of our study may have affected the discordant result with previous reports. CALR mutations in ET are generally associated with patients of a younger age, male sex, higher platelet count, lower hemoglobin levels, lower leukocyte counts, and lower incidence of thrombotic events. Tefferi et al. [91819] reported that male sex was associated with only type 1 mutations, and that younger age and higher platelet counts were associated with type 2 mutations. Because of the small sample size, a statistical analysis of CALR-associated phenotypes was not performed for other disease groups.
Although JAK2 and CALR mutations are considered mutually exclusive in patients with ET and PMF, co-expression of these mutations has been identified in a patient with PMF [20] and a patient with ET [21]. In the current study, two ET patients (No. 76 and No. 92) had co-existent JAK2 V617F and type 1 CALR mutations. In another ET patient (No. 80), JAK2 V617F and type 2 CALR mutations were detected in follow-up BM samples. These findings provide additional exceptions to the rule of mutual exclusiveness of JAK2 and CALR mutations. We suggest that an evaluation of CALR mutations be performed in ET patients with JAK2 mutations and during follow-up studies. Interestingly, one ET patient (No. 62) had both type 1 and type 2 CALR mutations. This is the first such a case reported in an MPN patient.
In conclusion, the dual negative rate (JAK2 V617F and CALR) was 14.8% in our ET group. In other words, approximately 85% of ET patients were diagnosed by these markers with demonstrated clonality. Our screening PCR is a rapid, sensitive, easy-to-use, and cost-effective method to screen major CALR mutations. We recommend using this rapid screening PCR for the identification of major CALR mutations in suspected MPN patients initially, and then, in the case of a negative result, using a more sensitive method for confirmation.
 XML Download