

 PDF
PDF ePub
ePub Citation
 Print
Print


INTRODUCTION
Middle East respiratory syndrome coronavirus (MERS-CoV) is a novel human pathogen associated with severe respiratory illness and was first detected in Saudi Arabia in 2012 [12]. The confirmatory MERS-CoV test recommended by WHO is based on the real-time reverse transcriptase-PCR (rRT-PCR) of two different targets—an upstream region of the envelope gene (upE; the first-line screening) and a region within the open reading frame (ORF)1a—plus sequencing of the nucleocapsid (N) gene or the RNA-dependent RNA polymerase (RdRP) gene for confirmation [345].
The first case of MERS-CoV infection in Korea was identified recently, in a 68-yr-old man who had travelled to the Middle East two weeks prior to his diagnosis [6]. Subsequently, 185 Koreans were infected during a four-week period through contact in hospital or in the household environment [7]. This was the largest outbreak of MERS-CoV infections outside Middle East Asia, and necessitated the rapid expansion of laboratories to conduct MERS-CoV testing in a short period, as well as the use of assays that had not been approved for diagnostic purposes. Therefore, an urgent external quality assessment (EQA) was proposed in order to assess the quality of the assays used.
Here, we report our experience in EQA carried out during this MERS-CoV outbreak.
METHODS
Owing to the rapid introduction of molecular diagnostics for MERS-CoV, the EQA program consisted of two phases. In the first phase, the participants performed a self-validation of their methods using known concentrations of distributed viral material; in the second phase, the participants performed a blind assessment using unknown concentrations of the distributed viral material.
1. Participants
Information regarding the MERS-CoV EQA was sent to all institutional members of the Korean Society of Laboratory Medicine. Applications were received via the Korean Society of Laboratory Medicine and the Korean Hospital Association. In total, the number of laboratories that participated in the two phases of this EQA from June 12 2015 to July 10 2015 was 51 and 53, respectively.
2. Specimen preparation
For the first EQA phase, in vitro transcribed upE and ORF1a RNAs, provided by the University of Bonn Medical Center, Germany, were used at a concentration of 1,000 copies/µL. The test panel for the second EQA phase consisted of RNA extracts from three samples (Sample A, B, and C), two from MERS-CoV-positive patients (representing high positive and low positive levels), and one from a patient who was MERS-CoV-negative. All materials were assayed by using a rRT-PCR test for MERS-CoV RNA as previously described [34]. Briefly, a 25-µL reaction was prepared with 5 µL of RNA, 1 µL of each primer, 0.5 µL of probe, 1 µL of enzyme mix, and 12.5 µL of 2× RT-PCR buffer. Reverse transcription was done at 55℃ for 20 min, and PCR cycling conditions were 94℃ for 3 min followed by 45 cycles of 94℃ for 15 sec, 58℃ for 30 sec. The EQA samples were shipped frozen on dry ice by a specialist courier. The following information was collected from the participants: assay kit and platform used, cut-off CT value, and the results for each material.
RESULTS
The first EQA materials were distributed to 51 laboratories and 46 results were returned (78.4% response rate), and the second EQA materials were distributed to 53 laboratories and 47 results were returned (88.6% response rate). Most of the participants used commercial rRT-PCR kits; of these, PowerChek MERS Real-Time PCR kit (KogeneBiotech, Daejon, Korea) was the most common, followed by DiaPlexQ MERS Virus Detection kit (SolGent, Seoul, Korea), and AccuPower MERS-CoV Real-Time RT-PCR kit (Bioneer, Daejon, Korea) (Tables 1 and 2). Only two participants in the first phase and one participant in the second phase of EQA used in-house rRT-PCR methods. All participants reported both upE and ORF1a results in a semi-quantitative manner (CT value). Different cut-off values were employed, depending on the kit used: 39, 35, and 38 for AccuPower, PowerChek, and DiaPlexQ, respectively.
1. The first EQA phase
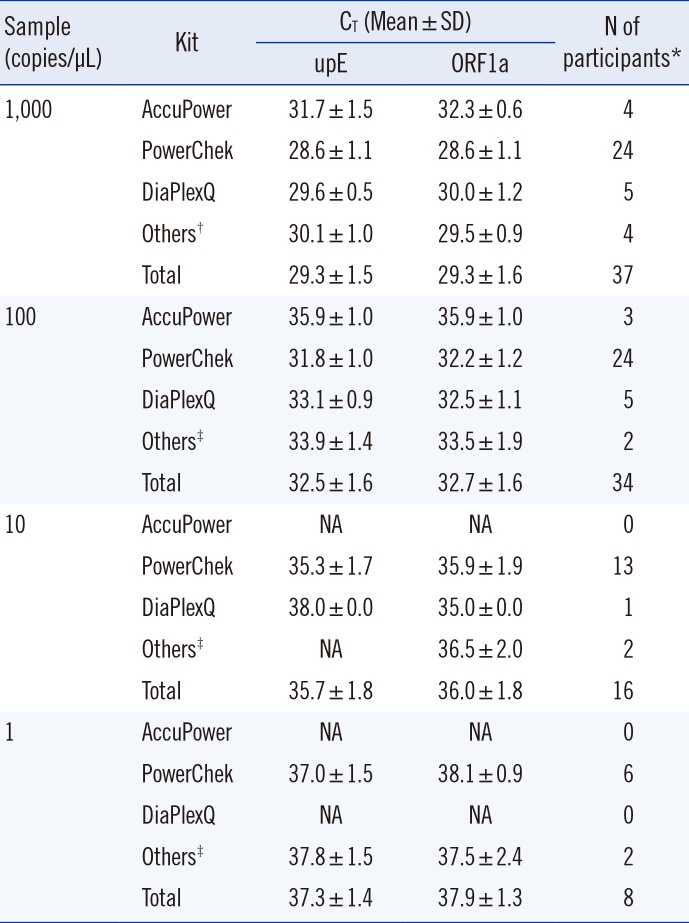
In the first phase of EQA, the participants performed a self-validation of their own protocols. The 46 participating laboratories used various concentrations, such as 1,000, 100, 10, and 1 copies/µL. Of these, we excluded validation results at 2×10² copies/µL for convenience of interpretation, and thus used only 43 self-validation results in the final analysis.
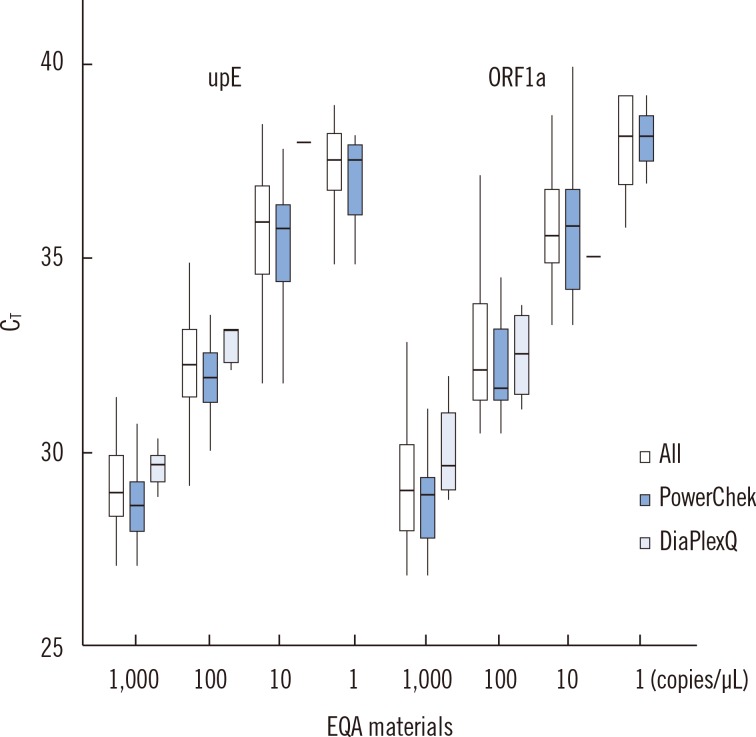
The results of first phase EQA are summarized in Table 1. The mean CT value for each concentration was different, depending on the commercial kit. Among the three commonly used kits, PowerChek showed the lowest CT values for all concentrations of upE and for most concentrations of ORF1a. The difference in CT values between PowerChek and non-PowerChek kits was significant for upE at concentrations ranging from 1,000 to 10 copies/µL (P=0.0003, 0.0002, and 0.0393, respectively). However, in the case of ORF1a, it was significant only at 1,000 and 100 copies/µL but not at 10 copies/µL (P=0.0007, 0.0263, and 1.0000, respectively).
The CT values of RNAs had a linear relationship with the logarithmic concentrations for both upE and ORF1a in a boxplot (Fig. 1) (R2=0.73 and 0.75, respectively). A linear relationship was also observed for the two common commercial kits, PowerChek and DiaPlexQ: R2=0.83 and 0.91 for upE; R2=0.86 and 0.71 for ORF1a, respectively.
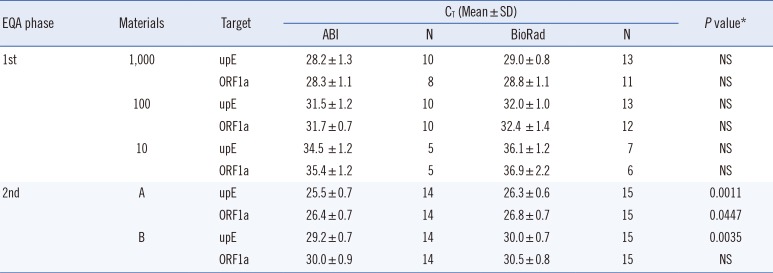
Among the results obtained using the PowerChek kit, CT values from the ABI 7500 system (Applied Biosystems, Forster City, CA, USA) showed a tendency to be lower than those from BioRad CFX96 (Bio-Rad, Carlsbad, CA, USA), across concentrations, but were not statistically significant (Table 3). In addition, the CT values of upE were mostly lower than those of ORF1a, but these were also not statistically significant (Table 3).
2. The second EQA phase
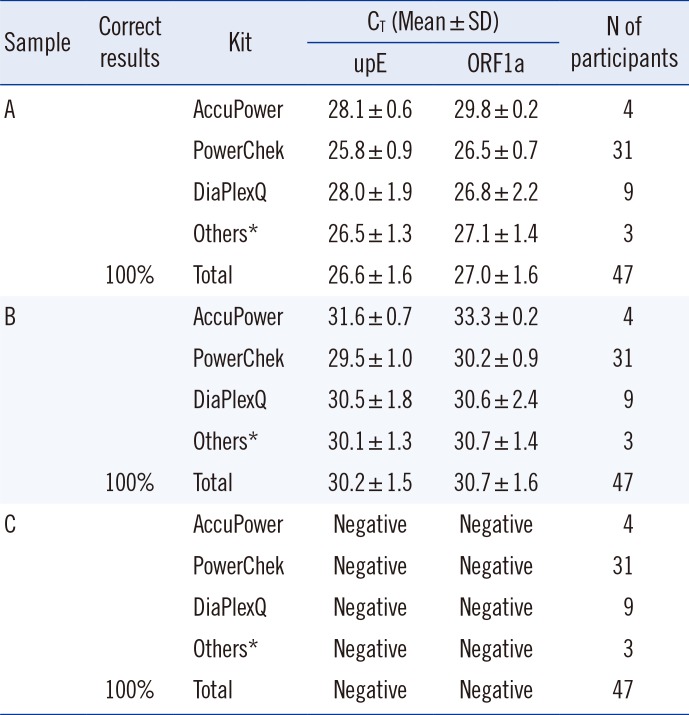
In the second phase EQA, panel results for 47 participants were 100% correct for all three samples tested (Table 2). The difference in mean CT values between commercial kits in the second EQA phase was similar to that for the first EQA phase. The PowerChek kit showed the lowest CT values for upE and ORF1a, and these differences were statistically significant except for ORF1a in sample A (Sample A: P<0.0001 and P=0.0527 for upE and ORF1a, respectively; sample B: P<0.0001 and P=0.0486 for upE and ORF1a, respectively).
We analyzed the effect of real-time platform on the study results. Among the results obtained using the PowerChek kit, CT values from the ABI 7500 system were found to be lower than those from BioRad CFX96 in the two MERS-CoV-positive samples (Table 3). These differences were statistically significant except for ORF1a in sample B.
The CT values of upE were also found to be lower than those of ORF1a in the two MERS-CoV-positive samples in the second EQA phase, but were not statistically significant (P=0.1742 and 0.1552, respectively).
DISCUSSION
Recently, an international EQA of molecular diagnostics for MERS-CoV was conducted across 106 laboratories from six continents; this is the only published report on EQA of MERS-CoV testing [8]. To the best of our knowledge, this study is the first EQA of MERS-CoV testing conducted in an affected region during an outbreak worldwide. The Korean outbreak of 2015 was the largest outbreak of MERS-CoV infection outside Middle East Asia, which demanded a rapid expansion of MERS-CoV testing laboratories. Unapproved commercial kits for in vitro diagnostic use were introduced to clinical laboratories without formal validation as a diagnostic test, which raised an issue of their quality. In this study, more than 46 laboratories participated in EQA over two phases and showed overall good results. Nevertheless, our EQA scheme has some limitations. First, this scheme could not reflect important practical steps, such as sample preparation or nucleic acid extraction, because both in vitro transcribed RNA and extracted RNA were used for EQA. Second, for the first phase, the analytical validation was set by using the participants' own dilution scheme and there was no limitation on repeating the tests to obtain the final results. Therefore, not all laboratories provided results for all of the concentrations analyzed in this study, and some positive results for the lower concentrations could be from various test repeats. This means that the results from this EQA phase may be not suitable for inter-laboratory comparison. Third, the second phase assessment comprised only three samples, including one each of strong positive and weak positive, but did not include diverse concentrations especially on the lower end of the analytical sensitivity of rRT-PCR. Lastly, other coronaviruses, such as HCoV-NL63 or HCoV-229E, were not included in the assessment of the analytical specificity of the diagnostic assays.
In this survey, most participants used commercial rRT-PCR kits. Our results showed that significantly different CT values could be produced depending on the kit used. Though these kits are for semi-quantitative purposes and a difference in CT values does not correlate with differences in analytical sensitivity, a large difference in the CT values for the same material may influence the analytical sensitivity of the kit. Therefore, cut-off values should be carefully validated for each method in order to have optimal sensitivity for the detection of MERS-CoV in clinical settings. In addition, our study demonstrates that CT values might be different depending on the platform used for performing real-time PCR, even when using the same commercial kit. Therefore, the platform as well as the kit should be considered when establishing or validating the cut-off value of a kit.
It is known that the analytical sensitivity of MERS-CoV RT-PCR depends on the target gene tested; the ORF1a assay has a lower sensitivity compared with the upE assay [3]. In this survey, all participants reported both upE and ORF1a results. Both assays gave comparable results, and no significant difference between them was observed.
In summary, this EQA survey demonstrates that MERS-CoV molecular testing carried out in Korea during the 2015 outbreak was based on robust methods. However, careful establishment and validation of the cut-off value is recommended to ensure analytical sensitivity.
 XML Download