

 PDF
PDF ePub
ePub Citation
 Print
Print


INTRODUCTION
Angiogenesis, i.e., formation of new blood vessels, plays an important role in the proliferation and survival of neoplastic cells. Increased angiogenesis is an adverse prognostic factor in hematologic malignancies, including non-Hodgkin's lymphomas and acute B-cell lymphoblastic and myeloblastic leukemias, and solid tumors [123].
Multiple myeloma (MM) is the second most common hematologic malignancy in humans, accounting for 10-15% hematopoietic neoplasms and 20% deaths due to hematologic malignancies [45]. Prognostic factors in patients with MM include clinical symptoms, plasmacytosis, β2-microglobulin concentration, and plasma cell labeling index [67]. Microvessel density (MVD), which is determined by the immunohistochemical (IHC) staining of bone marrow (BM) biopsy samples [389], is a marker of angiogenesis and can be used as a prognostic indicator in patients with MM. Increased BM MVD is an indicator of shorter progression-free survival (PFS), overall survival (OS), and duration of complete remission (CR) in patients newly diagnosed with MM [91011].
Although several studies have assessed BM MVDs in Korean patients with MM, the association of MVD with patient survival and disease progression has not yet been clarified. This study investigated the prognostic impact of MVD in Korean patients newly diagnosed with MM.
METHODS
1. Study population
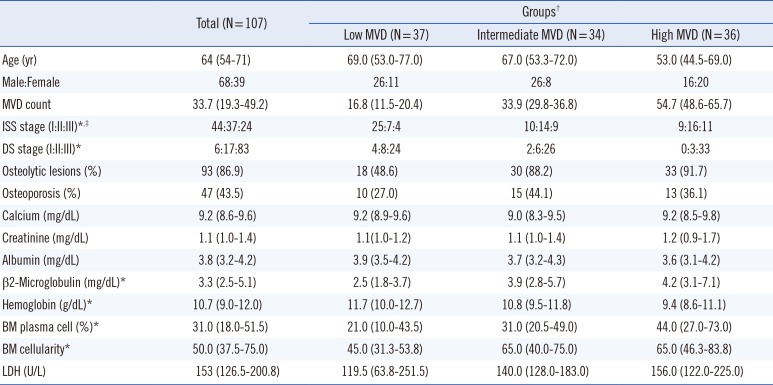
This retrospective analysis included 107 patients (median age of 64 yr) who were newly diagnosed with symptomatic MM through a comprehensive diagnostic workup at the National Cancer Center, Goyang, Korea, between December 2001 and April 2012 [12]. Their clinical and laboratory characteristics are listed in Table 1. BM biopsy was performed in all patients at initial diagnosis, and biopsied samples were used for quantifying MVD by staining with anti-CD34 antibody. All the patients had symptoms for end-organ damage and received intensive chemotherapy. Of the 107 patients, four patients were eligible for hematopoetic stem cell transplantation while 51 were not. Initial treatment regimens were diverse because of the retrospective nature of this study. In all, 21 patients received bortezomib-based regimens, 20 patients received melphalan-based regimens, and 35 patients received thalidomide-based regimens. Thirty-one patients underwent hematopoietic stem cell transplantation (HSCT), including three patients who underwent allogeneic transplantation. PFS was defined as the time from the start of first-line treatment to disease progression or death due to any cause [13], and OS was defined as the time from the start of chemotherapy to death due to any cause.
2. Decalcification and IHC staining of BM biopsy samples
The proportion of plasma cells and overall cellularity were estimated by using the biopsied BM samples. Paraffin-embedded samples were decalcified in 10% neutral-buffered formalin (Australian Biostain, Pty. Ltd., Traralgon, Australia) according to standard procedures. Thin-layer sections were prepared and were stained with hematoxylin and eosin (H&E) and antibodies against CD138, CD34, and immunoglobulin kappa and lambda light chains. IHC staining for CD34 was performed by using ultraView Universal DAB Detection Kit (Ventana Medical Systems Inc., Tucson, AZ, USA) on Ventana Benchmark XT platform, according to the manufacturer's instructions. The slides were immersed in citrate buffer and were boiled for 30 min in a microwave for antigen retrieval. The slides were then dewaxed, pretreated with a mild cell conditioning 1 buffer (CC1, Ventana Medical Systems Inc., Tucson, AZ, USA), incubated with 1:500 dilution of a primary antibody against CD34 (clone QBEnd10, Novocastra, Leica Biosystems, Newcastle upon Tyne, UK) for 32 min, counterstained, and mounted.
3. Calculation of MVD
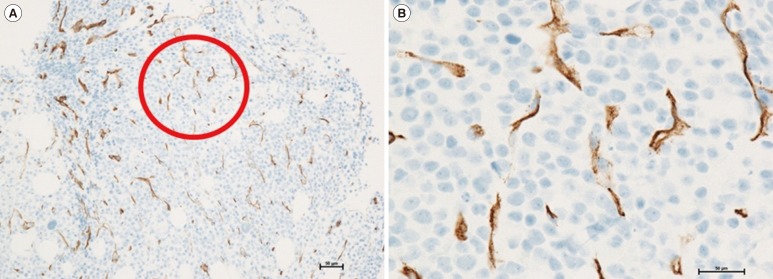
MVD was estimated manually by two independent hematopathologists in a blinded manner with a microscope (Zeiss, Jena, Germany), as described previously but with some modifications [14]. Briefly, slides were scanned at 100× magnification to identify areas showing conspicuously increased MVD (called 'hot spots'). Three hot spots were identified per patient, and stained vessels, including arterioles and venules, were counted in each hot spot at 400× magnification (area covered per spot, 0.24 mm2). Round CD34-positive cells showing distinct nuclei were considered hematopoietic precursors and were excluded from the analysis. Stained cells in the trabecular bone and periosteum were also excluded from the analysis. Finally, the numbers of vessels in the three hot spots were averaged (Fig. 1).
4. Statistical analysis
Correlation between MVDs determined by the two hematopathologists as well as correlations between MVDs and other prognostic factors, including anthropometric laboratory values, factors included in staging systems, and molecular parameters, assessed at diagnosis were evaluated by using a parametric method. To demonstrate the strength of the correlation value, we considered 0.10≤r<0.30 to weak correlation, 0.30≤r<0.50 to moderate correlation, and r≥0.05 to strong correlation, as previously guided [15]. Results of FISH for translocations involving IGH/FGFR3 (t[4;14]) and IGH/MAF (t[14;16]) and deletion of 17p13.1 (TP53/17q23; MPO) (Kreatech Diagnostics, Amsterdam, The Netherlands) were included in the analysis [16]. The patients were divided into three groups on the basis of tertiles of MVD. Cumulative PFS and OS curves for each group were calculated by using Kaplan-Meier method and were compared by using log-rank test. Prognostic impact of MVD on PFS and OS was assessed by using Cox proportional hazard model. Statistical significance was set at P<0.05. All statistical analyses were performed by using MedCalc for Windows, version 12.5 (MedCalc Software, Ostend, Belgium).
RESULTS
1. Calculation, subgrouping, and interindividual comparison of MVDs
Manual assessment of MVDs produced estimated mean (SD) of 39.2 (26.7) and 32.5 (18.2), respectively, with the two means differing significantly according to paired t-test (P=0.004). Mean (SD) MVD of the 107 patients with MM was 35.8 (19.7) (range, 3.7-95.7), and median MVD was 33.7 (range, 3.7-98.2). Patients were divided into three groups on the basis of tertiles of MVD, with low, intermediate, and high median MVDs being 16.8, 33.9, and 54.7, respectively. Clinical characteristics of patients in these groups are summarized in Table 1. Cytogenetic risk factors were analyzed by performing FISH. Analysis of del17p13.1, t(4,14), and t(14,16) was performed in 50, 67, and four patients, respectively. Results of this analysis showed that three of the 50 patients had del17, eight of the 67 patients had t(4,14), and one of the four patients had t(14,16).
Patients in the high MVD group had significantly higher mean serum β2-microglobulin concentration (P=0.013), plasma cell percentage (P=0.002), and cellularity (P<0.001) in the BM aspirates but significantly lower hemoglobin concentration (P=0.001) than patients in the low MVD group. In addition, patients in the high MVD group had higher cancer stage, as determined by the International Staging System (ISS) and Durie-Salmon (DS) staging, than patients in the low MVD group (Table 1).
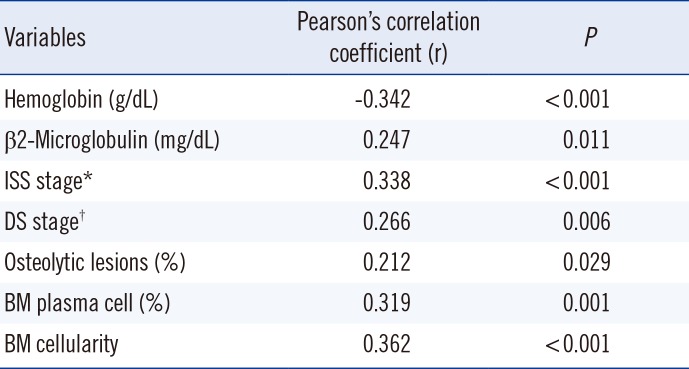
MVD showed moderate relationship with hemoglobin concentration (Pearson's correlation coefficient [r]=-0.342, P<0.001), weak relationship with β2-microglobulin concentration (r=0.247, P=0.011), moderate relationship with ISS stage (r=0.338, P<0.001), and moderate relationship with plasma cell percentage (r=0.319, P=0.001) in the BM aspirates. MVD was also moderately correlated with BM cellularity (r=0.362, P<0.001) and weakly correlated with DS stage (r=0.266, P=0.006), and osteolytic lesions (r=0.212, P=0.029) (Table 2).
2. Prognostic impact of MVD
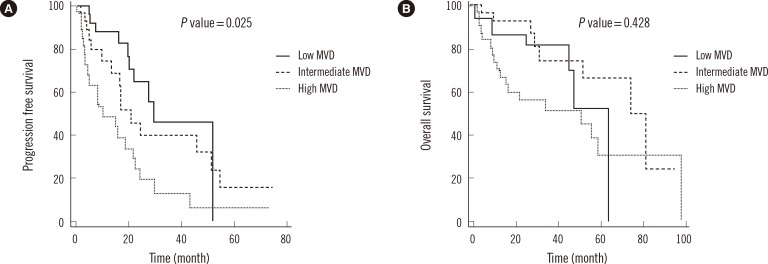
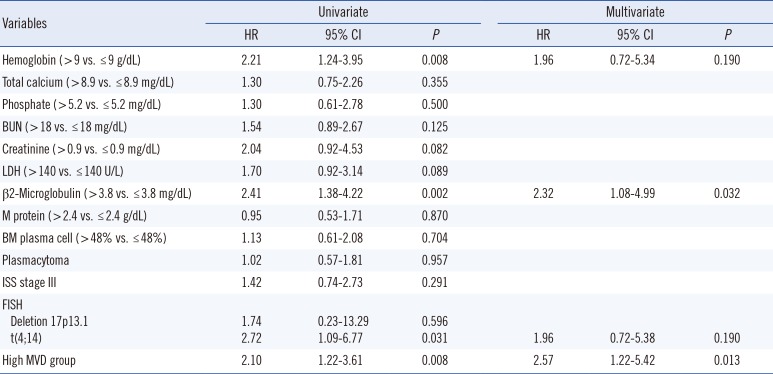
Association of prognostic parameters, including high MVD, with PFS and OS was determined by using optimal points as cutoff values on ROC curves. Cox univariate proportional hazards analysis showed that high MVD was significantly associated with PFS (hazard ratio [HR]=2.10; 95% CI, 1.22-3.61; P=0.008). Clinical markers such as decreased hemoglobin concentration (HR =2.21; 95% CI, 1.24-3.95; P=0.008), elevated β2-microglobulin concentration (HR=2.41; 95% CI, 1.38-4.22; P=0.002), and translocation of chromosome 4 to chromosome 14 (HR=2.72; 95%, CI 1.09-6.77; P=0.031) were significantly associated with decreased PFS. Multivariate analysis showed that only high MVD (HR=2.57; 95% CI, 1.22-5.42; P=0.013) and elevated β2-microglobulin concentration (HR=2.32; 95% CI, 1.08-4.99; P=0.032) were independent predictors of disease progression (Table 3). Patients with high MVD had significantly lower PFS (P=0.025) than patients with low and intermediate MVDs. Median PFS in low, intermediate, and high MVD groups was 29.6, 20.8, and 10.2 months, respectively (Fig. 2A).
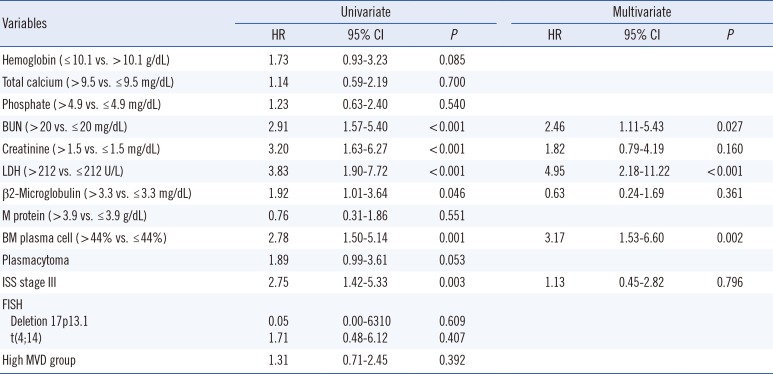
Univariate analysis showed that elevated β2-microglobulin (HR=1.92; 95% CI, 1.01-3.64; P=0.046) and lactate dehydrogenase (LDH) concentrations (HR=3.83; 95% CI, 1.90-7.72, P<0.001) were significantly associated with reduced OS. In addition, elevated blood urea nitrogen (BUN) (HR=2.91; 95% CI, 1.57-5.40; P<0.001), creatinine (HR=3.20; 95% CI, 1.63-6.27; P<0.001), percentage of plasma cells in the BM aspirate (HR=2.78; 95% CI, 1.50-5.14; P=0.001) and ISS stage III patients (HR=2.75; 95% CI, 1.42-5.33; P=0.003) were significantly associated with reduced OS. However, high MVD was not significantly associated with reduced OS (Table 4), with survival rates being similar in low, intermediate, and high MVD groups. Median OS was shorter in the high MVD group than in the low MVD group (50.6 vs. 65.3 months, P=0.428; Fig. 2B).
DISCUSSION
In this study, 107 patients who were newly diagnosed with MM and who received intensive chemotherapy were retrospectively analyzed to assess the impact of MVD on PFS and OS and the correlation between MVD and other clinical parameters of MM. The results showed that increased angiogenesis, as determined by MVD, was significantly associated with reduced PFS. Moreover, MVD was significantly correlated with the previously determined prognostic factors such as hemoglobin concentration, β2-microglobulin concentration, ISS stage, BM plasma cell percentage, and BM cellularity.
The present findings are similar to those of previous studies. In a study involving 110 patients with MM who were classified into four groups based on MVD severity, angiogenesis was found to be significantly lower in complete responders than in non-responders. Independent prognostic factors in complete responders included lowest MVD grade and serum β2-microglobulin concentration of <3,400 ng/dL [14]. In the present study, we obtained a positive HR for patients with β2-microglobulin concentration of >3.8 mg/dL. Further, multivariate analysis showed that high MVD was significantly associated with shorter PFS after adjustment for hemoglobin, LDH, and β2-microglobulin concentration. A study involving 88 patients newly diagnosed with MM showed that MVD obtained at initial diagnosis was correlated with PFS and OS [17]. In this study, patients with high MVD had a median PFS of 21 months, which was longer than 10.2 months observed in the present study. This discrepancy may be due to the lower median age and lower median MVD in the previous study.
Although several studies have shown that angiogenesis, which is estimated by using MVD, is increased in Korean patients with MM, the correlation between MVD and other prognostic factors as well as the effects of MVD on survival have not been determined accurately. A previous study reported that MVD was weakly correlated with plasma cell percentage in BM samples [18]. Although MVD was significantly higher in patients with MM than in controls in this study, it did not significantly affect survival. Another study involving 75 patients with MM showed that age of <65 yr, hemoglobin concentration of ≥8.5 g/dL, platelet count of ≥100,000/µL, serum albumin level of ≥3.0 g/dL, serum calcium level of <12.0 mg/dL, serum creatinine level of <2.0 mg/dL, serum β2-microglobulin level of <4.0 µg/dL, and plasma cell percentage of <30% were significantly associated with longer OS [19]. However, this study also showed that VEGF concentration and MVD were not significant prognostic factors in patients with MM. Another study involving 21 patients with MM who were treated with high-dose chemotherapy and autologous stem cell transplantation showed no significant difference in OS between patients with MVD reduction of >50% and those with MVD reduction of <50% [8]. Results of these studies indicated that MVD had no prognostic value and were inconsistent with the results of our study because these studies only assessed OS.
The results of the present study indicated that high MVD was a prognostic factor, especially for disease progression, in patients with MM. Therefore, high MVD can be considered as an independent predictor of poor prognosis in Korean patients with MM. MVD should be measured after routine BM biopsy at initial diagnosis. Growth of myeloma cells and survival of patients with MM are associated with increased angiogenesis in the BM microenvironment, which promotes the metastasis of myeloma cells [320]. These findings along with the findings of studies involving the analysis of microvessels in patients with MM emphasize the importance of angiogenesis and suggest that antiangiogenic therapy can be effective in treating MM [1132021].
However, the present study has some limitations, including its retrospective design and manual estimation of MVD. We divided the patients into three groups based on the tertiles of MVD but did not include a control group. In addition, manual counting of MVDs in BM samples is a limitation because of interobserver differences, especially while counting very small arterioles and venules and exclusion of areas with non-specific staining. Because the difference in the mean (SD) MVDs determined by the two independent hematopathologists was statistically significant, more standardized MVD assessments such as those involving computerized image analyzers should be performed in the future [1114222324]. Thus, the present results should be validated by using computer-based analysis systems.
In conclusion, this study showed that increased MVD in the BM is a marker of poor prognosis in patients with MM. Routine measurement of MVDs in BM samples at initial diagnosis may assist in the treatment of patients with MM.
 XML Download