

 PDF
PDF ePub
ePub Citation
 Print
Print


Principles and methods of sample size determination for the comparison of two independent means were introduced in the previous article.1 In this article we will discuss sample size determination for the comparison of two independent proportions. While the same principles about power, α error, and β error can be applied as well, the selection of an adequate test is needed for the comparison of two independent proportions, depending on the condition whether the sample size is large enough or not.
Selection of two-sample test for proportions
The comparison of two independent proportions occurs when we perform an experiment with a binary outcome (e.g., success or failure) obtained from two groups (e.g., control vs. experiment groups). Let's call the sample sizes and proportions of success in the control and experimental groups as n1, n2, p1, and p2, respectively. When the sample size of an experiment is large enough (e.g., n1p1 > 5, and n2p2 > 5), we can assume the sampling distribution of proportions as approximately normal based on the central limit theorem. Therefore, when sample size is large enough, we can apply z test approximation in comparing two independent proportions and the same principle can be applied in the required sample size calculation.
The comparison of two proportions can be expressed as a 2 × 2 contingency table. When we test the association of two binary variables (two groups and two outcomes), we usually apply the Pearson chi-square test. When the sample size is large enough, the result of chi-square test and z test approximation are equally reliable and show the same result with an identical p value. If the condition satisfies for the application of the Pearson chi-square test, use of z test approximation in sample size calculation is justified.
However, if there is one or more cells with expected frequencies smaller than 5, statistical packages display the warning message that the Pearson chi-square test results cannot be reliable. In those cases, we need to apply the Fisher's exact test instead of the Pearson chi-square test. The Fisher's exact test is applicable when the sample size is small and we could expect that there may be one or more small cells (< 5). Therefore, different sample size calculation procedure following the Fisher's exact test will be applied when the sample size is small.
Calculation of sample size
1. Z test approximation for large sample test
When we suppose the sample size is large enough, following sample size calculation procedure can be performed based on z test approximation. Let's assume the following conditions: proportion of control group (p1) = 0.2, proportion of experimental group (p2) = 0.3. If we set α error level (two-sided) = 0.05 (corresponding zα/2 = 1.96), power level = 0.8 (corresponding zβ = 0.84), and allocation ratio ( n1 / n2= κ) = 1, the sample size is calculated as approximately 291 subjects per group using the following formula.2

The calculation procedure can be accomplished using the software G*Power. G*Power displays a similar result of sample size, 294 (Example 1).
2. Fisher's exact test for small samples test
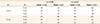
When we expect the sample size is small and there may be one or more small cells (< 5), following sample size calculation procedure can be performed based on the Fisher's exact test. Let's assume the following conditions: proportion of control group (p1) = 0.05, and proportion of experimental group (p2) = 0.3. We set α error level (two-sided) = 0.05 (corresponding zα/2 = 1.96), power level = 0.8 (corresponding zβ = 0.84), and allocation ratio (n1/n2 = κ) = 1. Because there is no definite formula related to the case, we need to use a software for sample size determination. Table 1 shows exemplary results applying various levels of proportions, α error, and power.
Sample size determination procedure using G*Power
An appropriate sample size for the comparison of proportions can be obtained by performing the following steps using G*Power, a free software.
1. Z test approximation for two independent proportions (Large sample test)
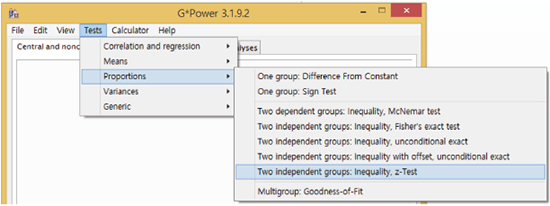
Step 1: Select statistical test types
Menu: Tests - Proportions - Two Independent Groups: Inequality, z-Test
Step 2: Select one-sided or two-sided test
Step 3: Select α error level
Step 4: Select power level
Step 5: Select allocation ratio
Step 6: Calculation of sample size
Menu: Calculate
Example 1) Two tailed test
      Proportions: p1 = 0.2, p2 = 0.3
      α error level = 0.05
      Power = 0.8
      Allocation ratio: n1/n2 = 1
      Appropriate sample size calculated: n1 = n2 = 294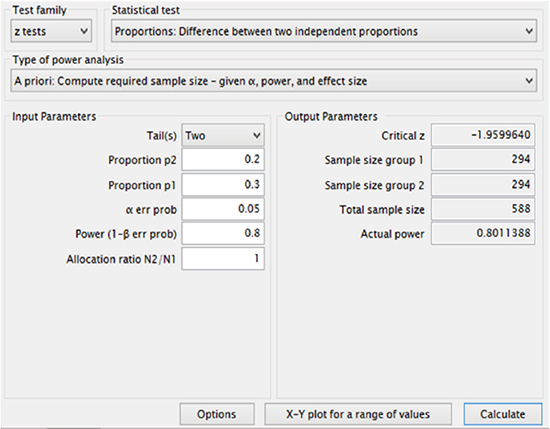
2. Fisher exact test for two independent proportions (Small sample test)
Step 1: Select statistical test types
Menu: Tests - Proportions - Two Independent Groups: Inequality, Fisher's exact test
Step 2 - Step 5 (the same as example 1)
Step 6: Calculation of sample size
Menu: Calculate
Example 2) Two tailed test
      Proportions: p1 = 0.05, p2 = 0.30
      α error level = 0.05
      Power = 0.8
      Allocation ratio n1/n2 = 1
      Appropriate sample size calculated: n1 = n2 = 39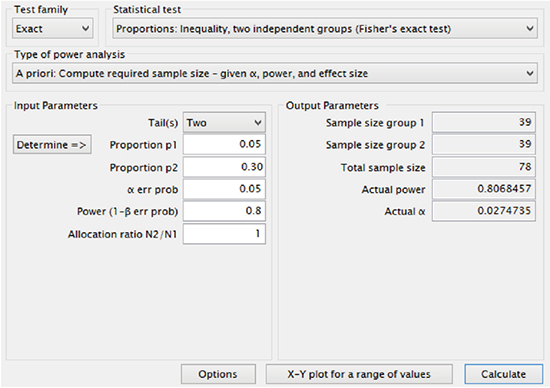
 XML Download