

 PDF
PDF ePub
ePub Citation
 Print
Print


Introduction
The success and survival of dental implants and implant restorations is dependent on thorough diagnosis and treatment planning. In a review of the literature, BouSerhal et al.1 concluded that several clinical situations require cross-sectional imaging for the optimal preoperative planning of implant placement. Information obtained from cone-beam computed tomography (CBCT) scans permits the measurement of the density, height, and buccolingual width of the alveolar bone at any jaw location, as well as visualization of the pathology, inclination of the bone, and anatomic vital structures.2,3,4
CBCT imaging data generated during implant planning can be converted and used to fabricate accurate three-dimensional (3D) surgical guides using proprietary software programs. Implants are placed with higher accuracy using these 3D surgical guides. These guides can also be used to generate retro-engineered casts that enable the prefabrication of restorations prior to implant surgery. These restorations can be precisely engineered to improve prosthetic outcomes and can be delivered to the patient on the day of the operation.5,6,7,8,9,10,11,12,13,14,15 Using all available virtual tools, true restoratively driven implant dentistry can be accomplished via image-guided surgery, benefiting both the patients and the dental surgeons.13,14,15,16
Several studies have concluded that few to no differences exist in the dimensional accuracy of conventional computed tomography and CBCT.1,17,18 Radiographic methods utilized in the presurgical planning of implants must result in accurate and reliable measurements. CBCT imaging differs from conventional computed tomography imaging with regard to its resolution and field of view (FOV).19 Large FOV images are needed by orthodontists, oral and maxillofacial surgeons, and prosthodontists for advanced reconstruction with dental implants. However, for most other situations, especially endodontics, a more restricted FOV is suitable. Smaller FOV images are more affordable and decrease the patient's radiation exposure. Small FOV images preclude the need for an expert opinion when the tissues imaged are restricted to dental structures.
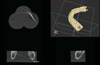
Three-dimensional stitching (Carestream Health Inc., Rochester, NY, USA) is a new 3D acquisition mode that automatically combines two or three small FOV volumes to construct a larger, composite 3D image that is needed for a wider region of examination (80 mm×37 mm). The benefits of the 3D stitching module include a broader range of applications, affordability, flexibility, optimizing the radiation dose for patient safety, and improved workflow.
Kopp and Ottl19 performed a study to verify the dimensional stability of stitched images, using endodontic files in select teeth. Distances were measured between reproducible points and found to be acceptable, with vertical distances ranging from 0.212 to 0.409 mm. The authors concluded that the stitched images were dimensionally stable, but indicated that further studies were needed to justify the use of stitched images for splint fabrication.
The manufacturers of the 3D stitching program have recently received approval for using stitched small FOV images to reconstruct data sets for the fabrication of implant surgical guides. However, no scientific study of the program has assessed its suitability for the fabrication of surgical guides.
The purpose of this study was to evaluate the linear distance accuracy and reliability of stitched small field of view CBCT images for use in the fabrication of surgical dental implant guides. The results of this study may help decide whether stitched volumetric data sets would be able to be utilized in the fabrication of stereolithographic and computer-aided design/computer-aided manufacturing surgical guides.
Materials and Methods
A single dentate dry human cadaveric mandible, free of outstanding defects, was acquired for the study. Three 1.5 mm×1.5 mm gutta percha (Henry Schein, Melville, NY, USA) reference points were placed on the mandible and fixed with cyanoacrylate gel. The first gutta percha reference point was placed in the right quadrant, on the inferior border of the mandible and apical to the first molar. This point was designated as reference point A. The second reference point was aligned with the mid-symphysis and was also placed on the inferior border of the mandible. This point was designated as reference point B. The third reference point was placed in the left quadrant on the inferior border of the mandible, apical to the first molar. This point was designated as reference point C. The three reference points were placed to coincide with a point on the midline of each of the three localized spherical volumes, which would be recorded by the small FOV CBCT scanner (Kodak 9000 D, Carestream Health Inc., Rochester, NY, USA). Ten additional staggered 1.5 mm×1.5 mm gutta percha markers were placed in the bone as fiduciary markers and fixed with cyanoacrylate gel. The fiduciary markers were placed on both sides of the mandible. Five markers were placed on the buccal aspect and the remaining five were placed on the lingual aspect, such that there would be one reference point and at least three fiduciary markers in each scan of a localized spherical volume. The fiduciary markers were labeled 1-10, beginning in the buccal lower right quadrant and continuing sequentially, in counterclockwise fashion, from the buccal aspect to the lingual aspect.
The control group measurements were recorded by taking direct measurements on the cadaveric mandible. They were recorded using precision sliding digital calipers (General Tools, New York, NY, USA) (Fig. 1). The measurements were made from the centro-inferior aspect of the reference point to the centro-external aspect of the fiduciary marker. Inter-reference point measurements were also made. Each measurement was recorded three times at an interval of 24 hours. The data was compiled using Microsoft Excel version 12 (Microsoft, Redmond, WA, USA). The mean of the three measurements was designated as the anatomic linear dimension.
The study group measurements were made by mounting the mandible on an adjustable calibration table in the CBCT scanner. A 0.5-mm thick piece of pressure-formable thermoplastic material (Biocryl, Great Lakes Orthodontics, Tonawanda, NY, USA) was positioned over a 1.5-inch foam pad to separate the mandible from the calibration table in order to minimize distortion. The mandible was centrally positioned with the aid of laser lights, such that the inferior border of the mandible was parallel to the horizontal plane and the mid-sagittal plane was aligned perpendicularly to the horizontal plane. This altered positioning, in which the inferior border was parallel to the horizontal plane instead of the occlusal plane, permitted the entire mandible and all associated reference points to be captured in three scans without affecting the accuracy of the scan, despite the small field of view (37 mm).20,21 The scan was performed with the following modified exposure settings to account for the lack of soft tissue density: 6mA, 80 kVp, 18 s, 0.2 mm voxel size.
Care was taken not to move the mandible from its mounted position during all three scans. The raw Digital Imaging and Communications in Medicine data from the three scans were stitched into a composite 3D volume using the latest version of the Kodak 9000 proprietary software (KDIS version 6.11., 6.2 and 3D module version 2.1, Carestream Health Inc, Rochester, NY, USA). The Kodak 9000 proprietary software does not require the required reference points to be defined manually in order to stitch the volumes together. Instead, it is only necessary to select the appropriate option from the user menu, and the software then automatically combines the volumes into one ready-to-use 3D volume. The images were viewed on a 19-inch monitor (Dell Inc., Round Rock, TX, USA) in its default resolution of 1600×1200 pixels. Multiplanar reconstructed slices (sagittal, parasagittal, axial, and coronal) were correctly manipulated and used to visualize and measure the linear and/or angular distances from the three reference markers to each of the ten fiduciary markers with the software's measuring tool. The points and markers were visually located and marked with a mouse (Dell Inc., Round Rock, TX, USA). As in the control, the measurements were made from the centro-inferior aspect of the reference points to the centro-external aspect of the fiduciary markers on the software. Care was taken to correctly adjust each slice in the multiplanar reconstruction view to identify the most superficial aspect of each marker, mimicking the control measurements made with the calipers (Fig. 2). Each measurement was recorded three times at 24-hour intervals by the same evaluator and logged into the spreadsheet. The mean was calculated for each measurement and designated as the stitched small FOV CBCT dimension. Both the mean anatomic linear dimension and the mean stitched small FOV CBCT dimension were calculated for each of the three measurements, in order to allow the two groups to be compared. The means of the two groups were compared and the difference between the anatomic linear dimension and stitched small FOV CBCT dimension was determined. The mean, standard deviation, and mean differences were calculated using Microsoft Excel.
Results
Intraoperator differences in the control measurements made on the skull with digital calipers (the anatomic linear dimension) were analyzed and found to be statistically significant. The mean difference among the control measurements was -0.01 mm with a 95% confidence interval of -0.04 - -0.03 mm (Table 1) and a standard deviation of 0.10 mm. Intraoperator differences in the digital CBCT measurements were also found to be statistically significant. The mean intraoperator difference among the CBCT measurements was -0.08 mm with a 95% confidence interval of -0.12 - -0.03 mm (Table 2). The overall mean difference between the control group (anatomic linear dimension) measurements and the study group (stitched small FOV CBCT) measurements was 0.34 mm (Table 3). The mean standard deviation between the two groups was 0.30 mm with a 95% confidence interval of ±0.102mm(0.24 - 0.44 mm).
Discussion
The intraoperator differences between the control measurements made on the skull with digital calipers (the anatomic linear dimension) were analyzed and found to be statistically significant. This is attributed to the small 0.10 mm standard deviation in differences between measurements. The mean difference between control measurements was -0.01 mm, with a 95% confidence interval of -0.04 - -0.03 mm and a standard deviation of 0.10 mm. Sharp digital calipers and sharp gutta percha points facilitated accurate measurement of fiduciary markers and reference points. Although statistically different, mean differences of hundredths of a millimeter are not clinically relevant. The intraoperator differences in CBCT digital measurements were also found to be statistically significant. The mean intraoperator difference between CBCT measurements was -0.08 mm, with a 95% confidence interval of -0.12 - -0.03 mm. The statistical significance of these measurements was also due to the small 0.14-mm standard deviation in the differences between measurements. This phenomenon might be explained as the result of controlled, predictable detection of the center of each gutta percha marker on the mandible by manipulating multiple sub-millimeter planes viewed in the stitched small FOV CBCT software. The points were detected as a result of their radiopacity in each plane. The multiplanar views were manipulated until a slight, pinpoint radiopacity was detected, enabling the center of each point to be identified. Despite the statistical significance, a mean difference of -0.08mm with a standard deviation of 0.14 mm is not clinically significant. In comparing the control (anatomic linear dimension) measurements to the CBCT measurements, the mean difference between the anatomic linear dimension and the stitched small FOV CBCT dimension was found to be 0.34 mm with a 95% confidence interval of +0.24 -+0.44mm and a mean standard deviation of 0.30 mm. There was no systematic bias between the differences in the observations. Thus, each measurement appeared to be as good as the other. The differences between the control measurements and the CBCT measurements were acceptable within the parameters defined in this study.
The results of this study indicated that CBCT measurements underestimated the control measurements. Similar results were obtained by Lascala et al.,22 who found a mean difference of 0.34 mm between anatomic linear dimension measurements and stitched small FOV CBCT measurements. Inconsistencies in the accuracy of Digital Imaging and Communication in Medicine files reconstructed by a proprietary software program were reported by Periago et al.23 They concluded that many linear measurements between cephalometric landmarks in 3D volumetric surface rendering datasets might be statistically significantly different from the anatomic dimensions. However, whether or not the differences in measurements are clinically significant is a matter of defining the parameters for clinical significance.
A 1-mm margin of error was considered the clinically relevant threshold for accuracy in this study, and was chosen due to its common application and use in nearly all clinical dental procedures. The parameters for restorative dental procedures are evaluated and executed on the scale of millimeters. In order to ensure successful treatment, it is proposed that the root canal space be properly instrumented and obturated within 1 mm of the root's apex. Probing depths are used to diagnose and treat the periodontium using a millimeter scale. More pertinent to this study, a 2-mm safety zone near vital structures has been suggested when surgically planning and placing dental implants near vital structures.3 This suggestion is based on conventional radiography with its inherent distortions. Discrepancies >1 mm, with additional statistical margins of error, might encroach on these clinically accepted safety parameters.
Despite the superior image accuracy of stitched small FOV CBCT, it might not be prudent to assume that one could approximate vital structures during surgical procedures with more accuracy than previously established in the literature, due to the operator's visual and tactile limitations. According to the results of this study, the likelihood of measurement discrepancies increases when using both analog measuring instruments (i.e., calipers or probes) and digital stitched small FOV CBCT measurements. This increases the need for the accurate conversion of stitched small FOV CBCT images into computer-aided design/computer-aided manufacturing surgical guides, allowing for the safest surgery possible. As noted previously, the differences in both the anatomic linear dimension and the stitched small FOV CBCT dimension were statistically significant, but clinically insignificant due to the sub-millimeter resolution of the measurements. This difference is beyond the resolution of the human eye and hand.
Kopp and Ottl19 studied the dimensional stability of stitched data sets and also found them to be acceptable. In dual scan, guided surgical protocols, reference markers in each of the three fields of view can be obtained by using anatomical landmarks or notches that are simply made with a round bur in the location of the mid-symphysis and near the posterior borders of the radiographic template, outside the positional osteotomy sites. These markers can be verified in the reconstructed image with digital measurements in multiplanar views of the CBCT image. If the measurements match, the operator should feel confident in the stitched small FOV volumes. If significant discrepancies in measurement occur, the scan or stitched volumes might be inaccurate, causing the subsequent guide to be inaccurate. In this situation, guided surgery should be aborted.
Similarly, reference markers can be incorporated into the radiographic guide before taking the scan, and the resulting measurements can be used to assess the accuracy of the implant surgical stent. If a discrepancy is be found, the accuracy of the guide can be considered suboptimal. Any inaccuracies found at this stage might be result from random problems in the guide fabrication process.
The 3D stitching module has several advantages, including broader range of applications, affordability, flexibility, optimizing the radiation dose for patient safety, and improved workflow. However, it should be noted that horizontal stitching results in scanning the overlapping regions twice, thereby doubling the radiation dose delivered to those regions.24 Small FOV scans have a better image quality and resolution than large FOV scans.25 This study appears to be the first of its kind, and further studies are needed to compare the radiation exposure and image quality of stitched images to large FOV images and to verify the accuracy of the guide fabrication process using stitched Digital Imaging and Communication in Medicine files.
In conclusion, stitched composite 3D imaging appeared accurate and reliable for diagnostic purposes, within the operator's physical limitations and the parameters defined in this study. Clinically insignificant differences between the control measurements and those of the stitched data sets might be taken into consideration in the diagnosis and treatment planning of both surgical and non-surgical dental procedures. The minuscule differences between the control measurements and those of the stitched data sets may allow image-guided implant surgical stents to be fabricated from such data sets.


 XML Download