Journal List > Anat Cell Biol > v.50(3) > 1071896

Ogedengbe, Ajayi, Komolafe, Zaw, Naidu, and Okpara Azu: Sex determination using humeral dimensions in a sample from KwaZulu-Natal: an osteometric study

Abstract

The morphological characteristics of the humeral bone has been investigated in recent times with studies showing varying degrees of sexual dimorphism. Osteologists and forensic scientists have shown that sex determination methods based on skeletal measurements are population specific, and these population-specific variations are present in many body dimensions. The present study aims to establish sex identification using osteometric standards for the humerus in a contemporary KwaZulu-Natal population. A total of 11 parameters were measured in a sample of n=211 humeri (males, 113; females, 98) from the osteological collection in the Discipline of Clinical Anatomy, Nelson R. Mandela School of Medicine, University of KwaZulu-Natal, Durban, South Africa. The difference in means for nearly all variables were found to be significantly higher in males compared to females (P<0.01) with the most effective single parameter for predicting sex being the vertical head diameter having an accuracy of 82.5%. Stepwise discriminant analysis increased the overall accuracy rate to 87.7% when all measurements were jointly applied. We conclude that the humerus is an important bone which can be reliably used for sex determination based on standard metric methods despite minor tribal or ancestral differences amongst an otherwise homogenous population.

Introduction

Determination of sex is an important first step in the identification process of an individual in a forensic examination. A biological profile which includes age, race, and stature when determined from the various human remains are amongst several other key parameters that need to be rapidly determined [12]. Reports from previous studies have indicated that virtually every human bone has been used for sex determination with varying accuracy rates [34]. Although studies have demonstrated both higher and more reliable accuracies using the pelvis and cranium [56], recent studies have shown similarly high accuracy rates in postcranial long bones [678] foregrounding the relevance of the humeral bone for sex determination [910]. The humerus has in fact received a lot of attention in recent forensic and anthropological literature with emphases being placed on its metric characteristics, in setting standards for sex determination [1112].
Despite previous literature predicting the maximum length (ML) of the humerus as a good predictor of sex [39], the vertical head diameter (VDH) and epicondylar breadth (EB) of this bone have also been shown to be accurate predictors of sex [1314]. Furthermore, humeral metric assessment of sexual differences among the South Africans white and blacks using the Dart and Pretoria collection has indicated that the VDH and EB are the best predictor in whites, whereas VDH and ML are the best predictors in blacks [10].
Since variations have been reported to exist amongst different regional populations [15] with these population-specific variations being common in many body dimensions [16], it is important to note that humeral dimensions can vary distinctly from one geographic region to another [171819].
However, in the South African context, it has been shown that although there are some regional differences amongst blacks, they still belong to a single homogeneous group [20212223]. In the study of black Africans, it is useful to generate certain specific body measurements for individuals from diverse geographical regions as it would be better to understand observed differences on a tribal basis. The present study aims to establish key metrics for the humerus derived from a contemporary South Africa population in the region of KwaZulu-Natal province. Comparison of these metrics with those from studies of other populations could broaden understanding and assist in various medico-legal, forensic, and anthropological discourses.

Materials and Methods

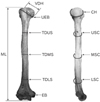
This study was conducted on 211 humeri (males, 113; females, 98) collected in the Discipline of Clinical Anatomy, Nelson R. Mandela School of Medicine, University of KwaZulu-Natal, Durban, South Africa. These bones were of people from South African black descent who died between the years of 1960 to 1996 and were donated to the department. Ethical approval was sought and obtained from the University of KwaZulu-Natal Biomedical Research Ethics Committee (BREC) with reference BCA356/14. The subjects were randomly distributed in the KwaZulu-Natal region. The ages for males ranged between 18 to 81 years with the mean of 48.5 (standard deviation [SD], 14.5) and females from 17 to 75 years with a mean of 45.4 (SD, 13.4). Eleven parameters were measured from each humeral bone using an osteometric board, vernier callipers and a flexible measuring tape (Table 1, Fig. 1). All measurements were done in accordance with standard osteometric techniques as recommended by Martin and Saller [24], Bass [25], and Devi et al. [26]. Transverse diameters were taken with the bones placed with their dorsal surfaces resting on the osteometric board (Fig. 1).
To assess differences, measurements were subjected to standard statistical analysis using student's t test and a P-value of <0.05 was considered statistically significant. In addition, the demarking point for each variable was individually computed. The demarking point represents the average of the mean for males and females [2728]. A discriminant score (DS) higher than the demarking point indicates a male, while a lesser score indicates a female bone.
Sexual dimorphism ratios were calculated to determine the level of differences between the sexes using the formula below [2930].
Sexual dimorphism ratio=(Male mean)/(Female mean)×100
To determine the variable that will provide the best discrimination between sexes, a stepwise discriminant function analysis was applied to all dimensions using Wilk's lambda. F=3.84 was used to enter and F=2.71 to remove variables. Wilks' lambda is a test statistics in multivariate analysis of variance (MANOVA). Like the F-statistic in ANOVA, it is used to establish whether there are differences between the means of groups of subjects on a combination of dependent variables. It provides an objective measure of the amount of variance that is accounted for by the independent grouping variable—in this case, sex, against the combination of dependent variables—in this case, the humeral metrics. In doing so it indicates how well the prediction model fits. Variables were also subjected to direct and stepwise discriminant function analysis to develop an equation for sex determination of the humeri from this geographic region. The original sample was cross-validated and a “leave-one-out” classification procedure applied to determine the final accuracy rates. In this procedure, each individual bone was correctly classified by the functions derived from all cases other than the case itself. Assessment of inter and intra observer errors were evaluated using a sub-set of 30 males and 30 females done by two independent observers. Three measurements were taken by each observer and subject to intra-class correlation coefficient analysis in SPSS version 24.0 (IBM Corp., Chicago, IL, USA).

Results

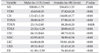
Comparison of mean values for all parameters (Table 2) showed males to be statistically significantly higher than those of females for transverse diameter at the upper half of the shaft (TDUS) (P<0.05) with P<0.01 for all other variables.
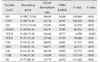
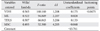
The sexual dimorphism ratio, demarking points (points separating males from females), F-ratio and their corresponding significance levels is presented in Table 3. A higher demarking point indicates a male with females having a lower value. The result of stepwise discriminant function analyses was reported in Table 4. Of the eleven variables entered into the function, only four were ultimately selected as ‘critical.’ These were VDH, ML, transverse diameter at the lower half of shaft (TDLS), and mid-shaft circumference (MSC) in that relative order. The table also present the unstandardized discriminant function coefficients and the sectioning points (average of the male and female centroids) in the original samples [31]. To determine the sex of an individual, the DS can be obtained from specified function. Each humeral dimension is multiplied by its corresponding raw (unstandardized) coefficient and then added to the constant, if the score is greater than the sectioning point, then the individual is male, whereas a score less than the sectioning point indicates a female [10]. For example, a black individual with VDH (43.63), ML (320.81), TDLS (23.52), and MSC (62.95), the calculation will be as following.
DS=0.175×VDH+0.028×ML+0.133×TDLS−0.048×MSC− 15.761=0.964
As this value (0.964) is greater than the sectioning point (−0.0675), the individual is a male.
The classification accuracy for the humeral dimensions (Table 5) indicate VDH to be the most effective single dimension or the best predictor for sex using stepwise discriminant analyses with an average accuracy of 82.5% (r=0.868). The results also indicate that the percentage accuracy is increased for both sexes when the four variables VDH, ML, TDLS, and MSC (selected by the stepwise discriminant analyses procedure) are combined giving a combined average accuracy value of 87.7%.
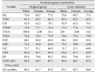
All the variables selected by the stepwise discriminant function analysis were reported (Table 6). The best discriminatory variables and the percentage accuracy for several different populations as well as that of the present KwaZulu-Natal study population is given in Table 6. The demarking points from other studies is also given for comparison (Table 7).
The mean inter-observer correlation coefficient for all parameters combined is 0.982 with the mean intra-observer correlation coefficient for researchers 1 and 2 being 0.989 and 0.987, respectively. All classes of observer errors were much greater than 0.7 indicating a very high degree of correlation. No significant intra and inter-observer errors were found necessitating removal of any of the measured parameters.

Discussion

It is posited that there is no significant ethnic differences in humeral metrics necessitating the use of an entirely new formula for blacks in South Africa. However, it is conceivable that tribal differences will lead to minor variation in certain metrics requiring modification to the existing formulas. This study aimed to investigate the local KwaZulu-Natal population with view to confirming or disproving this. In order to assess if any sex differences exist within a contemporary South Africa population in the region of Kwazulu-Natal province, key metrics for sex discrimination using osteometric standards for the humerus was employed. All of these parameters (ML, VDH, circumference of the head, transverse diameter at the middle of the shaft [TDMS], TDUS, TDLS, upper shaft circumference, MSC, lower shaft circumference, upper epiphyseal breadth, and EB) were investigated as listed in Table 2. The differences in mean of these variables were significantly higher in males when compared to females. These findings confirm previous studies on the humerus as reported by several authors [32333536]. This could be attributed to a more variable lifestyle and differential patterns of physical labour expected of males versus females [37]. Another contributing factor may be as a result of early maturity of females thereby giving males two or more additional years to develop physically [36].
Our results point to the VDH of the humerus as the best single parameter in predicting sex. This agrees with findings from other populations such as the South Africa blacks from the Dart and Pretoria [10], the Chinese [32], the Germans [9], the Cretans [3], and the Koreans [33].
In comparison, the EB of the humerus serves as the better predictor of sex from findings obtained from populations such as the South African whites in Dart and Pretoria [10], the Japanese and Thai [32] populations.
The combined accuracy of variables selected by the discriminant function and the accuracy of the best predictor of sex using the humeral bone is lowest in the present study, and also for the Chinese [32] when compared with other population groups (Table 6). This suggests that patterns of variations exist in humeral dimensions amongst different tribal groups within and amongst the various population groups [153839]. However, the variations that occur in parameters investigated in Steyn and Işcan [10] study show for example the demarking point for ML=311.35 and VDH=40.75 (amongst blacks) while this present study shows a demarking point of ML=307.52 and VDH=39.95. This differences appears insufficient similar to making the KwaZulu-Natal a distinct sub-population within South Africa.
The classification rate for this study using single variables (ML, VDH, MSC, and EB) ranges from 77.3%–83.9%. For comparison, the classification rate is 76.8–81.8%, 79.8%–92.4%, and 87.5%–97.1% in Chinese, Japanese, and Thai populations respectively [32], 84.0%–89.7% and 88.55%–90.95% in South African whites and black in Dart and Pretoria population respectively [10], 80.6%–90.4% in Germans [9], 86.6%–95.5% in Guatemalans [34], 83.3%–92.90% in Cretans [3], and 74.7%–87.0% in Koreans [33].
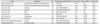
The demarking point of the South African whites was higher than that of all other populations compared in two of the selected variables (ML and VDH) as shown in Table 7. The Cretan population has the highest MSC demarking point when compared with other populations.
However in the present study, similarities in the ML demarking point were observed with that of the Cretans (307.52 vs. 307.39) and the South African blacks (307.52 vs. 311.35). Referring to Table 7, the VDH demarking point (present study) is also similar to other studies of South Africa blacks (Dart and Pretoria, 39.75 vs. 40.74). In addition, the Thai and Japanese study show VDH demarking point of 41.20 and 41.60 which is similar to the VDH demarking point of the present study (39.95). The MSC demarking point (present study) is similar to that of the Chinese and Japanese (60.92 vs. 61.10 and 61.40, respectively). We observed a smaller ML demarking point in our study compared with those of South Africa whites (307.52 vs. 322.20) while our ML demarking point appears bigger than those of the Japanese (287.15), Korean (289.50), Thai (289.75), and Chinese (298.65) populations. The differences observed in demarking points may be due to changes in environmental factors that affect bone growth such as lifestyle, nutrition, and extreme division of labour as well as genetic constitution. Experimental variability (sample measurements) is also a possible source or variation although shown to be quite small for most parameters in this study. This study shows a high degree of intra and inter-individual correlation between all the variables in the sample dataset.
Overall however, the changes to the new formula were minor as it incorporated new parameters not investigated by others. Using the new parameters, the overall accuracy rate was increased to 87.7% by stepwise discriminant analysis when all measurements were jointly applied. However, this improvement does not warrant an entirely new formula but minor corrections to the existing ones. The value of this modified formula is that it incorporates these new parameters which may prove useful when presented with fragments of the humerus bone which have only these parameters.
It is clear that population differences affect sexual dimorphism as reflected in humeral dimensions. However, a specific standard for sex determination in the KwaZulu-Natal population in South Africa has been explored which may be useful in forensic investigations.
It should be noted however that less commonly measured parameters (TDUS, TDMS, and TDLS) were used to expand the scope of this study which may bring minor conflicts with the results of other researchers. The value of this study demonstrates that the humerus is a useful bone which can be used for the determination of sex for forensic and other purposes. However in a fragmentary state, its accuracy is limited as at least four of the eleven parameters are needed for satisfactory classification accuracy rates.

Figures and Tables

Fig. 1

Posterior and mediolateral views of the left humerus showing the parameters used. VDH, vertical head diameter; UEB, upper epiphyseal breadth; TDUS, transverse diameter at the upper half of the shaft; TDMS, transverse diameter at the middle of the shaft; TDLS, transverse diameter at the lower half of shaft; EB, epicondylar breadth; ML, maximum length; CH, circumference of the head; USC, upper shaft circumference; MSC, mid-shaft circumference; LSC, lower shaft circumference.

acb-50-180-g001
Table 1

Definitions of humeral parameters measured

acb-50-180-i001
No. Parameter Abbreviation Definition Instrument used
1 Maximum length ML Straight distance from the most superior point on the head of the humerus to the most inferior point on the trochlea Osteometric board
2 Vertical diameter of the head VDH Direct distance between the highest and the lowest point on the articular margin of the head measured Electronic digital caliper
3 Circumference of the head CH Circumference of the humeral head along its articular surface Flexible tape
4 Transverse diameter at the upper half of the shaft TDUS Distance between the medial and lateral margins at the middle of upper half of the humeral shaft Electronic digital caliper
5 Transverse diameter at the middle of the shaft TDMS Distance between the medial and lateral margins of the humeral shaft at the middle Electronic digital caliper
6 Transverse diameter at the lower half of shaft TDLS Distance between the medial and lateral margins of the humeral shaft at the middle of the lower half of shaft Electronic digital caliper
7 Upper shaft circumference USC Circumference of humeral shaft at the middle of the upper half of shaft Flexible tape
8 Mid-shaft circumference MSC Circumference of the humeral shaft at the middle Flexible tape
9 Lower shaft circumference LSC Circumference of the humeral shaft at the middle of the lower half of shaft Flexible tape
10 Upper epiphyseal breadth UEB Obtainable distance between the medial-most point on the articular surface of the head and the lateral-most point on the greater tubercle Electronic digital caliper
11 Epicondylar breadth EB Distance between the most lateral point on the lateral epicondyle and the tip of medial epicondyle Electronic digital caliper
Table 2

Mean values of variables of humerus in males and females (Students t test)

acb-50-180-i002
Variable Males (n=113) (mm) Females (n=98) (mm) P-value
ML 320.81±1.79 294.63±1.55 <0.01
VDH 43.63±0.35 37.82±0.28 <0.01
CH 133.47±3.30 116.01±0.77 <0.01
TDMS 20.89±0.25 17.96±0.19 <0.01
TDUS 23.15±2.03 18.28±0.20 0.028
TDLS 23.52± 0.29 20.00±0.25 <0.01
USC 66.10±0.64 60.74±0.56 <0.01
MSC 62.95±0.53 58.99±0.54 <0.01
LSC 64.00±0.58 59.84 ±0.58 <0.01
UEB 49.51±0.43 43.43±0.30 <0.01
EB 61.36± 0.50 54.40±0.40 <0.01

Values are presented as mean±SEM. ML, maximum length; VDH, vertical head diameter; CH, circumference of the head; TDMS, transverse diameter at the middle of the shaft; TDUS, transverse diameter at the upper half of the shaft; TDLS, transverse diameter at the lower half of shaft; USC, upper shaft circumference; MSC, mid-shaft circumference; LSC, lower shaft circumference; UEB, upper epiphyseal breadth; EB, epicondylar breadth.

Table 3

Demarking points separating males from females, sexual dimorphism ratio, F ratio, and statistical significance in KwaZulu-Natal study population

acb-50-180-i003
Variable (mm) Demarking point Sexual dimorphism ratio Wilks' lambda F-ratio P-value
ML F<307.72<M 108.89 0.638 118.164 <0.01
VDH F<40.73<M 115.36 0.565 160.160 <0.01
CH F<114.74<M 115.05 0.901 22.950 <0.01
TDMS F<19.43<M 116.31 0.707 86.251 <0.01
TDUS F<20.72<M 126.64 0.977 4.898 0.028
TDLS F<21.72<M 117.60 0.725 78.868 <0.01
USC F<63.42<M 108.82 0.847 37.535 <0.01
MSC F<60.92<M 106.71 0.887 26.512 <0.01
LSC F<61.92<M 106.95 0.892 25.272 <0.01
UEB F<46.47<M 114.00 0.625 124.758 <0.01
EB F<57.88<M 112.79 0.652 111.162 <0.01

ML, maximum length; VDH, vertical head diameter; CH, circumference of the head; TDMS, transverse diameter at the middle of the shaft; TDUS, transverse diameter at the upper half of the shaft; TDLS, transverse diameter at the lower half of shaft; USC, upper shaft circumference; MSC, mid-shaft circumference; LSC, lower shaft circumference; UEB, upper epiphyseal breadth; EB, epicondylar breadth.

Table 4

Summary of stepwise discriminant function analyses, unstandardized discriminant function coefficients, and the sectioning points

acb-50-180-i004
Variables entered Wilks' lambda F-ratio d.f Unstandardized coefficients Sectioning points
VDH 0.565 160.160 1,208 0.175 −0.0675
ML 0.522 94.849 2,207 0.028
TDLS 0.507 66.843 3,206 0.133
MSC 0.495 52.380 4,205 −0.048
Constant −15.761

VDH, vertical head diameter; ML, maximum length; TDLS, transverse diameter at the lower half of shaft; MSC, mid-shaft circumference.

Table 5

Classification accuracy on humeral dimension in KwaZulu-Natal population

acb-50-180-i005
Variable Predicted group membership
Original group Cross-validated
Males Females Average Males Females Average
ML 72.6 82.7 77.3 72.6 82.7 77.3
VDH 82.3 82.7 82.5 82.4 82.7 82.5
CH 92.9 62.2 78.7 92.9 62.2 78.7
TDMS 75.0 77.7 76.2 73.2 77.6 75.2
TDUS 100.0 2.00 54.5 100 2.00 54.5
TDLS 72.6 75.5 73.9 72.6 75.5 73.9
USC 68.1 62.2 65.4 68.1 62.2 65.4
MSC 74.3 50.0 63.0 74.3 50.0 63.0
LSC 71.7 57.1 64.9 71.7 57.1 64.9
UEB 85.0 82.7 83.9 85.0 82.7 83.9
EB 85.0 79.6 82.5 85.0 79.6 82.5
VDH+ML+TDLS+MSC 90.3 84.7 87.7 89.4 84.7 87.2
All variables 89.3 85.7 87.6 85.7 83.7 84.8

Values are presented as percentage. ML, maximum length; VDH, vertical head diameter; CH, circumference of the head; TDMS, transverse diameter at the middle of the shaft; TDUS, transverse diameter at the upper half of the shaft; TDLS, transverse diameter at the lower half of shaft; USC, upper shaft circumference; MSC, mid-shaft circumference; LSC, lower shaft circumference; UEB, upper epiphyseal breadth; EB, epicondylar breadth.

Table 6

Variables selected by the stepwise discriminant function analysis, the best discriminatory variable for group assessment, and the percentage of accuracy for several different populations

acb-50-180-i006
Study Population No. Variables selected (stepwise) Accuracy (%) Best variable Accuracy (%)
Steyn and Işcan [10] South Africans whites (Dart and Pretoria) 104 EB/VDH 92.5 EB 94.7
Steyn and Işcan [10] South Africans blacks (Dart and Pretoria) 88 VDH/ML 93.1 VDH 96.0
Işcan et al. [32] Chinese 87 ML/VDH/EB/MSC 86.6 VDH 80.5
Işcan et al. [32] Japanese 90 EB/VDH/MMSD/MSC 92.4 EB 89.9
Işcan et al. [32] Thais 104 EB/VDH/MMSD 97.1 EB 93.3
Lee et al. [33] Koreans 175 ML/VDH 87 VDH 87.0
Ríos Frutos [34] Guatemalans 118 MDH/MMSD/EB 98.5 MDH 95.5
Mall et al. [9] Germans 143 ML/VDH/EB 93.2 VDH 90.4
Kranioti and Michalodimitrakis [3] Cretans 178 ML/VDH/MMSD/EB 92.9 VDH 89.9
Present study (2017) KwaZulu-Natal’s 211 VDH/ML/TDLS/MSC 87.7 VDH 82.5

EB, epicondylar breadth; VDH, vertical head diameter; ML, maximum length; MSC, mid-shaft circumference; MMSD, minimum midshaft diameter; MDH, maximum diameter of the head; TDLS, transverse diameter at the lower half of shaft.

Table 7

Comparison of demarking points with other studies

acb-50-180-i007
Study Population ML VDH MSC
Işcan et al. [32] Chinese F<298.65<M F<42.30<M F<61.10<M
Işcan et al. [32] Japanese F<287.15<M F<41.60<M F<61.40<M
Işcan et al. [32] Thai F<289.75<M F<41.20<M F<57.15<M
Lee et al. [33] Koreans F<289.50<M F<42.70<M -
Steyn and Işcan [10] South African whites (Dart and Pretoria) F<322.20<M F<46.04<M -
Steyn and Işcan [10] South African blacks (Dart and Pretoria) F<311.35<M F<40.74<M -
Kranioti and Michalodimitrakis [3] Cretans F<307.39<M F<43.79<M F<62.03<M
Present study (2017) KwaZulu-Natal's F<307.52<M F<39.95<M F<60.92< M

ML, maximum length; VDH, vertical head diameter; MSC, mid-shaft circumference; F, female; M, male.

Acknowledgements

The authors wish to thank the staff of the discipline of anatomy for their generous assistance in all practical areas of data collection. Special thanks to Mr Dan Naidoo for technical help and Mr Justin Naidu for assistance with graphics.

References

1. Kumaran MS, Bastia BK, Kumar L, Patel SH. Correlation between fingerprint and lip print pattern in Gujarati population. Med Legal Update. 2017; 17:217–221.
2. Kamenov GD, Curtis JH. Using carbon, oxygen, strontium, and lead isotopes in modern human teeth for forensic investigations: a critical overview based on data from Bulgaria. J Forensic Sci. 2017 Feb 23 [Epub]. DOI: 10.1111/1556-4029.13462.
3. Kranioti EF, Michalodimitrakis M. Sexual dimorphism of the humerus in contemporary Cretans: a population-specific study and a review of the literature. J Forensic Sci. 2009; 54:996–1000.
4. Gonçalves D, Thompson TJ, Cunha E. Sexual dimorphism of the lateral angle of the internal auditory canal and its potential for sex estimation of burned human skeletal remains. Int J Legal Med. 2015; 129:1183–1186.
5. Krüger GC, L'Abbé EN, Stull KE, Kenyhercz MW. Sexual dimorphism in cranial morphology among modern South Africans. Int J Legal Med. 2015; 129:869–875.
6. Krüger GC, L'Abbé EN, Stull KE. Sex estimation from the long bones of modern South Africans. Int J Legal Med. 2017; 131:275–285.
7. Stull KE, L'Abbé EN, Ousley SD. Subadult sex estimation from diaphyseal dimensions. Am J Phys Anthropol. 2017; 163:64–74.
8. Kranioti EK, García-Donas JG, Almeida Prado PS, Kyriakou XP, Langstaff HC. Sexual dimorphism of the tibia in contemporary Greek-Cypriots and Cretans: forensic applications. Forensic Sci Int. 2017; 271:129.e1–129.e7.
9. Mall G, Hubig M, Büttner A, Kuznik J, Penning R, Graw M. Sex determination and estimation of stature from the long bones of the arm. Forensic Sci Int. 2001; 117:23–30.
10. Steyn M, Işcan MY. Osteometric variation in the humerus: sexual dimorphism in South Africans. Forensic Sci Int. 1999; 106:77–85.
11. Wu L. Sex discriminant analysis of long bones of upper limb. Acta Anthropol Sin. 1989; 8:231–239.
12. Holman DJ, Bennett KA. Determination of sex from arm bone measurements. Am J Phys Anthropol. 1991; 84:421–426.
13. Ross AH, Manneschi MJ. New identification criteria for the Chilean population: Estimation of sex and stature. Forensic Sci Int. 2011; 204:206.e1–206.e3.
14. Soni G, Dhall U, Chhabra S. Determination of sex from humerus: discriminant analysis. Aust J Forensic Sci. 2013; 45:147–152.
15. Choksi A, Babu GR, Dahiya MS. Study on the primary characteristics of identification: estimation of stature from palm length among the native Guajarati population. NHL J Med Sci. 2014; 3:13–17.
16. McCoy MW, Bolker BM, Osenberg CW, Miner BG, Vonesh JR. Size correction: comparing morphological traits among populations and environments. Oecologia. 2006; 148:547–554.
17. Charisi D, Eliopoulos C, Vanna V, Koilias CG, Manolis SK. Sexual dimorphism of the arm bones in a modern greek population. J Forensic Sci. 2011; 56:10–18.
18. Milner GR, Boldsen JL. Humeral and femoral head diameters in recent white American skeletons. J Forensic Sci. 2012; 57:35–40.
19. Uzün I, Işcan MY, Celbiş O. Forearm bones and sexual variation in Turkish population. Am J Forensic Med Pathol. 2011; 32:355–358.
20. De Villiers H. The skull of the South African Negro: a biometrical and morphological study. Johannesburg: Witwatersrand University Press;1968.
21. de Beer Kaufman P. Variation in the number of presacral vertebrae in Bantu-speaking South African Negroes. Am J Phys Anthropol. 1974; 40:369–374.
22. Lundy JK. Selected aspects of metrical and morphological infracranial skeletal variation in the South African Negro [dissertation]. Johannesburg: University of the Witwatersrand;1983.
23. Franklin D, O'Higgins P, Oxnard CE. Sexual dimorphism in the mandible of indigenous South Africans: a geometric morphometric approach. S Afr J Sci. 2008; 104:101–106.
24. Martin R, Saller K. Lehrbuch der Anthropologie in systematischer Darstellung, mit besonderer Berücksichtigung der anthropologischen Methoden. Stuttgart: G. Fischer;1959.
25. Bass WM. Human osteology: a laboratory and field manual of the human skeleton. Columbia: Missouri Archaeological Society;1971.
26. Devi R, Thakar MK, Nath S. Estimation of humeral length from its fragmentary dimensions. Hum Biol Rev. 2014; 3:15–24.
27. Saini V, Srivastava R, Rai RK, Shamal SN, Singh TB, Tripathi SK. Mandibular ramus: an indicator for sex in fragmentary mandible. J Forensic Sci. 2011; 56:Suppl 1. S13–S16.
28. Wankhede KP, Bardale RV, Chaudhari GR, Kamdi NY. Determination of sex by discriminant function analysis of mandibles from a Central Indian population. J Forensic Dent Sci. 2015; 7:37–43.
29. Saini V, Srivastava R, Rai RK, Shamal SN, Singh TB, Tripathi SK. An osteometric study of northern Indian populations for sexual dimorphism in craniofacial region. J Forensic Sci. 2011; 56:700–705.
30. Mahakkanukrauh P, Sinthubua A, Prasitwattanaseree S, Ruengdit S, Singsuwan P, Praneatpolgrang S, Duangto P. Craniometric study for sex determination in a Thai population. Anat Cell Biol. 2015; 48:275–283.
31. Manchanda AS, Narang RS, Kahlon SS, Singh B. Diagonal tooth measurements in sex assessment: a study on North Indian population. J Forensic Dent Sci. 2015; 7:126–131.
32. Işcan MY, Loth SR, King CA, Shihai D, Yoshino M. Sexual dimorphism in the humerus: a comparative analysis of Chinese, Japanese and Thais. Forensic Sci Int. 1998; 98:17–29.
33. Lee JH, Kim YS, Lee UY, Park DK, Jeong YG, Lee NS, Han SY, Kim KY, Han SH. Sex determination using upper limb bones in Korean populations. Anat Cell Biol. 2014; 47:196–201.
34. Ríos Frutos L. Metric determination of sex from the humerus in a Guatemalan forensic sample. Forensic Sci Int. 2005; 147:153–157.
35. Patil G, Kolagi S, Ramadurg U. Sexual dimorphism in the humerus: south Indians. J Clin Diagn Res. 2011; 5:538–541.
36. Shehri FA, Soliman KE. Determination of sex from radiographic measurements of the humerus by discriminant function analysis in Saudi population, Qassim region, KSA. Forensic Sci Int. 2015; 253:138.
37. Soni G, Dhall U, Chhabra S. Determination of sex from femur: discriminant analysis. J Anat Soc India. 2010; 59:216–221.
38. Aboul-Hagag KE, Mohamed SA, Hilal MA, Mohamed EA. Determination of sex from hand dimensions and index/ring finger length ratio in Upper Egyptians. Egypt J Forensic Sci. 2011; 1:80–86.
39. Ali DM, Elbaky FA. Sex identification and reconstruction of length of humerus from its fragments: an Egyptian study. Egypt J Forensic Sci. 2016; 6:48–55.
TOOLS
Similar articles