

 PDF
PDF ePub
ePub Citation
 Print
Print


Introduction
Stroke is caused by occlusion of the blood supply in the brain after 6~8 minutes, thereafter proceeding to irreversible neurologic degeneration. After the initial ischemic injury, a compromised blood-brain barrier coupled with expression of adhesion molecules by the vascular endothelial cells permits an influx of peripheral immune cells, including macrophages, neutrophils, leukocytes, and T and B cells (Emsley et al., 2003). This influx of peripheral immune cells into the brain exacerbates the local brain inflammatory response, leading to infarction (the process of tissue death [necrosis] caused by blockage of the tissue's blood supply) with enhanced neurodegeneration. Also, the altered splenic function and increased pro-inflammatory cytokines are shown after stroke (Gendron et al., 2002; Offner et al., 2006; Vendrame et al., 2006).
Previous studies have demonstrated altered splenic function after a stroke and increased circulating pro-inflammatory cytokines (Gendron et al., 2002; Offner et al., 2006; Vendrame et al., 2006). The infiltrating cells and increased pro-inflammatory cytokines negatively affect stroke outcome (Lucas et al., 2006).
Norepinephrine and β2-adrenergic receptor stimulation from infection and injury has been strongly implicated in the regulation of the immune response (Kohm & Sanders, 2001), and it is conceivable that brain injury might also transmit sympathetic signals to the spleen.
Agmatine is formed by the decarboxylation of L-arginine by arginine decarboxylase (Yang & Reis, 1999). Agmatine is an endogenous clonidine-displacing substance, an agonist for the á2-adrenergic and imidazoline receptors, and an antagonist at N-methyl-D-aspartate (NMDA) receptors (Reynolds, 1990; Li et al., 1994; Piletz et al., 1995). Agmatine also inhibits the release of norepinephrine from presynaptic terminals (Molderings et al., 2002) and can inhibit the induction of inducible NOS (iNOS) by inflammatory stimuli (Auguet et al., 1995; Regunathan & Piletz, 2003). However, the exact mechanism underlying the neuroprotective effect of agmatine is unclear, but it may be related to the ability of agmatine to inhibit the induction of iNOS and to block the NMDA receptor.
The spleen accommodates the efficient phagocytosis and recycling of iron, the capture and destruction of pathogens, and the induction of adaptive immune responses. These discrete functions are uniquely combined in one organ through compartmentalization into different regions with adaptations that are not observed in other lymphoid organs. The function of the white pulp is to promote adaptive immune responses to bloodborne antigens. These antigens are delivered into the marginal sinus by circulating dendritic cells, or are sampled by the macrophages in the marginal zone. The anatomic arrangements of the APCs, B cells, and T cells promote the interactions required for the efficient development of immune responses.
The purpose of the present study was to determine the morphologic changes of the rat spleen after transient cerebral ischemia by agmatine treatment and to verify splenic immune responses after transient cerebral ischemia with or without agmatine treatment by confirming the changes in the expression of CD11b+ macrophages, CD4+CD25+ regulatory T (T reg) cells, and CD8+ cytotoxic T lymphocytes (CTLs).
Materials and Methods
Animals
Male Sprague Dawley (SD) rats (weighing 380~400 g; 13~14 weeks of age) were used for all experiments. All animal procedures were carried out according to a protocol approved by the Yonsei University Animal Care and Use Committee in accordance with NIH guidelines. Three groups of animals were established: normal control (N=4), experimental control (N=4), and agmatine treatment (N=4).
Transient cerebral ischemia rat model
Animals were anesthetized with Zoletil (tiletamine hydrochloride, 300 mg/kg) intramuscularly. The depth of anaesthesia was assessed by toe pinch, and the rectal temperature was monitored during transient middle cerebral artery occlusion. Transient cerebral ischemia was induced using an occluding intraluminal suture, as previously described (Kim et al., 2004). Briefly, an uncoated 4.0 nylon monofilament suture with a round tip was inserted into the arteriotomy and advanced under direct visualization into the internal carotid artery, 20 mm from the bifurcation, to occlude the ostium of the middle cerebral artery. After 1 hour, the suture was withdrawn and the surgical incisions were closed. Agmatine (100 mg/kg; Sigma) were injected intraperitoneally at the end of occlusion after the suture was removed. The experimental control group received saline using the same method. After 23 hours, these animals were sacrificed for analysis.
Infarct volume quantification
The brain was removed and consecutively sectioned in 2-mm thicknesses. The 2nd, 4th, and 6th sections of a total of 6 coronal serial sections were stained with 2% triphenyl tetrazolium chloride (TTC) solution for 30 min at 37℃ after fixation with 4% paraformaldehyde. Brain swelling and infarction volumes were determined using a computerized image analysis system (Image J, NIH image, version 1.36). The volume of infarction was expressed as a percentage of the total brain volume and the volumes of the contralateral and ipsilateral hemispheres were similarly expressed.
Sample preparation
The intact spleens were extirpated and fixed in 4% paraformaldehyde and immersed in serial solutions of 20% and 30% saccharose at 4℃ with constant shaking on a shaker. The tissues were embedded in a special tissue protecting Alginate embedding material (Histomer; Histotech, Egaa, Denmark) and coronally-sectioned in 2-mm thicknesses. Alternate tissue slices were obtained for analysis. The spleens of the experimental control, agmatine treatment, and normal control groups were sectioned into 16~18 pieces, 14~16 pieces, and 8~9 pieces, respectively. The tissue slices were embedded in OCT compound and sectioned in 40-µm thicknesses to obtain 10 consecutive serial sections from each tissue slice using a cryotome.
Histologic staining and immunohistochemistry
The first tissue section was stained with hematoxylin-eosin. Single eosin staining was adequately done in a second tissue section to measure the white and red pulp areas of the spleen. Eosin-stained spleen sections were photographed in the gray mode using a digital camera under a microscope. White and red pulp areas were distinguished and calculated using a computerized image analysis system (Image J, NIH image, version 1.36).
For immunohistochemical analysis, frozen sections of the spleen were stained with monoclonal anti-CD11b antibodies (Serotec, Oxford, UK) and polyclonal anti-CD8+ (BD, CA, USA) antibodies against surface antigens of cytotoxic T lymphocytes, followed by reaction with an appropriate biotinylated secondary antibody. Staining was done using an ABC kit (Vector, CA, USA; Lee et al., 2001), then diaminobenzidine (DAB; Sigma) was used as a chromogen. To determine the number of T reg cells in the white pulp area, splenic tissue was double immune-stained with anti-CD4+ and CD25+ antibodies (BD), followed by an appropriate biotinylated secondary antibody. Stains were visualized using an ABC-AP kit (Vector) with BCIP/NBT and Fast Red substrates.
Cell count and unbiased stereologic analysis
To assess CD11b, CD8, or CD4, CD25-positive cells in the white plup of the spleen were counted with an optical fractionator (West, 1993). The CAST grid system was equipped with an Olympus BX51 microscope, a motorized microscope stage run by an IBM-compatible computer, and a microcator (Olympus, Japan) connected to the stage to provide distance information for the z-axis (Kim et al., 2006; Garcia et al., 2007). The entire white pulp of the spleen, with the exception of the red pulp of spleen, was delineated with a 1.25× objective and a counting grid of 300×300 µm. An unbiased counting frame of known area (48.6×36.1 µm= 1757 µm2) superimposed on the image was placed randomly over the first counting area and moved systematically over all counting areas until the entire delineated area was sampled. The stereologic cell counting method was a 3-dimensional image system and cells on the green line were counted, but cells on the red line were not counted. The area sampling fraction was 1.89%. The section thickness was 40 µm.
Statistical analysis
Statistical tests to determine differences between 3 groups were performed by a one-way ANOVA (Student-Newman-Keuls multiple-range test) using SPSS, version 13.0 (SPSS, Chicago, IL, USA). A p value<0.05 was considered significant. Data are expressed as the mean±standard error of the mean (SEM).
Results
Infarction area on cerebral ischemia
Rat brain tissue was stained by TTC staining (Fig. 1) for the evaluation of the infarct area. The infarction area was analyzed 23 hours after transient cerebral ischemia. The infarction area was significantly reduced (5.51±1.63% of the entire brain) in the agmatine treatment group compared to 15.02±4.28% in the entire brain in the experimental control group (Table 1). The brain swelling volume [ipsilateral hemisphere volume/contralateral hemisphere volume×100 (%)] was also reduced in the agmatine treatment group compared to the experimental control group (Table 1). The infarction area was expressed as a percentage of the total area of the brain 23 hours after transient cerebral ischemia and the values are presented in Table 1.
The changes in red and white pulp areas of the rat spleen 23 hours after transient cerebral ischemia
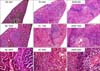
Clearly segregated red and white pulp was shown in the normal control group with hematoxylin-eosin staining. The red pulp had no blood overbrimming in the normal control group. In the experimental control group, overbrimmed blood was noted and a large number of erythrocytes were shown inside the vessels. The white pulp area was rare and not clear compared to the normal control and agmatine treatment groups (Fig. 2).
Under high magnification, sinusoidal capillaries around the PALS and the mantle zone appeared wide in the experimental control group compared to the agmatine treatment group. In the agmatine treatment group, the red and white pulp map was clearly distinguished with hematoxylin-eosin staining and the area of the white pulp in the spleen was increased compared to the experimental control group. Under high magnification, the mantle and marginal zones in the agmatine treatment group appeared thick compared to the experimental control group (Fig. 2).
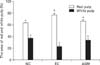
The white pulp area of the spleen was 92.18±3.52 mm2 in the experimental control group and 130.726±18.884 mm2 in the agmatine treatment group. The white pulp area in the agmatine treatment group was similar to the normal control group (149.879±9.574 mm2). The red pulp area was significantly increased in the experimental control group compared to the normal control and agmatine treatment groups. However, the white pulp area was significantly increased in the agmatine treatment group compared to the experimental control group (Fig. 3).
The evaluation of exposed macrophages in the white pulp area with anti-CD11b monoclonal antibody
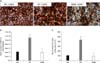
Under low magnification (12.5X) under a stereologic microscope, the white pulp area of the spleen appeared to be surrounded by red pulp. The number of CD11b+ macrophages which stained deep brown was analyzed by the CAST counting analysis method. The red and white pulp areas of the rat spleen tissue were clearly distinguished in the normal control and agmatine treatment groups with immunohistochemial staining with anti-CD11b antibody, but not in the experimental control group (Fig. 4A).
The total number of CD11b+ macrophages was 42,768,959.43±12,498,370 in the normal control group and the number of CD11b+ macrophages per unit volume was 103.77±31.19 cells/mm3. In the experimental control group, the total number of CD11b+ macrophages in the white pulp area was increased to 111,268,135.09±61,349,219.9, and the number of CD11b+-positive cells per unit volume was also increased to 428.8±241.01 cells/mm3 compared to the normal control group. This elevation was reduced in the agmatine treatment group. The number of CD11b+ macrophages in the agmatine treatment group was significantly decreased to 39,213,403.88±23,167,840.6, and the number of CD11b+-positive cells per unit volume was decreased to 95.65±38.87 cells/mm3 compared to the experimental control group (Fig. 4B, C).
Evaluation of exposed T reg cells of the white pulp area with anti-CD4+CD25+ antibodies
The activated T reg cells in the white pulp area were immunostained with the double staining method using anti-CD4+ and anti-CD25+ antibodies. Anti-CD4+ antibody for CD4+ T cells was developed with NABP/FR reagent (red color) and anti-CD25+ antibody for CD25+ T cells with BCIP/NBT reagent (blue color).
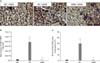
The CAST counting analysis data displayed that CD4+CD25+ double-positive T reg cells were few in number in the normal control group, but a greater number of double-positive cells was detected in the vessels (Fig. 5A).
The total number of CD4+CD25+ T reg cells was 395,061.72±78,936.72 and the number of CD4+CD25+ T reg cells per unit volume was 1.09±0.23 cells/mm3 in the normal control group. The total number of CD4+CD25+ T reg cells was clearly increased in the white pulp of the spleen to 7,677,363.69±2,172,451.44 and the number of CD4+CD25+ T reg cells per unit volume was increased to 29.78±8.43 cells/mm3 in the experimental control group compared to the normal control group. The total number of CD4+CD25+ T reg cells were markedly reduced by agmatine treatment to 312,169.31±47,687.58 and the number of CD4+CD25+ T reg cells per unit volume was reduced to 0.98±0.16 cells/mm3 similar to the number in the normal control group (Fig. 5B, C).
Evaluation of exposed cytotoxic T lymphocytes (CTLs) of the white pulp area with anti-CD8+ monoclonal antibody
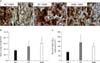
CTLs were detected using anti-CD8+ monoclonal antibody and were developed with the DAB reaction and analyzed by CAST counting analysis. CD8+ CTLs were in rows along the vessels in the white pulp area of the rat spleen (Fig. 6A).
The total number of CD8+ CTLs in the white pulp area of the whole spleen was 35,723,104.06±3,292,321.16 in the normal control group. The number of CD8+ CTLs in the experimental group was increased to 49,215,014.19±19,326,026.17 and a further increase to 60,758,377.43±20,065,259.45 cells was observed in the agmatine treatment group (Fig. 6B).
The number of CD8+ CTLs per unit volume was 89.27±17.32 cells/mm3 in the normal control group. The number in the experimental control group was increased to 189.75±75.85 cells/mm3 compared to the normal control group, but the increase was not significant. However, agmatine treatment also reduced the number of CD8+ CTLs per unit volume to 151.44±29.94 cells/mm3 and the increase was also not significant (Fig. 6C).
Discussion
In this study, we moved our focus for studying the effect of agmatine on cerebral ischemia from the brain to the spleen (the core of immune reactions). The spleen could contribute to the expansion of infarct size after a stroke through activation of the sympathetic nervous system, resulting in splenic contraction and a potential release of red and white blood cells (Stewart & McKenzie, 2002). This contraction causes a release of pro-inflammatory immune cells, which are attracted to the brain by cytokines induced by stroke.
After a stroke, the splenic reservoir and filtration are enhanced and active macrophages are increased, and brain inflammation was induced in the experimental control group. Macrophages do not only present antigens to helper T cells, phagocytose, and secrete pro-inflammatory cytokines, but also initiate immune response reaction, activation, suppression, and termination (Batbaatar, 2007). In our study, the total number of CD11b+ macrophages was higher in the experimental control and agmatine treatment groups; the total number of CD11b+ macrophages was decreased. However, the splenic red pulp area was enlarged to 77.07% with activity of the splenic reservoir and filtration function and the white pulp area was reduced to 23.3% in the experimental control group compared to the normal control group. Agmatine treatment decreased the expansion of red pulp to 66.6% and reduced the contraction of the white pulp area to 34.26%, similar to the normal condition 23 hours after transient cerebral ischemia. Also, PALS and the mantle zone were thickened in the agmatine treatment group compared to the experimental control group. The peri-arteial lymphoid sheaths and marginal zones are predominantly composed of T lymphocytes. A few T cells are scattered in germinal centers and in the mantle zones. T helper cells predominate in these areas with a ratio of T helper-to-T suppressor cells of 3 : 1 to 4 : 1. There is some spill over of T cells into the red pulp. Red pulp T cells are mainly suppressor/cytotoxic cells. Only occasional suppressor cells are found in the PALS, and they are virtually absent from the germinal centers (Wolf & Neiman, 1987).
After stroke, there is a depression of the immune system, often resulting in infection and subsequent death. This complication that the change of spleen after stroke may induce post-stroke infection is not well-studied in the field. In a mouse transient cerebral ischemia model, post-stroke immunodeficiency was caused by activation of the sympathetic nervous system and a systemic apoptotic loss of interferon gamma-secreting T lymphocytes (Prass et al., 2003). Sakaguchi et al. (1995) rekindled interest in the concept of T-cell-mediated suppression in the mid-1990s by showing that a minor population (~10%) of CD4+ T cells, which co-expresses the interleukin-2 receptor (IL-2R) α-chain (CD25), is crucial for the control of autoreactive T cells in vivo. Subsequent in vitro studies by several groups showed that CD4+CD25+ T cells are both hyporesponsive and suppressive (Takahashi et al., 1998; Thornton & Shevach, 1998). CD4+CD25+ T cells were discovered originally in mice, but a population with identical phenotypic and functional properties has been defined recently in humans (Levings et al., 2001). Although the term 'regulatory T cell' was replaced by the term 'suppressor T cell' in the immunology literature, T reg cells might enhance or suppress immune responses. T reg cells recognize self-antigens, and are generated by recognition of self-antigens. In many experimental models, the function of T reg cells also appears to depend on the cytokine, TGFβ, which inhibits the responses of CD4+ T cell, CD8+ T lymphocytes, and macrophages (Abbas, 2007). In our present study, the number of T reg cells was increased in the experimental control group 23 hours after transient cerebral ischemia, suggesting that the systemic immune response was reduced, so the possibility of post-stroke infection will increase. Agmatine treatment reduced the number of T reg cells in the white pulp of the spleen, so the chance of post-stroke infection may be reduced.
It could be expected that induced inflammatory cells from the spleen were pierced through the blood-brain barrier and entered into the ischemic injured site, these blood elements were exposed by microglia, such as an autoantigens, and against these autoantigens autoimmune reaction was activated and increases the number of T reg cells. Agmatine has been reported to block the blood-brain barrier disruption by suppressing the expression of matrix metalloproteinase after transient cerebral ischemia (Kim et al., 2008). It is possible to explain that the number of CD4+CD25+ T reg cells per volume was reduced to 0.98±0.16 cells/mm3 in the agmatine treatment group compared to the experimental control group (29.78±8.43 cells/mm3).
The CD8 antigen is a cell surface glycoprotein found mostly on cytotoxic T lymphocytes that mediates efficient cell-to-cell interactions within the immune system. CD4+ T cells and CD8+ T cells recognize peptides that are derived from protein antigens and presented by professional APCs (macrophages) into the spleen. Differentiated CTLs are capable of secreting cytokines, mostly IFNγ, lymphotoxin, and TNF, which function to activate phagocytes and induce inflammation.
CD8+ CTLs effector functions by directly attacking infected cells, whereas a single CD4+ helper cell may secrete cytokines that activate many effector cells, such as macrophages, and therefore a greater number of CTLs may be needed for protective immunity. In our experiment, the number of CD8+ CTLs per unit volume was increased 23 hours after transient cerebral ischemia, but agmatine treatment cannot significantly affect the number of CD8+ CTLs per unit volume.
In conclusion, agmatine treatment reduced the contraction of white pulp in the spleen and decreased the number of macrophages in the white pulp of the spleen, leading to reducing brain infarction through minimizing neuroinflammation after stroke. In addition to reducing brain infarction after stroke, agmatine treatment reduced the number of T reg cells in the white pulp of the spleen, proving that agmatine treatment can lessen the danger of post-stroke infection from depression of the immune system after stroke.


 XML Download