

 PDF
PDF ePub
ePub Citation
 Print
Print


INTRODUCTION
Observation of in vivo metabolism with 1H magnetic resonance spectroscopy and spectroscopic imaging (MRS, MRSI) can provide detailed information on molecular concentrations of various key neurochemicals such as creatine (12), choline (34), N-acetylaspartic acid (NAA) (567) and γ-aminobutyric acid (GABA) (89), and has been applied for diagnosis and observation of treatment responses in patients with various types of cancers. Furthermore, recent advent of dissolution-based dynamic nuclear polarization (DNP) method (10) has allowed spectroscopic acquisition, metabolism quantification and even in vivo imaging of metabolites labeled with 13C. Direct spectroscopic examination of metabolic pathways of 13C molecules for both normal and diseased tissues utilizing this new technical breakthrough has shown great clinical potential in the last decade (111213). Hyperpolarized 13C MRS studies were primarily focused on utilizing lactate dehydrogenase (LDH)-catalyzed 13C label exchange between injected hyperpolarized [1-13C] pyruvate and [1-13C] lactate and also [1-13C] alanine via alanine aminotransferase (14).
Some research also investigated quantifying and modeling these metabolic processes, and has shown that conserving the hyperpolarized magnetization of the substrate and increasing the metabolic product peak signal to noise ratio (PSNR) can potentially benefit accurate kinetic modeling (1516171819). This is especially important for in vitro experiments since cell number counts are likely to be limited relative to the in vivo case. Downstream metabolic products' PSNR can therefore be significantly lower compared to in vivo environment, making accurate measurement and quantification of the metabolism kinetics difficult. Also, partly due to low PSNR, signals from the downstream metabolites are likely to be contaminated by neighboring resonances with higher signal, leading to overestimation during quantification process, and it is unclear how much the quantification process is affected.
In this work, an approach for performing in vitro hyperpolarized 13C MRS is presented. Experiments with tumor cell aggregate were performed to quantify the cell line's metabolism characteristics regarding LDH-catalyzed 13C label exchange between [1-13C] pyruvate and [1-13C] lactate. To overcome limitations arising from in vitro settings, a simple MRS acquisition method which utilizes spectrally-selective excitation radiofrequency (RF) pulse with variable flip angles was developed, which allowed frequency-interleaved acquisition of metabolites in question. Numerical simulations were performed to assess the proposed method's effectiveness in terms of calculating exchange rate constants, and a modified version of the two-site exchange model was formulated for accurate quantification of the acquired data.
MATERIALS AND METHODS
Modified Two-Site Exchange Model
For quantitative analysis of the acquired data, the two-site exchange model (20) which associates label exchange between two metabolites (i.e., pyruvate and lactate) was modified and used. The model is generally known as follows (21):
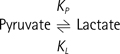
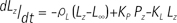
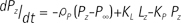
Where KP and KL refers to rate constants by which pyruvate and lactate convert to each other, respectively; Lz and Pz are the z-magnetization of the 13C nucleus in the lactate and pyruvate carboxyl carbons; ρL and ρP are the spin-lattice relaxation rates (1/T1(L,P)); and L∞ and P∞ are the equilibrium magnetizations (at t = ∞) of lactate and pyruvate. This relationship is true assuming that there is no extra input of the substrate (i.e. [1-13C] pyruvate) and the product (i.e. [1-13C] lactate) from other sites. Here, the effect of excitation flip angles and T1 relaxation is not considered. Since the proposed method involves spectrally-interleaved acquisition of signals from metabolites at every repetition time (TR) with different flip angles, the 'missing' data for pyruvate and lactate at every TR must be accounted for in Eq. [2-3]. Since the initial 13C-labelled lactate pool is close to zero and the reverse label exchange from 13C lactate to 13C pyruvate will be very small relative to the forward label exchange, Eq. [2] and Eq. [3] can be approximated assuming that the conversion rate from lactate to pyruvate (KL) is zero. Discretizing the expressions with respect to each TRs, we get:
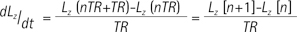
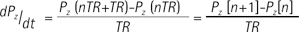
where Lz and Pz represents the magnetization of lactate and pyruvate, TR represents the repetition time, and n refers to the nth TR starting from 1. Then, the modified two-site exchange model can be expressed as follows:
Here, θL and θP represent excitation flip angles for lactate and pyruvate, respectively. Rewriting Eq. [6] and Eq. [7] and dividing them into odd and even TRs:
Now using Eq. [8] to Eq. [11], the unmeasured data and the constants KP, KL, and ρ can be iteratively estimated.
Simulations
Simulations were performed to compare the quantification accuracies of the proposed alternating acquisition method and conventional non-selective, constant flip angle excitation scheme. Two acquisition methods were compared over varying noise levels and KP values, while using 1° and 20° flip angles for pyruvate and lactate in the proposed method, and using constant 5° flip angle for the non-selective case. Dynamic curves of pyruvate and lactate were simulated using the modified Bloch equation, then KP values from each cases were calculated. Then the results were compared to the true value. All numerical simulations and data analysis were done using MATLAB 2014a (Mathworks, Natick, MA, USA).
Excitation RF and MR Pulse Sequence
To enable spectrally-selective excitation, a narrow-band excitation RF pulse was designed using finite impulse response (FIR) filter design method (22). The required spectral bandwidth of the excitation RF pulse was determined from 13C spectra obtained from previous in vitro studies conducted under similar 3T environment. Typical peak resonances of [1-13C] pyruvate and its metabolic products showed approximate linewidth of 15 Hz at FWHM, which required the RF passband to be wider than 15 Hz. Also, because the proximity of [1-13C] lactate and [1-13C] pyruvate-hydrate peaks (Δf ≈ 120 Hz) prevents accurate measurement and quantification of converted lactate due to pyruvate-hydrate baseline, the RF stopband was designed to be less than 100 Hz to ensure selective excitation. The FWHM of the designed RF pulse resulted in ≈ 120 Hz with duration of 20.0 ms.
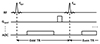
Next, the narrow-band RF excitation pulse was implemented into a free-induction decay chemical shift imaging (FIDCSI) sequence as shown in Figure 1. Since the implemented excitation RF pulse has narrow passband, spectrally-selective excitation was achieved via interleaving the transmit frequency of the RF excitation pulse between [1-13C] pyruvate and [1-13C] lactate resonances at every TRs. Also, by varying the flip angle between the two resonances, relatively low SNR of product lactate was compensated. Flip angles were alternated between 1° for pyruvate and 20° for lactate.
For in vitro application of the proposed method, [1-13C] pyruvic acid (Cambridge Isotope, Tewksbury, MA, USA) doped with 15 mM Trityl radical OX-063 (Oxford Instruments, Oxford, UK) and 1.5 mM Dotarem (Guerbet, France) was hyperpolarized using HyperSense DNP polarizer (Oxford Instruments, Oxford, UK). After dissolution into aqueous state, 2.0 mL of the hyperpolarized substrate was injected into the test tube filled with 4.0 mL of LDH (15 U) and 60 uL of NADH (500 mM) solution over 9s. The amount of LDH used for the in vitro experiments was determined from separate experiments (data not shown) conducted to recreate typical hyperpolarized [1-13C] spectra obtained in normal in vivo cases. The test tube was placed inside the plastic holder structure made as part of the custom-built 13C-tuned solenoid coil prior to the injection. Tubing was placed inside the enzyme mixture and allowed thorough mixing during the substrate injection process. TR of 750 ms was used with 384 repetitions (192 acquisitions each for pyruvate and lactate) over 6.4 minutes of scan time. The procedure was repeated with a constant flip angle scheme using a hard excitation pulse (non-selective excitation) with 5° flip angle for comparison. All experiments were performed on a GE MR750 3T clinical MRI system (GE Healthcare, Waukesha, WI, USA) equipped with a broadband amplifier. The custom-built 13C-tuned solenoid coil was used for transmission and reception. The temperature of the test tube was maintained at around 36℃ using an external heater device for all in vitro experiments.
RESULTS
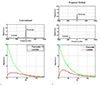
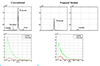
Representative simulated spectra comparing the conventional and the proposed method are shown in Figure 2. Compared to the conventional case (Fig. 2a, top), spectra of pyruvate and lactate using the proposed method are completely separated due to TR-interleaved spectrally-selective acquisition scheme (Fig. 2b, top). The PSNR of lactate is significantly improved in the averaged spectrum, with near 4-fold increase in the peak signal. Pyruvate, on the other hand, shows decreased peak signal level due to lower excitation flip angle. The dynamic curves (Fig. 2, bottom row) indicate that the lactate signal PSNR has generally increased over most TRs, and also that the hyperpolarized magnetization of pyruvate can be slightly prolonged by using the proposed method. The quantified Kp value from the dynamic curve were 0.0018 s-1 and 0.000982 s-1 for the conventional and proposed method, respectively.
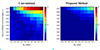
The simulation results show that the proposed method has better performance over most KP and noise ranges as shown in Figure 3. The estimation error generally increases in both cases for larger KP values, but the error increased noticeably in the constant case for when the KP value was small. Both methods displayed similar performance against increasing noise level. Although the noise level is less than 1% of the pyruvate signal, it is still significant since the lactate signal will be at a comparable range with respect to noise. The results are shown as error maps plotted as percent error relative to the input (known) KP values.
Averaged spectra from dynamic acquisition using conventional FIDCSI sequence and the proposed method is shown in Figure 4 (top row). Enzyme amounts were calibrated so that the resulting spectra would represent cases when cell number count is small. As shown in the conventional case (Fig. 4a), lactate signal is less than 1% of the averaged pyruvate signal. With the proposed method (Fig. 4b), spectra containing pyruvate and lactate are completely separated, with increased lactate signal PSNR. The increased lactate PSNR can be readily observed in the signal dynamic curves as well. Signal from pyruvate, on the other hand, is decreased due to lower excitation flip angle. To avoid transient-state conversion of pyruvate to lactate in the analysis with the two-site exchange model, data fitting was limited to 100 time points after the lactate's peak signal, and the T1 (ρ-1) of pyruvate and lactate were assumed to be equal (i.e. ρL = ρP in Eq. [3.8] ~ [3.11]). With the constant flip angle scheme, the proposed fitting method showed ρ of 72.7632 s-1 with KP = 0.0014 s-1 and KL = 0.0176 s-1. With the proposed acquisition method, ρ of 69.2214 s-1 with KP = 0.0024 s-1 and KL = 0.0162 s-1 was obtained.
DISCUSSION AND CONCLUSION
The error maps generated from simulation results show that the error in estimating Kp value can be up to 40% when using the conventional method (Fig. 3a). Over most noise and Kp value ranges, the proposed method seems to be more accurate. Whereas both methods show generally linear increase in the error with respect to increasing true Kp value and noise, it is notable that the error in the conventional case also slightly increased for low Kp and noise. Relating this to the product (lactate) PSNR, it can be said that low product PSNR is the dominating factor of quantification accuracy.
For the in vitro experiment, the small difference in the estimated T1 values could be due to the minor fluctuations in the pyruvate signal (Fig. 4b, bottom) possibly caused by unintended excitation from side-lobe of the 10° flip angle excitation pulses used in the even TR. Side-lobes from the excitation RF pulse could cause unintended excitation of the neighboring resonances such as pyruvate-hydrate or alanine. Although spectral encoding will resolve these signals into different peaks, limitations such as baseline contamination or cases where spectral resolution may not be sufficient could affect the quantification results. To reduce contaminating signals from such resonances, longer excitation RF pulses with narrower passbands and sharper transition bands may be used. However, using long RF pulses is limited by both the T2* of the metabolites and the FWHM of the resonance peaks. With typical T2* of ~22 ms (empirically measured, data not shown), long pulse width will compromise the PSNR. Therefore, these factors should be considered during optimal excitation RF pulse design.
Although in this study the exchange rate constants were calculated from the modified multi-site exchange model, the 'true' value for KP or KL is still debatable. As mentioned before, these values are dependent on various conditions such as cell-line characteristics, cellular activeness, delivery and distribution of the substrate/enzymes, etc. Although some of these are controllable during the experiment, dominating biological factors are in many cases beyond control. Another factor which affects the derivation of reaction rate kinetics is the multi-compartment model used. The results frequently become model-dependent and may vary significantly between models, even with same input data. Additionally, the robustness of these model-based approaches can be compromised by the arterial input function (AIF), and also by the chosen signal acquisition window. It was shown that error in AIF could have significant influence in estimating the apparent rate constants from kinetic modeling (23), and some have investigated methods for direct measurement of the AIF (24) or for minimization of its effect on kinetic modeling (252627). Also, it was shown that the calculated rate constants can vary depending on the signal acquisition timing (28), and that careful determination of optimal acquisition window is necessary for increasing the results' reproducibility. Another group has proposed model-free approach for analyzing the metabolism kinetics which is independent of the AIF or the formulated multi-compartment model (29). However, procuring the downstream products' PSNR is still crucial even for model-free approaches since the dynamic data is still used for the quantification process, which could benefit from the application of the proposed method.
In summary, a method for accurate quantification of hyperpolarized pyruvate and its product lactate focused for in vitro hyperpolarized 13C experiments was described. By using a narrow-band excitation RF pulses with alternating transmit frequency at every TR, metabolic product can be selectively excited with a higher flip angle for increased PSNR while the hyperpolarized magnetization of the substrate can be minimally perturbed with a low flip angle. Baseline signals from neighboring resonances can be effectively suppressed to accurately quantify the metabolism kinetics. Furthermore, with the modified version of the two-site exchange model, calculation of the rate constants associated with the conversion was also possible.
 XML Download