Abstract
The need to combine direct and indirect evidence is increasing in clinical fields, and this is especially true when direct evidence is inconclusive. Thus, in recent years, network meta-analysis has been utilized increasingly in medicine. Network meta-analysis is a statistical method that enables comparison of multiple treatments simultaneously— by combining direct and indirect evidence of the relative treatment effects— to assess the comparative effectiveness of multiple interventions even if there are no head-to-head comparisons. Network meta-analysis has some advantages in addressing all treatments for a specific condition, comparing interventions and ranking the efficacy and safety of multiple treatments, and increasing the certainty of evidence by pooling direct and indirect evidence to generate overall estimates. The major assumption in network meta-analysis is exchange-ability of the studies, and other key assumptions include similarity, consistency, and transitivity. The Bayesian approach is used most commonly in network meta-analysis because it provides greater flexibility that allows for the use of more complex models and can produce estimates of rank probabilities. Bayesian network meta-analysis produces treatment rankings according to the probability of being the best treatment, the second best, third best, and so forth. Network meta-analysis is an interesting method that provides useful information for use in by rheumatologists in decision-making.
REFERENCES
2. Caldwell DM, Ades AE, Higgins JP. Simultaneous comparison of multiple treatments: combining direct and indirect evidence. BMJ. 2005; 331:897–900.

3. Jansen JP, Crawford B, Bergman G, Stam W. Bayesian meta-analysis of multiple treatment comparisons: an introduction to mixed treatment comparisons. Value Health. 2008; 11:956–64.

4. Catalá-López F, Tobías A, Cameron C, Moher D, Hutton B. Network meta-analysis for comparing treatment effects of multiple interventions: an introduction. Rheumatol Int. 2014; 34:1489–96.

5. Lu G, Ades AE. Combination of direct and indirect evidence in mixed treatment comparisons. Stat Med. 2004; 23:3105–24.

6. Bucher HC, Guyatt GH, Griffith LE, Walter SD. The results of direct and indirect treatment comparisons in meta-analysis of randomized controlled trials. J Clin Epidemiol. 1997; 50:683–91.

7. Mavridis D, Giannatsi M, Cipriani A, Salanti G. A primer on network meta-analysis with emphasis on mental health. Evid Based Ment Health. 2015; 18:40–6.

8. Nikolakopoulou A, Chaimani A, Veroniki AA, Vasiliadis HS, Schmid CH, Salanti G. Characteristics of networks of interventions: a description of a database of 186 published networks. PLoS One. 2014; 9:e86754.

9. Dias S, Sutton AJ, Ades AE, Welton NJ. Evidence synthesis for decision making 2: a generalized linear modeling framework for pairwise and network meta-analysis of randomized controlled trials. Med Decis Making. 2013; 33:607–17.
10. Jansen JP, Naci H. Is network meta-analysis as valid as standard pairwise meta-analysis? It all depends on the distribution of effect modifiers. BMC Med. 2013; 11:159.

11. Dias S, Welton NJ, Sutton AJ, Caldwell DM, Lu G, Ades AE. Evidence synthesis for decision making 4: inconsistency in networks of evidence based on randomized controlled trials. Med Decis Making. 2013; 33:641–56.
12. Song F, Xiong T, Parekh-Bhurke S, Loke YK, Sutton AJ, Eastwood AJ, et al. Inconsistency between direct and indirect comparisons of competing interventions: meta-epi-demiological study. BMJ. 2011; 343:d4909.

13. Brown S, Hutton B, Clifford T, Coyle D, Grima D, Wells G, et al. A Microsoft-Excel-based tool for running and critically appraising network meta-analyses: an overview and application of NetMetaXL. Syst Rev. 2014; 3:110.

14. Sutton AJ, Abrams KR. Bayesian methods in meta-analysis and evidence synthesis. Stat Methods Med Res. 2001; 10:277–303.

15. Turner RM, Davey J, Clarke MJ, Thompson SG, Higgins JP. Predicting the extent of heterogeneity in meta-analysis, using empirical data from the Cochrane Database of Systematic Reviews. Int J Epidemiol. 2012; 41:818–27.

16. Koning A. Bayesian monte carlo method for nuclear data evaluation. Nuclear Data Sheets. 2015; 123:207–13.

17. Salanti G, Ades AE, Ioannidis JP. Graphical methods and numerical summaries for presenting results from multiple-treatment meta-analysis: an overview and tutorial. J Clin Epidemiol. 2011; 64:163–71.

18. Bhatnagar N, Lakshmi PV, Jeyashree K. Multiple treatment and indirect treatment comparisons: an overview of network meta-analysis. Perspect Clin Res. 2014; 5:154–8.

19. Hutton B, Salanti G, Caldwell DM, Chaimani A, Schmid CH, Cameron C, et al. The PRISMA extension statement for reporting of systematic reviews incorporating network meta-analyses of health care interventions: checklist and explanations. Ann Intern Med. 2015; 162:777–84.

20. König J, Krahn U, Binder H. Visualizing the flow of evidence in network meta-analysis and characterizing mixed treatment comparisons. Stat Med. 2013; 32:5414–29.

21. Chaimani A, Higgins JP, Mavridis D, Spyridonos P, Salanti G. Graphical tools for network meta-analysis in STATA. PLoS One. 2013; 8:e76654.

22. Davey Smith G, Egger M. Meta-analyses of randomised controlled trials. Lancet. 1997; 350:1182.
24. Ried K. Interpreting and understanding meta-analysis graphs: a practical guide. Aust Fam Physician. 2006; 35:635–8.
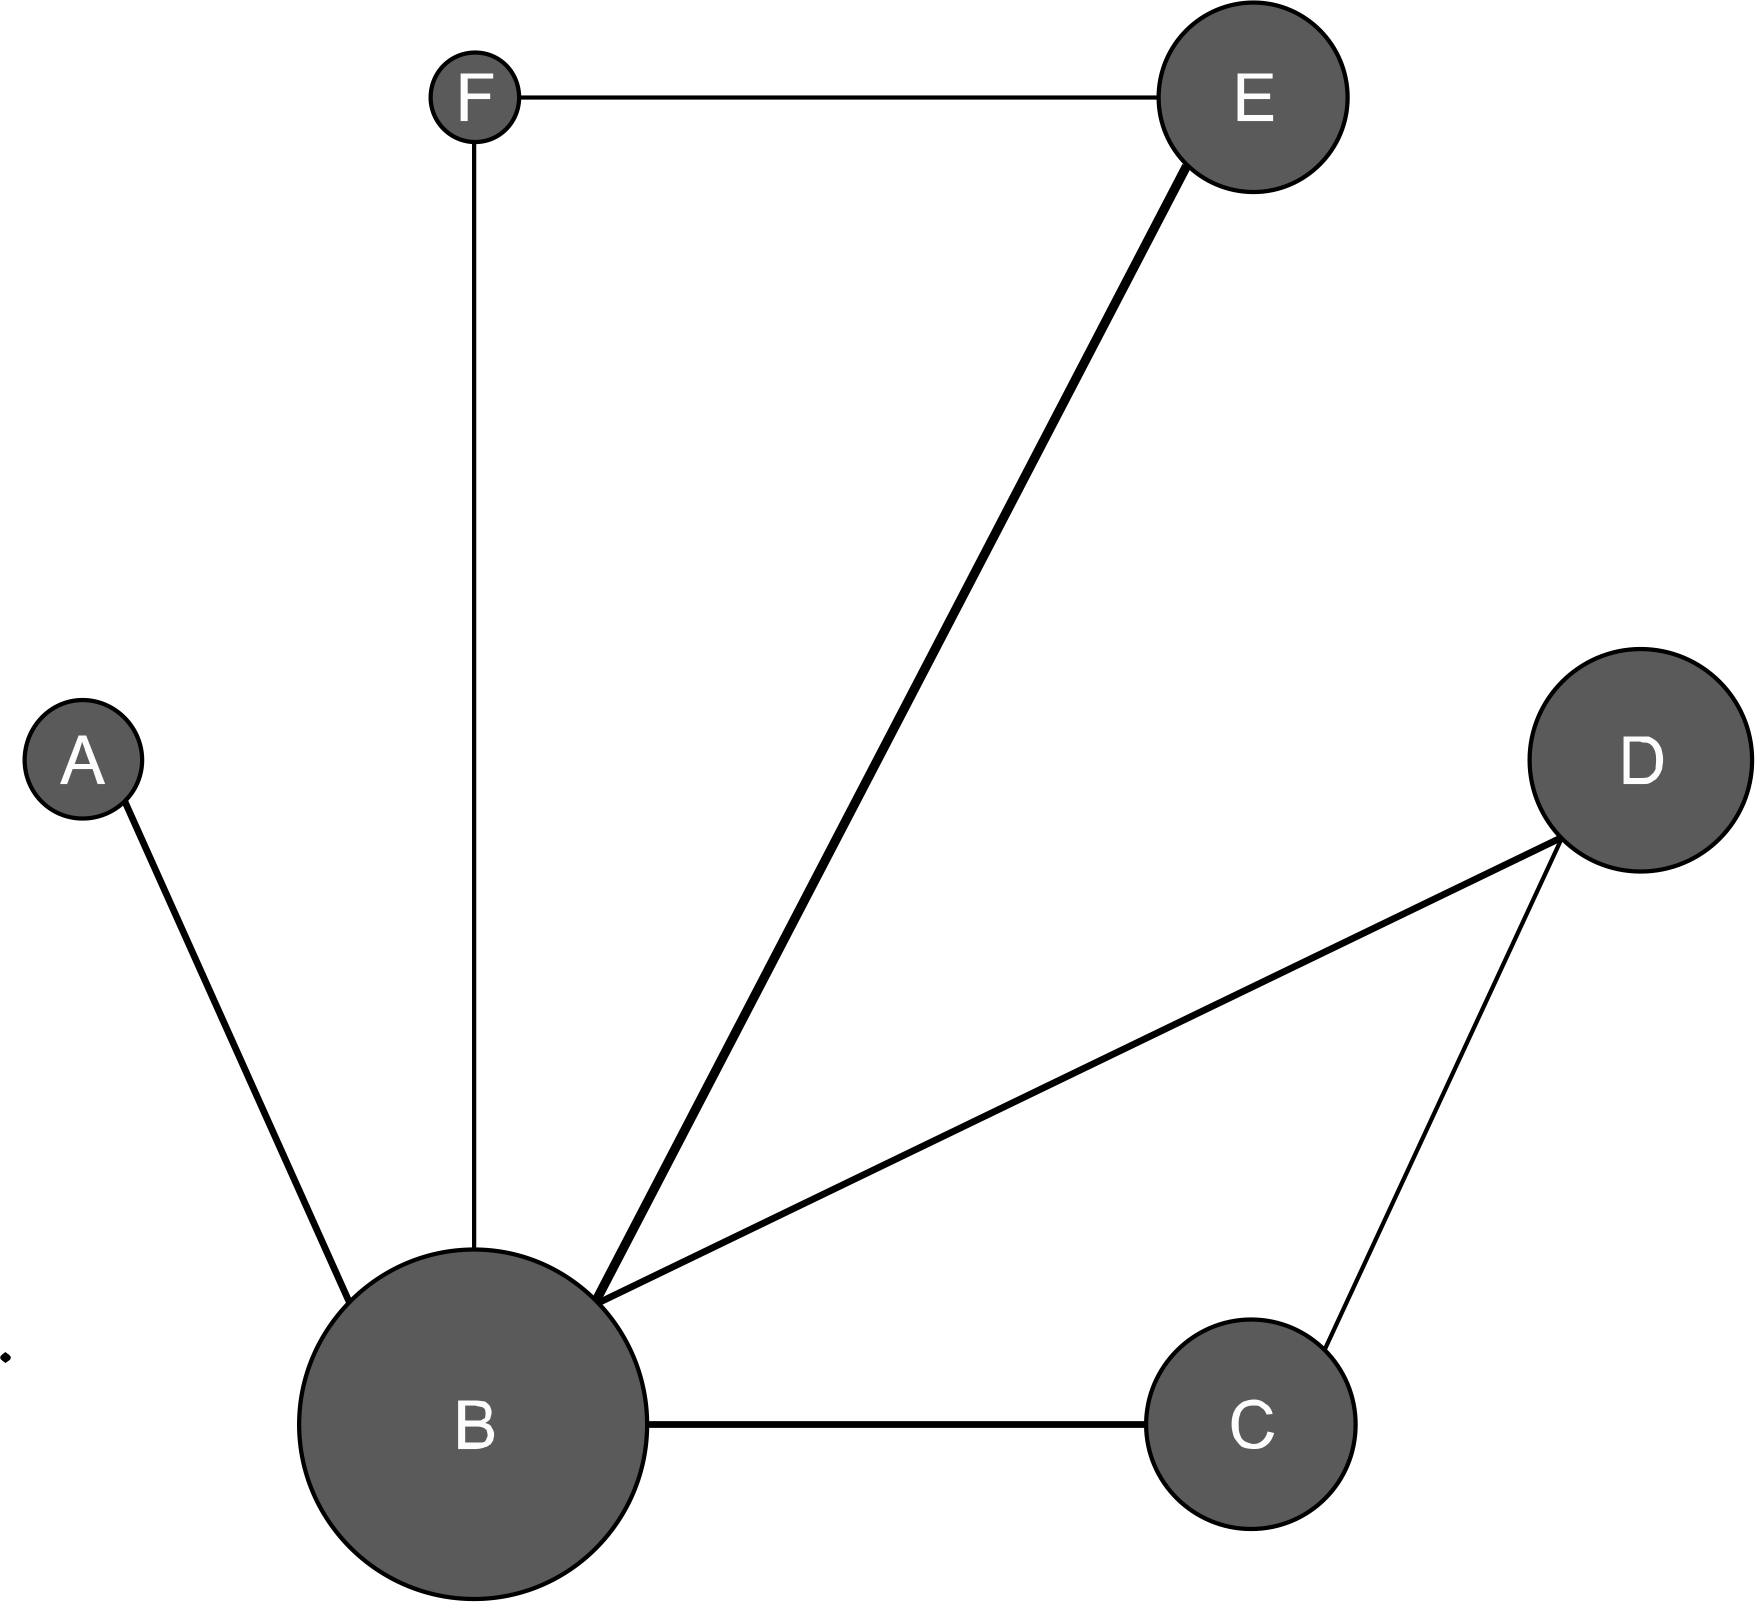
Figure 1.
Evidence network diagram of network meta-analysis comparisons. The width of each edge is proportional to the number of randomized controlled trials comparing each pair of treatments, and the size of each treatment node is proportional to the number of randomized participants (sample size).(A) Duloxetine 60 mg, (B) placebo, (C) milnacipran 200 mg, (D) milnacipran 100 mg, (E) pregabalin 300 mg, (F) pregabalin 150 mg.

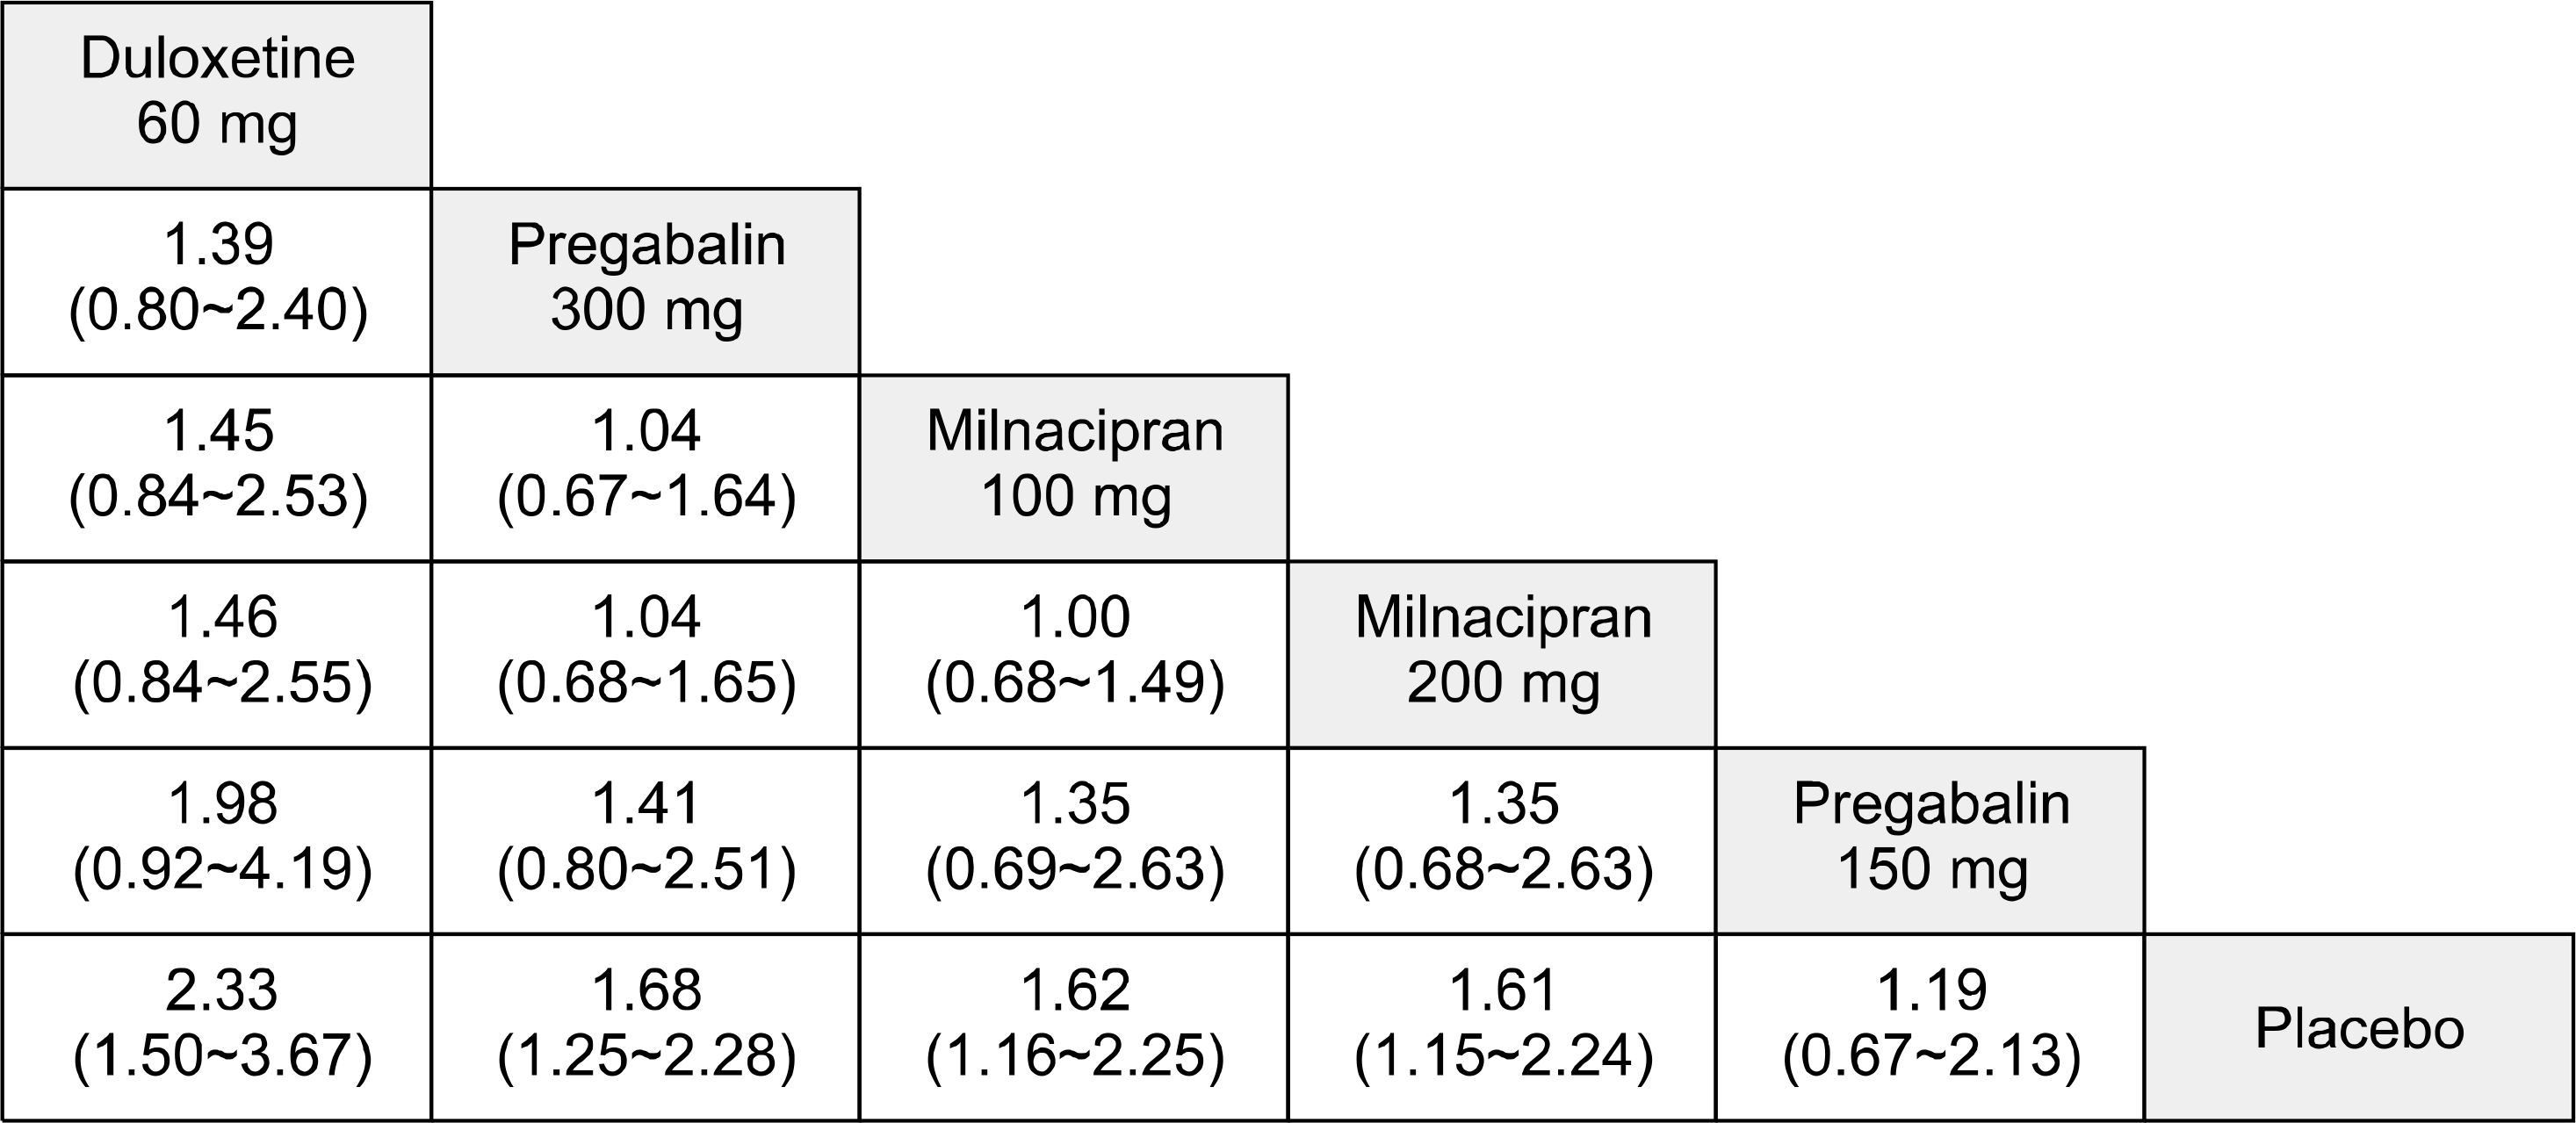
Figure 2.
League tables showing the results of the network meta-analyses comparing the effects of all drugs including odds ratios (OR) and 95% credible intervals. OR >1 means the top-left treatment is better.

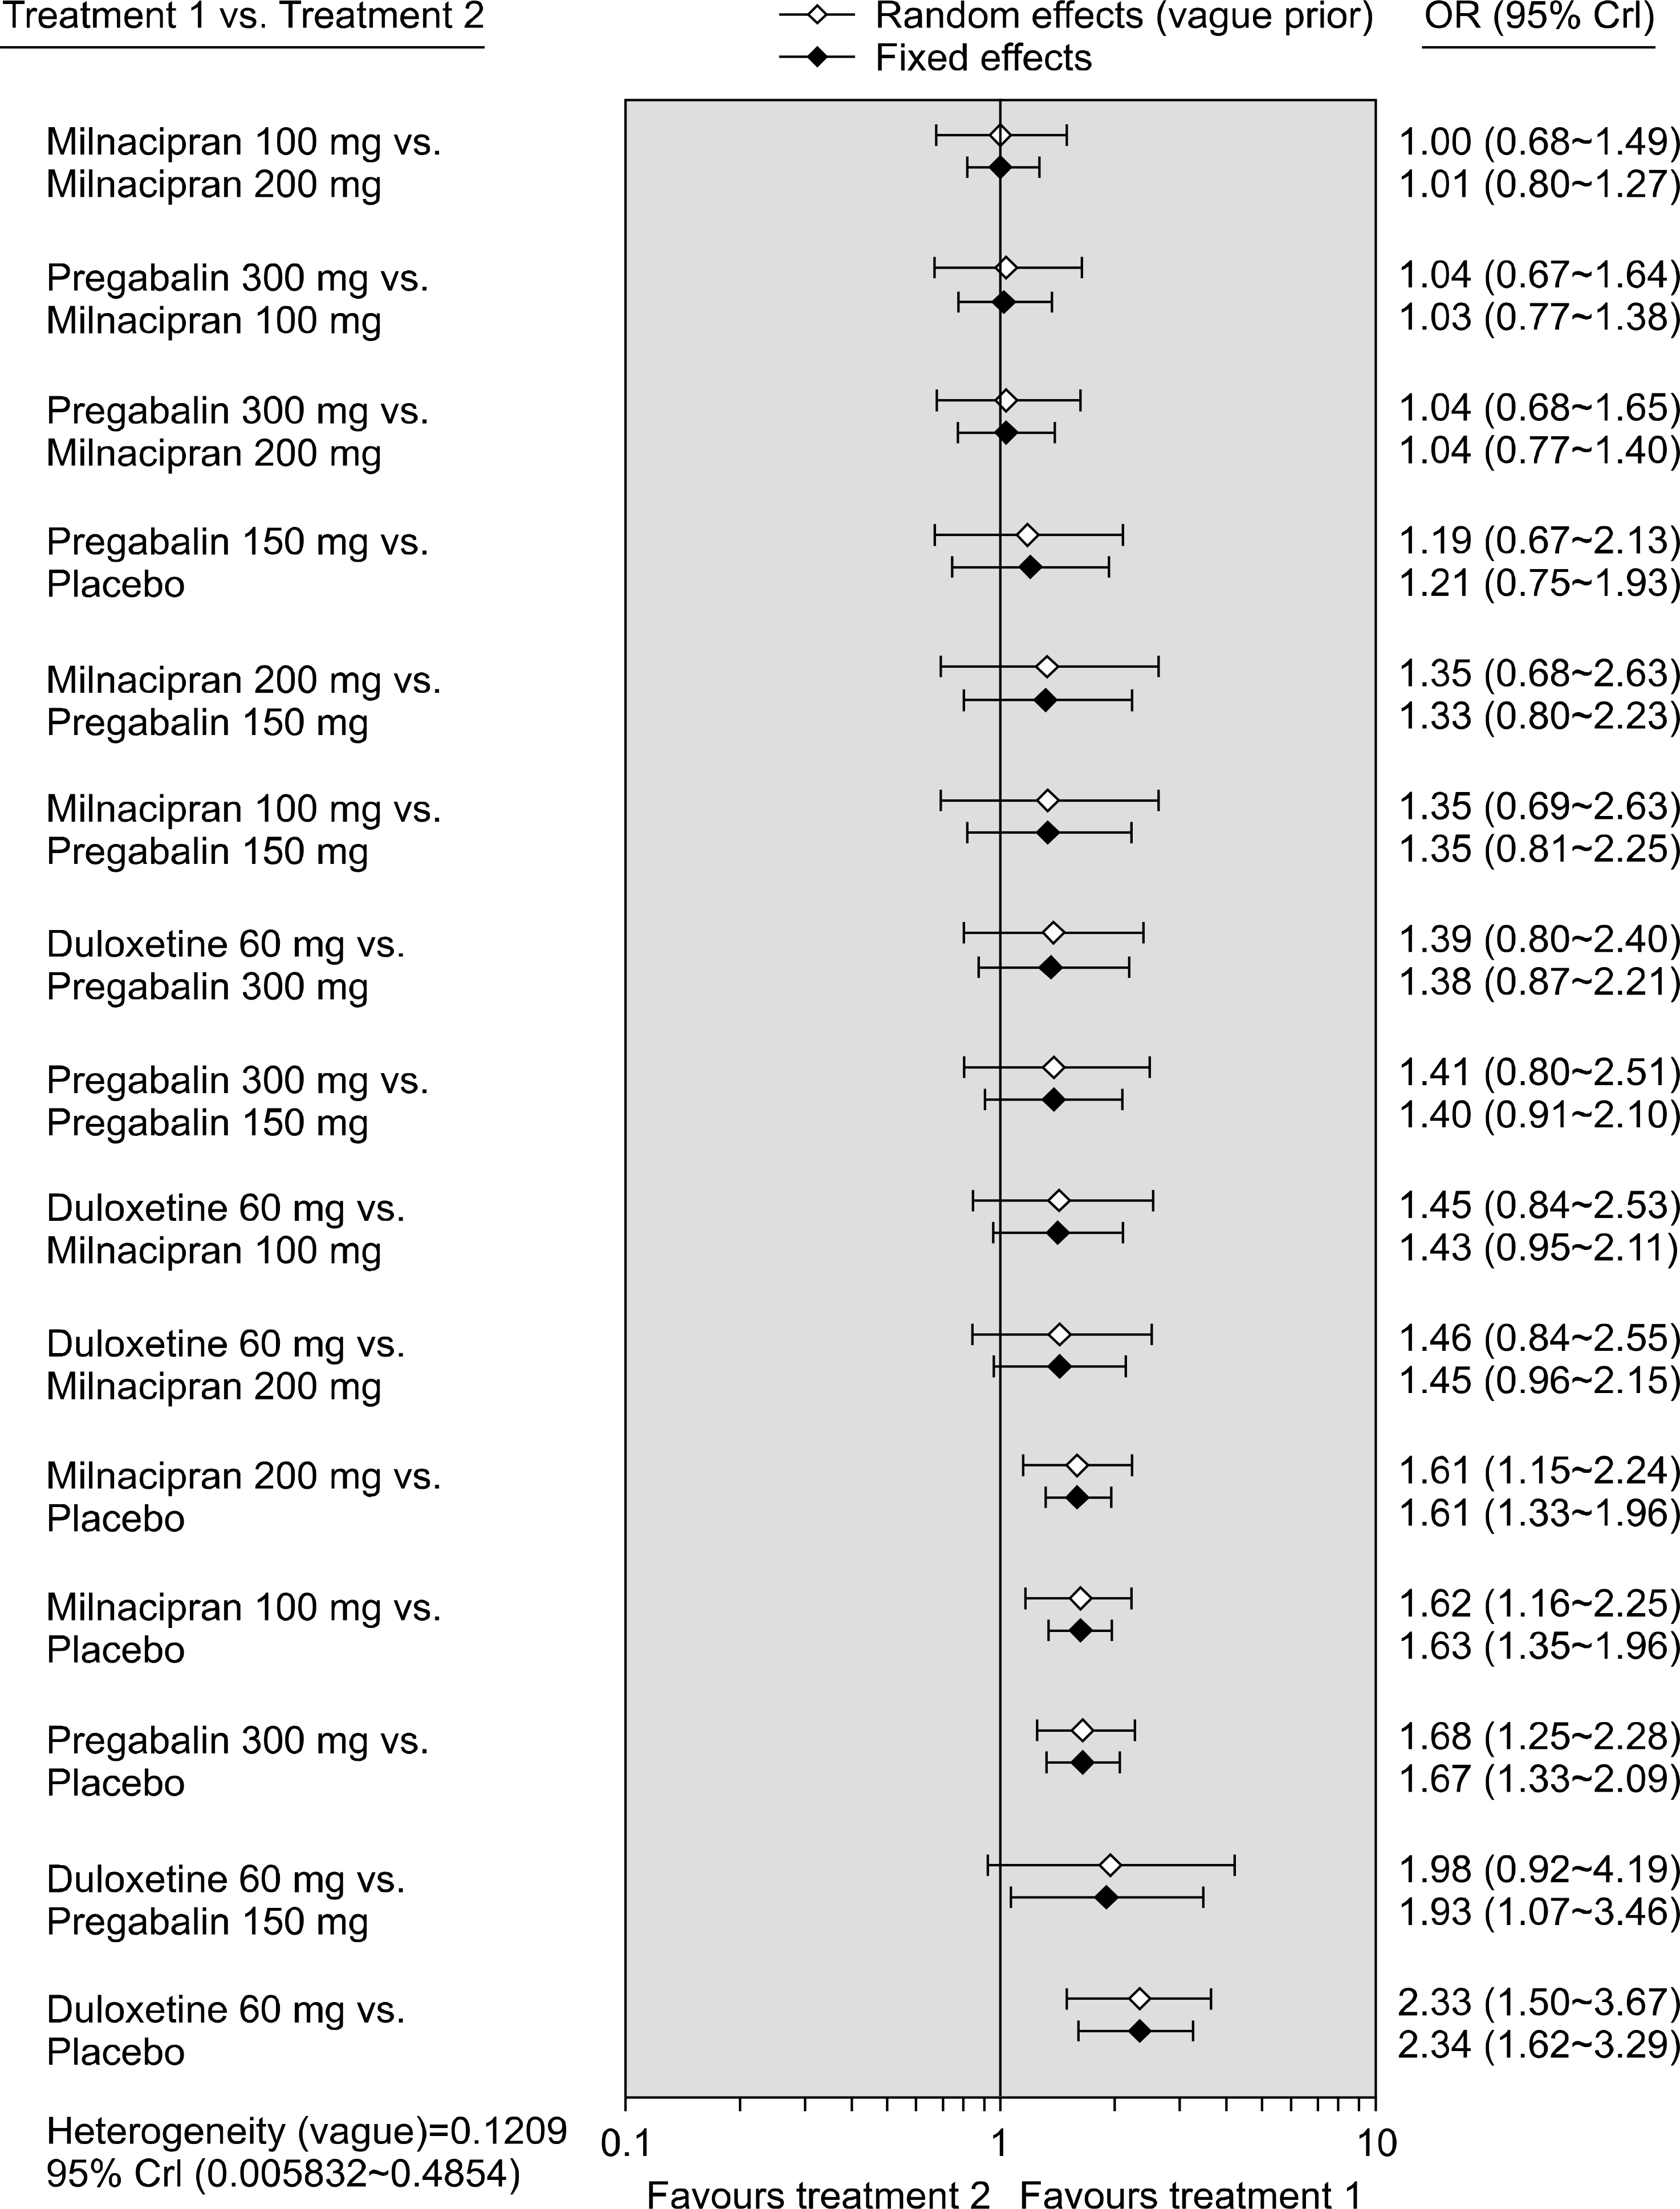
Figure 3.
Bayesian network meta-analysis results of randomized controlled studies on the relative efficacy of duloxetine, pregabalin, milnacipran, and placebo, respectively. CrI: credible interval, OR: odds ratio.

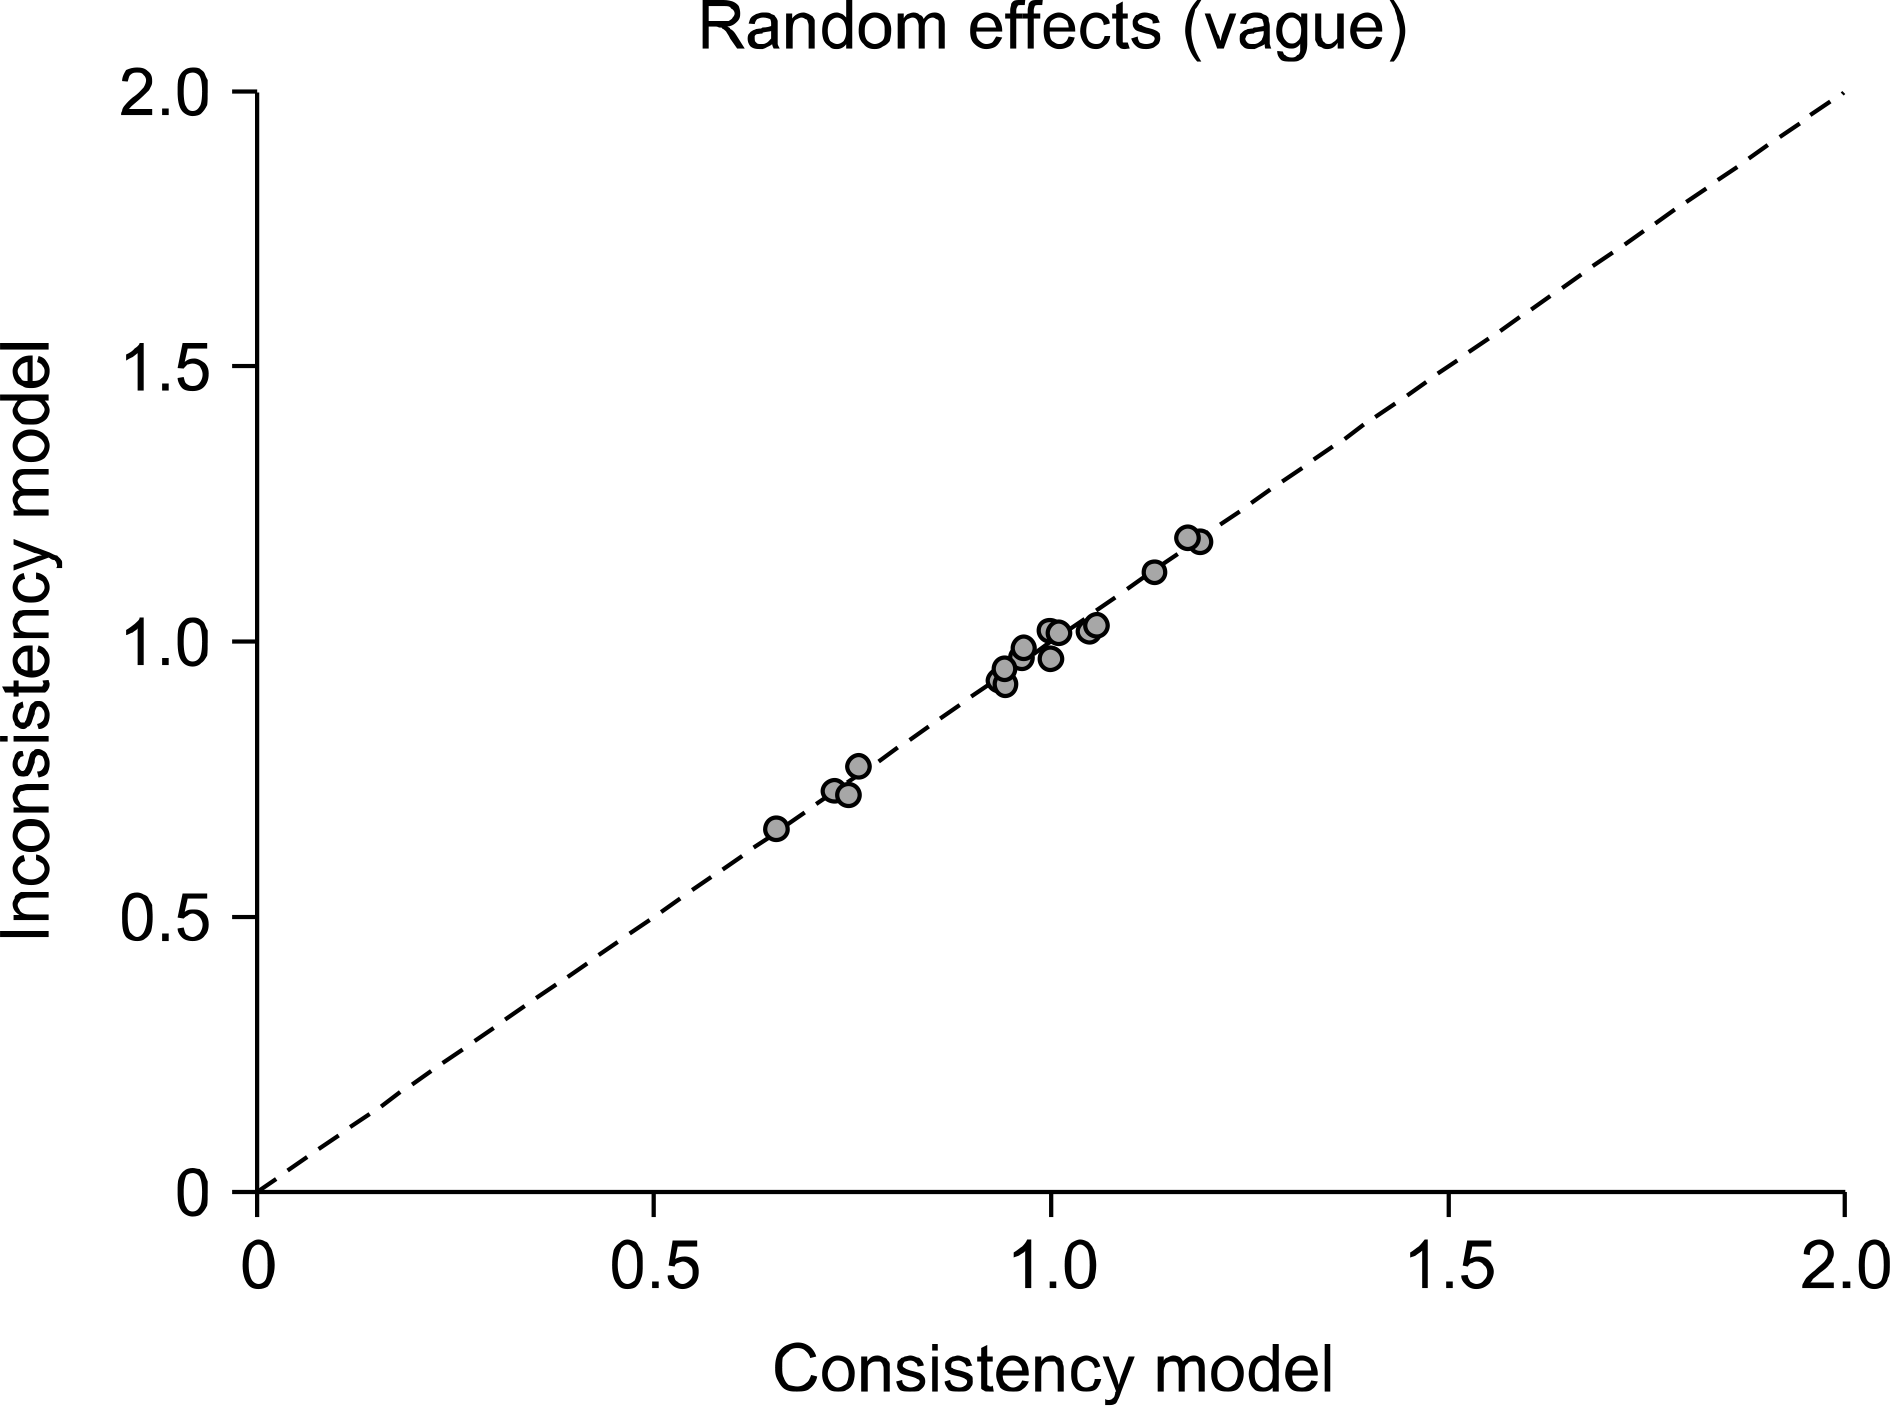
Figure 4.
Inconsistency plots for efficacy of duloxetine, pregabalin, milnacipran, and placebo. Plot of the posterior mean deviance contribution of individual data points for the consistency model (horizontal axis) and the unrelated mean effects model (vertical axis), along with the line of equality.

Table 1.
Rank probability of duloxetine, pregabalin, milnacipran, and placebo*
| Treatment | SUCRA |
|---|---|
| Duloxetine 60 mg | 0.9431 |
| Pregabalin 300 mg | 0.6300 |
| Milnacipran 100 mg | 0.5680 |
| Milnacipran 200 mg | 0.5617 |
| Pregabalin 150 mg | 0.2392 |
| Placebo | 0.0580 |


 PDF
PDF ePub
ePub Citation
 Print
Print


 XML Download