Abstract
Objectives
This study aimed at assessing the quality of dental services, as perceived by the disabled, and analyzing the factors identified to be of both high importance and low performance, as identified by IPA.
Methods
The data were collected from June 8 to November 2, 2016, after approval by the institutional review board. Questionnaires were distributed to 1466 disabled dental service consumers, of which 349 cases were included. The data were analyzed by frequency analysis, multi-regression analysis for implicit importance, and IPA matrix for marketing strategy.
Results
The performance results revealed that cost level, reduction of the fee, and waiting time for treatments were the sources of greatest dissatisfaction. The IPA matrix results categorized the next appointment, explanation of the fee, waiting time for treatment, professionalism of the staff, and convenient facilities as high-importance, low-performance factors. Meanwhile, the results of the IPA matrix for consumer segmentation, according to recently used dental institutions were different. The dental clinic users evaluated professionalism of the staff, convenience of the facility, explanation of the fee, and cost level as high-importance, low-performance attributes. The dental hospital users indicated that waiting time for treatment and next appointment were high-importance, low-performance attributes. Finally, the public health center users indicated that convenience of booking, waiting time for treatment, convenience of facilities, reduction of the fee, and next appointment as high-importance, low-performance attributes.
Conclusions
To improve the quality of dental service, we need to understand the needs of the dental patients with disability. All attributes that were categorized as high-importance, low-performance must be improved first and should accordingly be used as strategic factors to increase satisfaction with oral medical institutions.
References
1. Policy Research Information Service & Management (PRISM). Policy report DB, Oral health survey of the disabled, 2015 [Internet]. [cited 2016 Nov 01]. Available from:. http://www.prism.go.kr/homepage/theme/retrieveThemeDetail.do.
2. Ryu JG. A Study on factors in selecting recuperation hospital of aging society. J Mark Manage Res. 2006; 11:101–130.
3. Lee GU. A study for the relationship between the cognition difference and satisfaction for the medical service and the revisiting. J Hosp Manage. 2003; 8:143–160.
4. Kwon DG. The study on the plan of improving the service quality in the food industry by the IPA matrix. Korean J Tour Res. 2011; 26:1–32.
5. Matilla JA, James JC. Importance-performance analysis. J Mark. 1977; 41:77–79.
6. Cho HL. A Study on the satisfaction factors of the disabled when using dental care services [master’s thesis]. Seoul: Kyunghee Univer-sity;2011. [Korean].
7. Cha JB, Ryu GH, Lee HY. Medical services on each process MOT using IPA. Acad Custom Satisfact Manage. 2013; 15:47–65.
8. You DK, Ju MJ, Kim MS, Lee YK. Determinants of Franchisor Dissatisfaction in Food service Industry-Focused on Revised IPA. Acad Custom Satisfact Manage. 2013; 15:123–140.
9. Oh MJ, Ryu JS. Comparison between traditional IPA and revised IPA: An attractiveness evaluation of Incheon Chinatown. Int J Tourism and Hospitality Res. 2016; 30:129–142.
10. Lim K, Kang MS, Shin SW. The study on experts’ perceptions on usage elements of SNSs and the investigation on the priority of the elements for SNSs’ educational use through importance-performance analysis. J Educ Tech. 2012; 28:925–952.

11. Deng W. Using a revised importance-performance analysis approach: The case of Taiwanese hot springs tourism. Tourism Manage. 2007; 28:1274–1284.

12. Park CY. An analysis of spatial accessibility to dental institutions of the disabled by region:Metropolis, small and medium sized city and rural area. J Georg Educ. 2014; 58:33–45.
13. Jeon BY. Factors affecting health care utilization and unmet health care needs of the disabled population in Korea[PhD’s thesis]. Seoul: Seoul National Univ.;2014. Korean.
14. Lee WR, Kim YJ. A comparison study on dental treatment time of patients with different types of disabilites. J Korean Dis Oral Health. 2014; 10:78–83.
15. Glassman P, Miller CE. Improving oral health for people with special needs through community-based dental care delivery systems. J Calif Dent Assoc. 1998; 26:404–409.
16. Glassman P, Subar P. Improving and maintaining oral health for people with special needs. Dent Clin North Am. 2008; 52:447–461.

17. Kwon HG, Choi GR, Choi CH, Choi YH. The status of oral health and dental services in disabled people. National Evidence-based Healthcare Collaborating Agency. 2003. 49–64.
18. Kim SM. Dental care and the state of education and training of dentist for the handicapped. J Korean Acad Pediatr Dent. 2001; 28:87–94.
19. Gallagher JE, Fiske J. Special Care Dentistry:a professional challenge. Br Dent J. 2007; 202:619–629.
Fig. 2.
IPA Matrix for service quality by the disabled dental patient. 1: Easy to get, 2: Convenience of booking, 3: Ease of check in, 4: Kindness of Desk personnel, 5: Waiting time for treatment, 6: Atmosphere of waiting place, 7: Professionalism of the staff, 8: Staffs' Explanation, 9: Favorable attitude, 10: Convenient facilities, 11: Convenient payment process, 12: Explanation of the fee, 13: Reduction of the fee, 14: Cost level, 15: Next appointment.
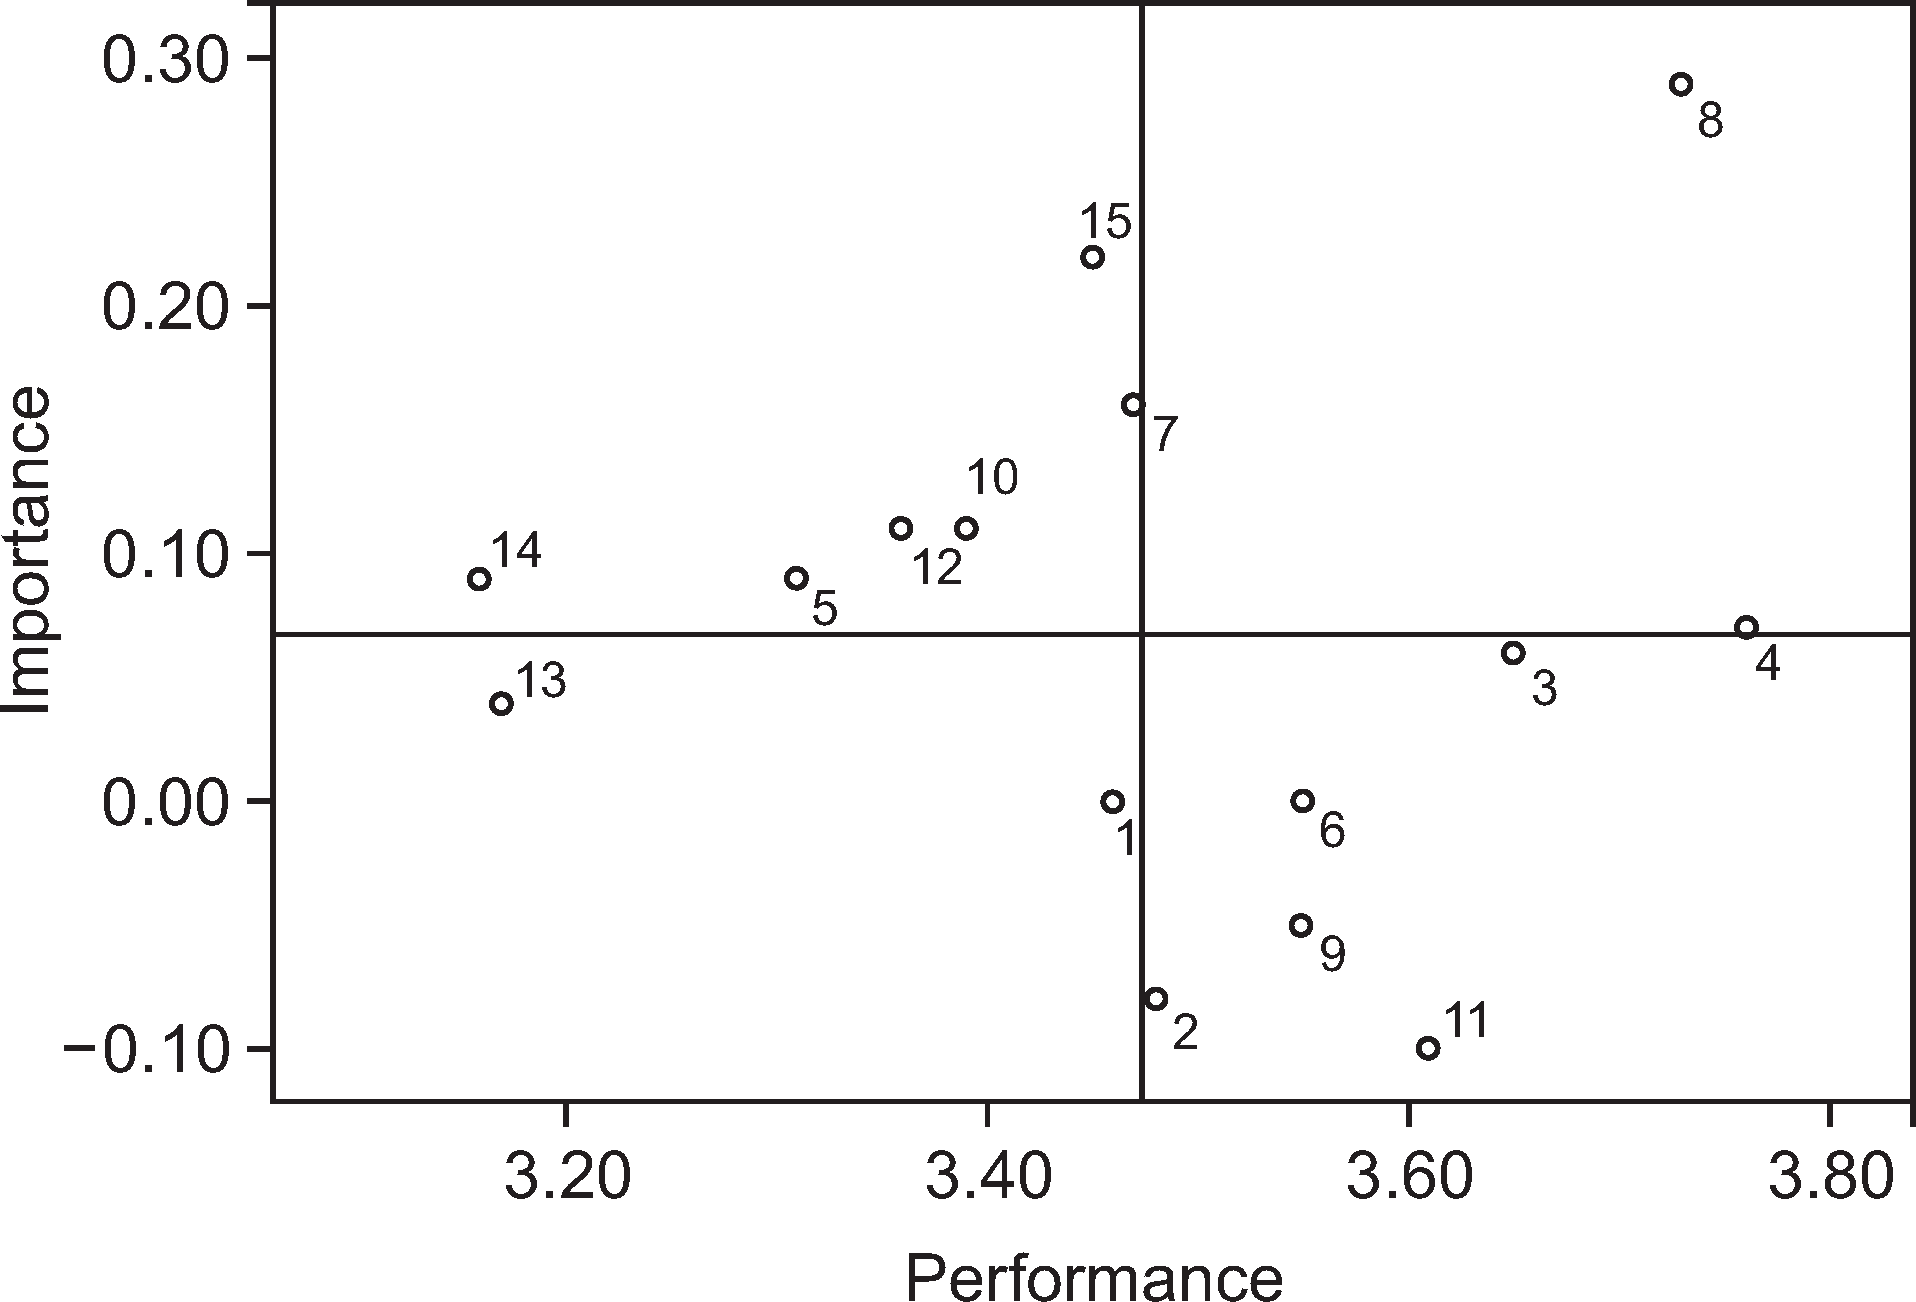
Fig. 3.
IPA Matrix for dental service quality by the disabled dental clinic patient. 1: Easy to get, 2: Convenience of booking, 3: Ease of check in, 4: Kindness of Desk personnel, 5: Waiting time for treatment, 6: Atmosphere of waiting place, 7: Professionalism of the staff, 8: Staffs’Explanation, 9: Favorable attitude, 10: Convenient facilities, 11: Convenient payment process, 12: Explanation of the fee, 13: Reduction of the fee, 14: Cost level, 15: Next appointment.
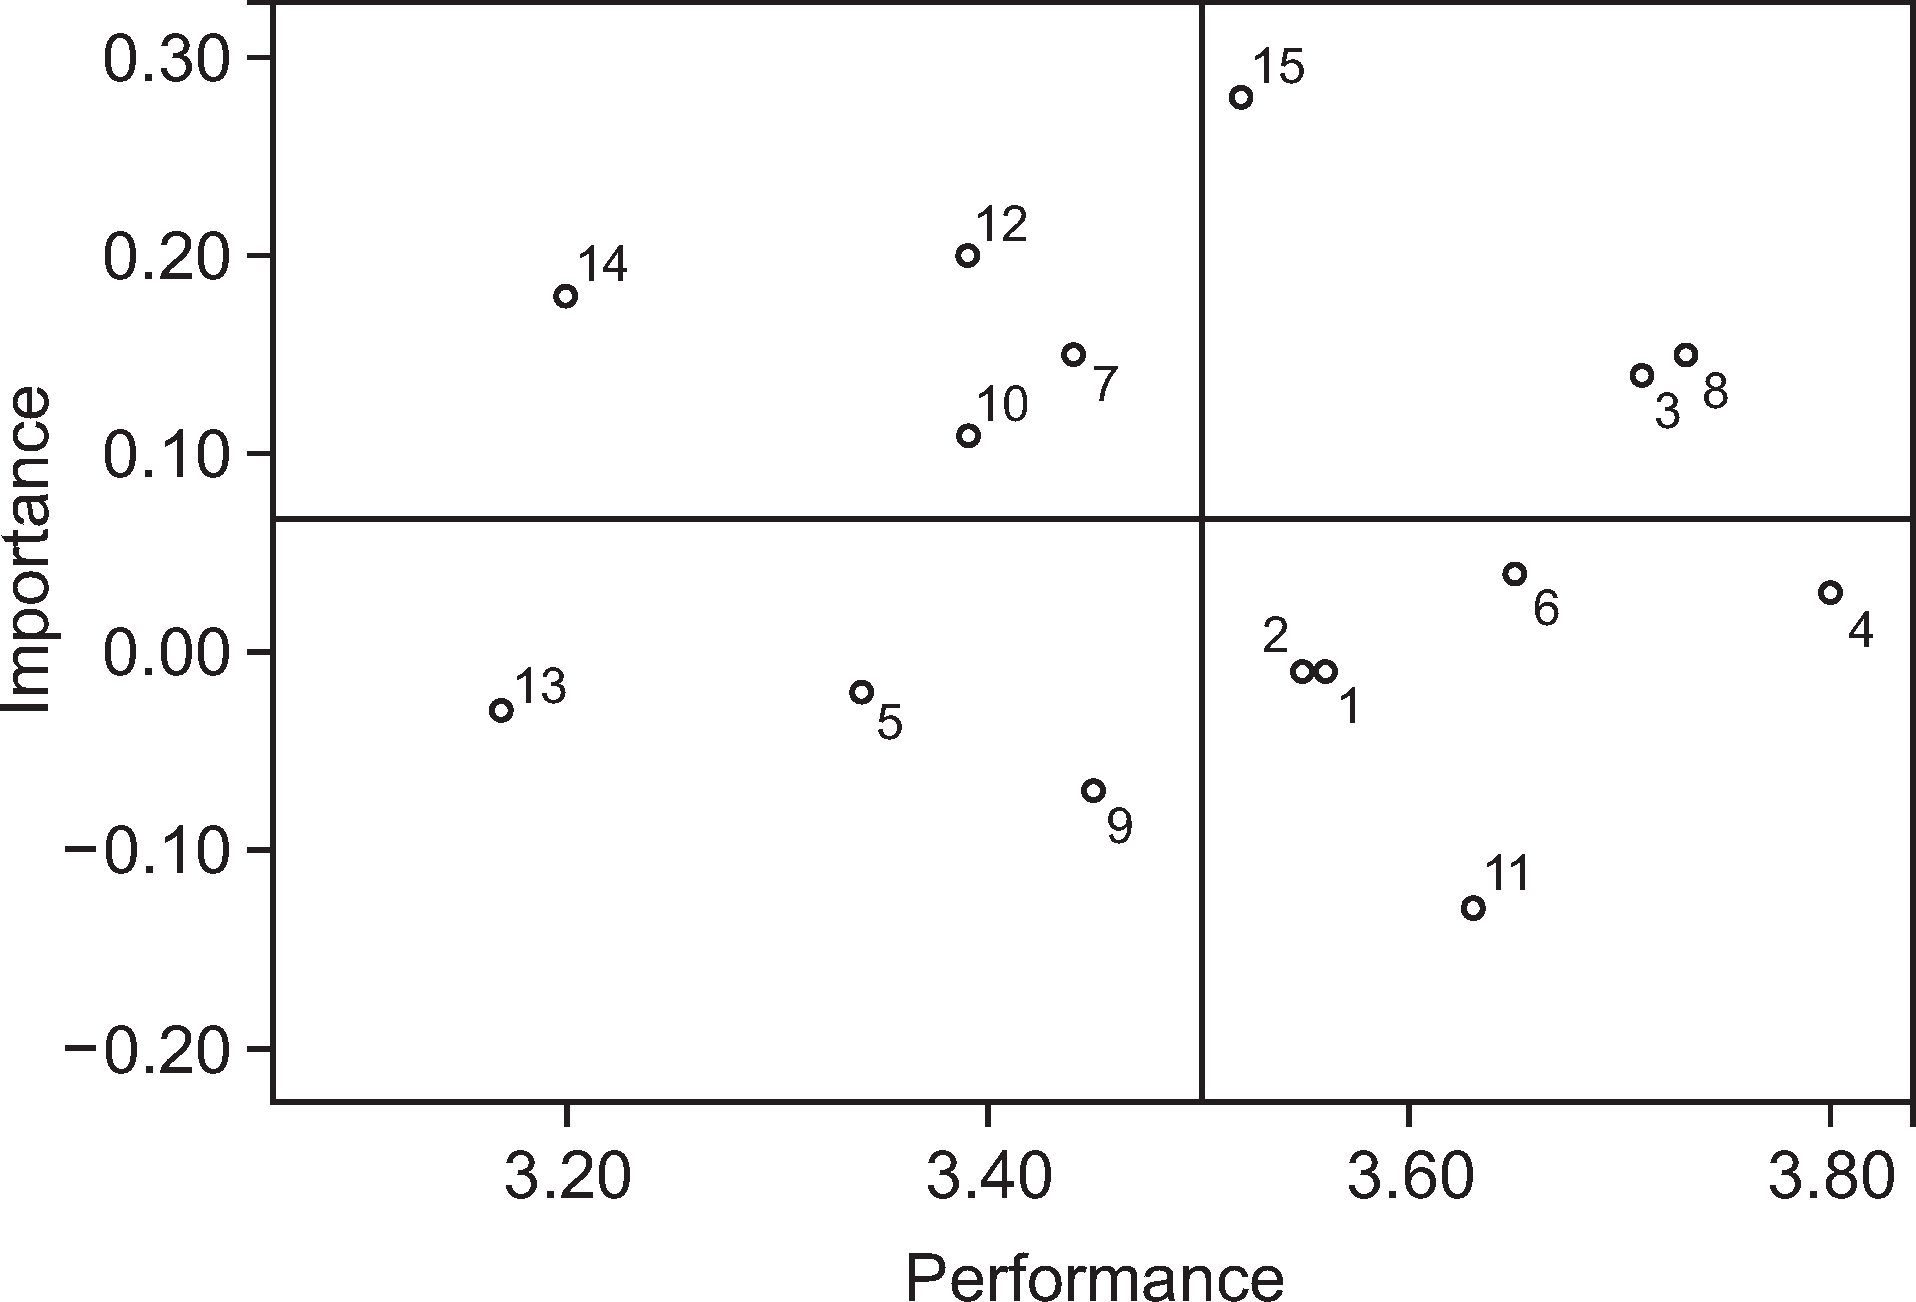
Fig. 4.
IPA Matrix for dental service quality by the disabled dental hospital patient. 1: Easy to get, 2: Convenience of booking, 3: Ease of check in, 4: Kindness of Desk personnel, 5: Waiting time for treatment, 6: Atmosphere of waiting place, 7: Professionalism of the staff, 8: Staffs’Explanation, 9: Favorable attitude, 10: Convenient facilities, 11: Convenient payment process, 12: Explanation of the fee, 13: Reduction of the fee, 14: Cost level, 15: Next appointment.
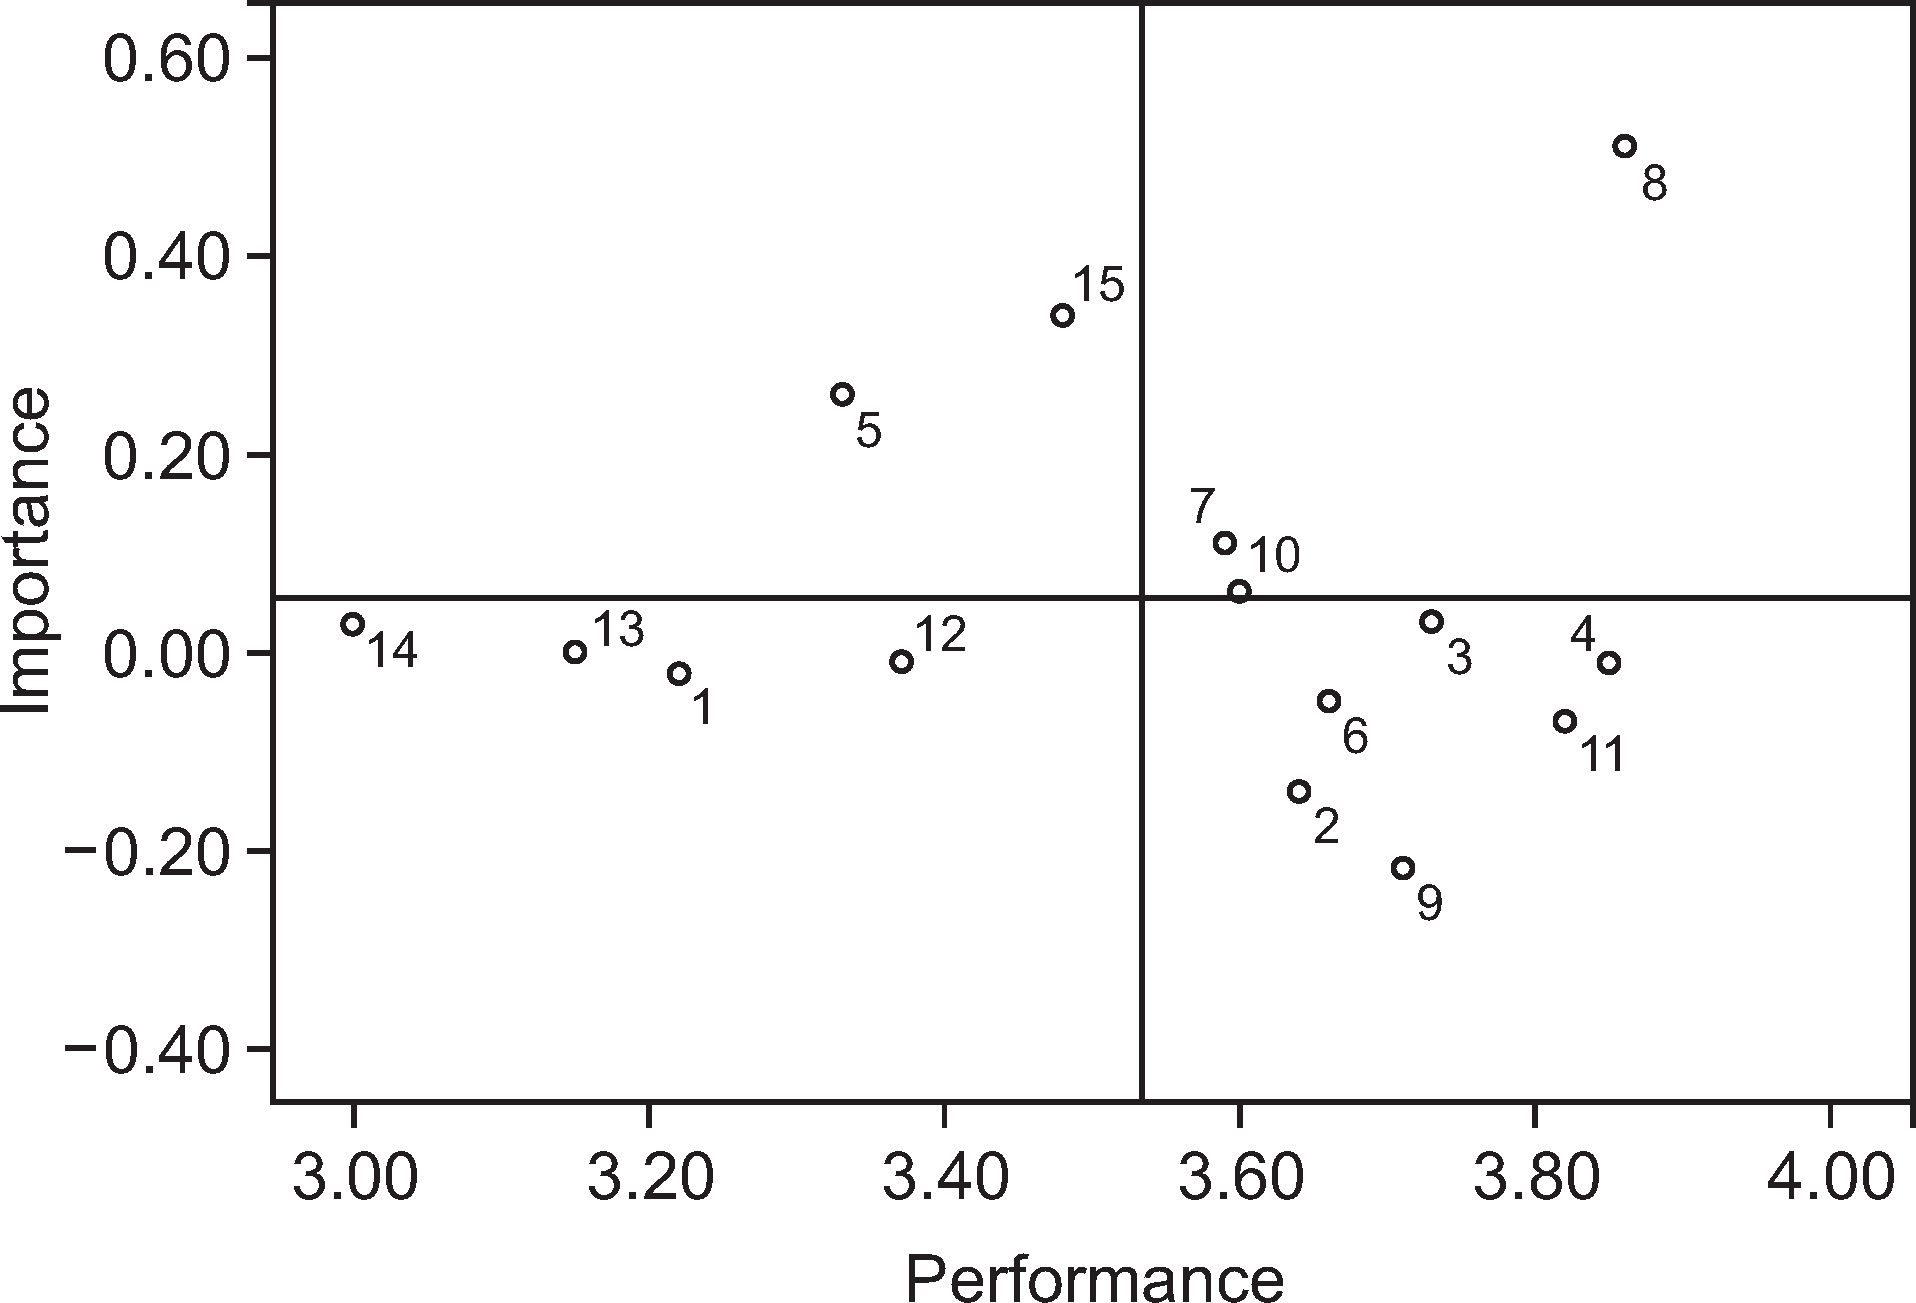
Fig. 5.
IPA Matrix for dental service quality as perceived by the disabled dental health center patient. 1: Easy to get, 2: Convenience of booking, 3: Ease of check in, 4: Kindness of Desk personnel, 5: Waiting time for treatment, 6: Atmosphere of waiting place, 7: Professionalism of the staff, 8: Staffs’Explanation, 9: Favorable attitude, 10: Convenient facilities, 11: Convenient payment process, 12: Explanation of the fee, 13: Reduction of the fee, 14: Cost level, 15: Next appointment.
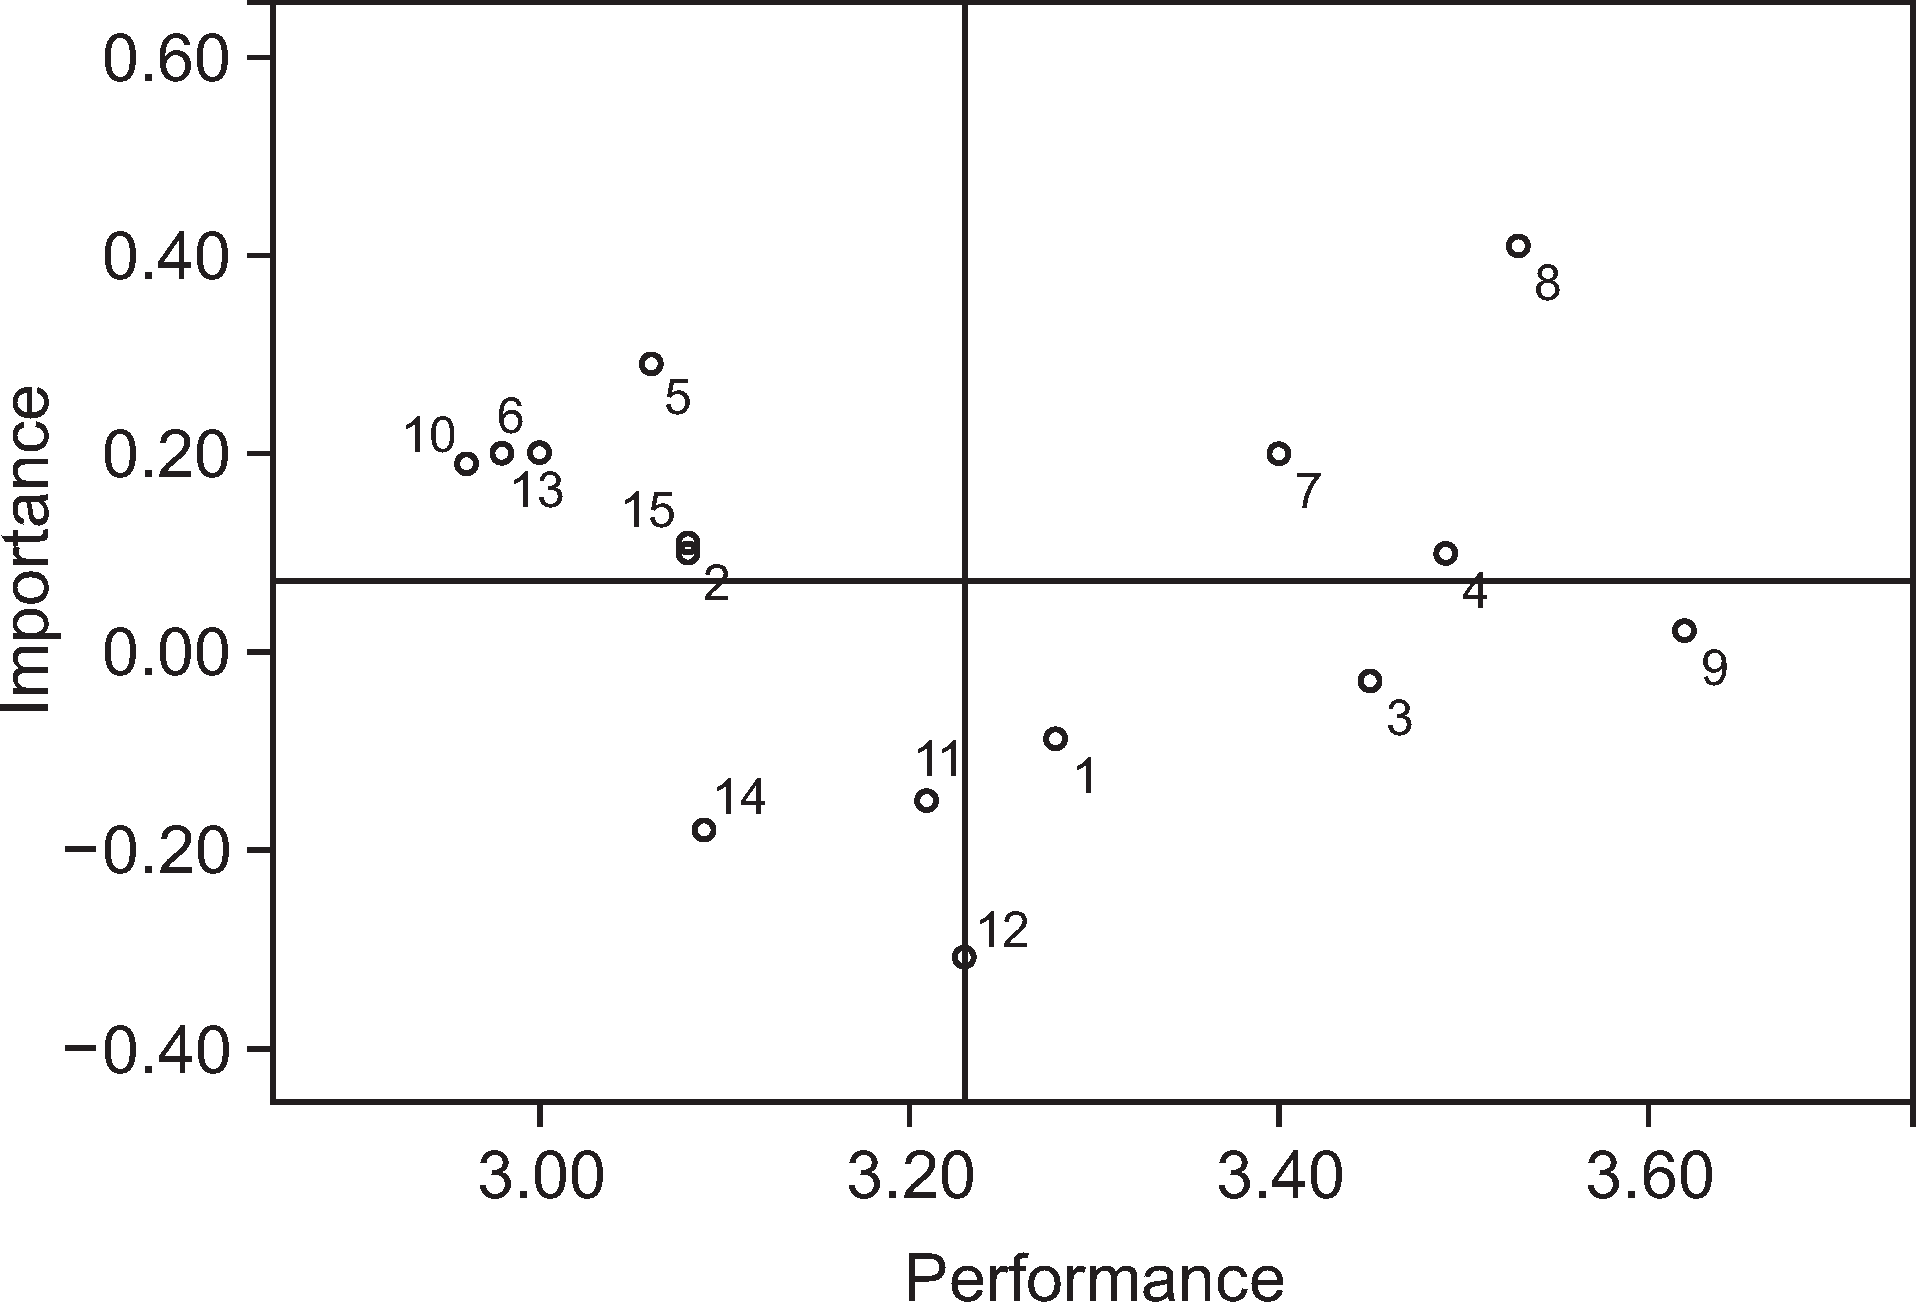
Table 1.
Demographic characteristics of respondent
Table 2.
Outcomes of IPA for dental service quality as perceived by the disabled
| Quadrant | Attributes |
Implicit Importance |
Performance | |||
|---|---|---|---|---|---|---|
| B | S.E | β | t | |||
| III | 1. Easy to get | 0.00 | 0.04 | 0.00 | 0.00 | 3.46 (1.10) |
| IV | 2. Convenience of booking | -0.08 | 0.05 | -0.08 | -1.50 | 3.49 (0.99) |
| IV | 3. Ease of check in | 0.06 | 0.07 | 0.06 | 0.90 | 3.65 (0.91) |
| I | 4. Kindness of desk personnel | 0.07 | 0.06 | 0.07 | 1.15 | 3.76 (0.86) |
| II | 5. Waiting time for treatment | 0.09 | 0.04 | 0.09 | 1.95 | 3.31 (1.02) |
| IV | 6. Atmosphere of waiting place | 0.00 | 0.06 | 0.00 | 0.04 | 3.55 (0.99) |
| II | 7. Professionalism of the staff | 0.15 | 0.06 | 0.16 | 3.13† | 3.47 (1.03) |
| I | 8. Staffs’Explanation | 0.32 | 0.05 | 0.29 | 5.44‡ | 3.73 (0.89) |
| IV | 9. Favorable attitude | -0.05 | 0.05 | -0.05 | -0.92 | 3.55 (0.97) |
| II | 10. Convenient facilities | 0.10 | 0.05 | 0.11 | 2.07* | 3.39 (1.01) |
| IV | 11. Convenient payment process | -0.11 | 0.06 | -0.10 | -1.76 | 3.61 (0.93) |
| II | 12. Explanation of the fee | 0.11 | 0.05 | 0.11 | 2.18* | 3.36 (1.00) |
| III | 13. Reduction of the fee | 0.04 | 0.05 | 0.42 | 0.71 | 3.17 (1.05) |
| II | 14. Cost level | 0.08 | 0.05 | 0.09 | 1.47 | 3.16 (1.11) |
| II | 15. Next appointment | 0.22 | 0.05 | 0.22 | 4.54‡ | 3.45 (1.00) |
| Overall satisfaction | 3.56 (0.96) | |||||
| R2=0.64 Adj. R2=0.62 F=39.48‡ | ||||||
Table 3.
Outcomes of IPA for dental service quality as perceived by the disabled clinic patient
| Quadrant | Attributes |
Implicit Importance |
Performance | |||
|---|---|---|---|---|---|---|
| B | S.E | â | t | |||
| IV | 1. Easy to get | -0.01 | 0.05 | -0.01 | -0.23 | 3.56 (1.10) |
| IV | 2. Convenience of booking | -0.01 | 0.07 | -0.01 | -0.20 | 3.55 (1.06) |
| I | 3. Ease of check in | 0.14 | 0.09 | 0.14 | 1.60 | 3.71 (1.00) |
| IV | 4. Kindness of desk personnel | 0.03 | 0.08 | 0.03 | 0.42 | 3.80 (0.92) |
| III | 5. Waiting time for treatment | -0.02 | 0.06 | -0.03 | -0.39 | 3.34 (1.08) |
| IV | 6. Atmosphere of waiting place | 0.04 | 0.08 | 0.04 | 0.56 | 3.65 (1.02) |
| II | 7. Professionalism of the staff | 0.15 | 0.06 | 0.15 | 2.33* | 3.44 (1.09) |
| I | 8. Staffs’ Explanation | 0.17 | 0.08 | 0.15 | 2.10* | 3.73 (0.95) |
| III | 9. Favorable attitude | -0.07 | 0.07 | -0.07 | -1.08 | 3.45 (1.03) |
| II | 10. Convenient facilities | 0.11 | 0.07 | 0.11 | 1.65 | 3.39 (1.05) |
| IV | 11. Convenient payment process | -0.13 | 0.08 | -0.13 | -1.74 | 3.63 (1.00) |
| II | 12. Explanation of the fee | 0.19 | 0.06 | 0.20 | 3.22† | 3.39 (1.10) |
| III | 13. Reduction of the fee | -0.03 | 0.07 | -0.03 | -0.44 | 3.17 (1.14) |
| II | 14. Cost level | 0.16 | 0.07 | 0.18 | 2.37* | 3.20 (1.23) |
| I | 15. Next appointment | 0.27 | 0.07 | 0.28 | 4.10‡ | 3.52 (1.09) |
| Overall satisfaction | 3.57 (1.04) | |||||
| R2=0.70 Adj. R2=0.68 F=29.30‡ | ||||||
Table 4.
Outcomes of IPA for dental service quality as perceived by the disabled hospital patient
| Quadrant | Attributes |
Implicit Importance |
Performance | |||
|---|---|---|---|---|---|---|
| B | S.E | â | t | |||
| III | 1. Easy to get | -0.01 | 0.08 | -0.02 | -0.18 | 3.22 (1.15) |
| IV | 2. Convenience of booking | -0.14 | 0.15 | -0.14 | -0.98 | 3.64 (0.87) |
| IV | 3. Ease of check in | 0.04 | 0.19 | 0.03 | 0.19 | 3.73 (0.73) |
| IV | 4. Kindness of desk personnel | -0.01 | 0.19 | -0.01 | -0.04 | 3.85 (0.70) |
| II | 5. Waiting time for treatment | 0.23 | 0.12 | 0.26 | 1.96 | 3.33 (0.99) |
| IV | 6. Atmosphere of waiting place | -0.05 | 0.18 | -0.05 | -0.31 | 3.66 (0.77) |
| I | 7. Professionalism of the staff | 0.10 | 0.13 | 0.11 | 0.75 | 3.59 (1.03) |
| I | 8. Staffs’ Explanation | 0.59 | 0.19 | 0.51 | 3.19† | 3.86 (0.75) |
| IV | 9. Favorable attitude | -0.21 | 0.19 | -0.22 | -1.11 | 3.71 (0.91) |
| I | 10. Convenient facilities | 0.06 | 0.15 | 0.06 | 0.39 | 3.60 (0.85) |
| IV | 11. Convenient payment process | -0.08 | 0.20 | -0.07 | -0.41 | 3.82 (0.79) |
| III | 12. Explanation of the fee | -0.01 | 0.14 | -0.01 | -0.06 | 3.37 (0.89) |
| III | 13. Reduction of the fee | 0.00 | 0.18 | 0.00 | 0.01 | 3.15 (0.99) |
| III | 14. Cost level | 0.03 | 0.17 | 0.03 | 0.15 | 3.00 (1.04) |
| II | 15. Next appointment | 0.37 | 0.12 | 0.34 | 3.07† | 3.48 (0.80) |
| Overall satisfaction | 3.63 (0.87) | |||||
| R2=0.71 Adj. R2=0.59 F=6.028‡ | ||||||
Table 5.
Outcomes of IPA for dental service quality as perceived by the disabled health center patient
| Quadrant | Attributes |
Implicit Importance |
Performance | |||
|---|---|---|---|---|---|---|
| B | S.E | β | t | |||
| IV | 1. Easy to get | -0.07 | 0.12 | -0.09 | -0.55 | 3.28 (1.05) |
| II | 2. Convenience of booking | 0.11 | 0.16 | 0.11 | 0.69 | 3.08 (0.73) |
| IV | 3. Ease of check in | -0.03 | 0.22 | -0.03 | -0.14 | 3.45 (0.72) |
| I | 4. Kindness of Desk personnel | 0.11 | 0.19 | 0.10 | 0.56 | 3.49 (0.72) |
| II | 5. Waiting time for treatment | 0.23 | 0.11 | 0.29 | 2.07* | 3.06 (0.93) |
| II | 6. Atmosphere of waiting place | 0.15 | 0.17 | 0.20 | 0.91 | 3.00 (0.98) |
| I | 7. Professionalism of the staff | 0.17 | 0.19 | 0.20 | 0.89 | 3.40 (0.84) |
| I | 8. Staffs’Explanation | 0.37 | 0.15 | 0.41 | 2.49* | 3.53 (0.82) |
| IV | 9. Favorable attitude | 0.01 | 0.17 | 0.02 | 0.08 | 3.62 (0.79) |
| II | 10. Convenient facilities | 0.14 | 0.13 | 0.19 | 1.15 | 2.96 (0.98) |
| III | 11. Convenient payment process | -0.16 | 0.18 | -0.15 | -0.85 | 3.21 (0.72) |
| III, IV | 12. Explanation of the fee | -0.28 | 0.14 | -0.31 | -2.05 | 3.23 (0.82) |
| II | 13. Reduction of the fee | 0.16 | 0.13 | 0.19 | 1.21 | 2.98 (0.91) |
| III | 14. Cost level | -0.17 | 0.15 | -0.18 | -1.13 | 3.09 (0.77) |
| II | 15. Next appointment | 0.11 | 0.13 | 0.11 | 0.83 | 3.08 (0.76) |
| Overall satisfaction | 3.45 (0.75) | |||||
| R2=0.84 Adj. R2=0.59 F=6.028‡ | ||||||


 PDF
PDF ePub
ePub Citation
 Print
Print


 XML Download