

 PDF
PDF ePub
ePub Citation
 Print
Print


Among the plant foods, onions (Allium cepa) are one of the richest sources of flavonoids in the human diet. Quercetin is a major flavonol abundant in plant products, particularly in onions, and has been reported to possess antioxidative, anti-inflammatory, and lipid-regulating properties [1,2,3,4,5]. Numerous clinical studies and animal and in vitro experiments have demonstrated that phenolic substances, including quercetin, have important anti-inflammatory and anti-obesity properties [3,6,7].
At least 25 different flavonoids have been characterized in onion bulbs and quercetin and its glycosides are the most important ones [8]. The highest concentrations of quercetin found in the onion peel, constituting the outer dry layers of the onion bulb [9]. Quercetin and polyphenol, through a modulation of immune function, have been suggested to be involved in the role played by plant foods in disease prevention [10]. The onion peel ethanol extract was reported to have a strong antioxidant activity with quercetin and polyphenol proposed to be the major components responsible for this effect [10], suggesting the possibility that an onion peel supplement could improve the immune status. However, this possibility has not been studied extensively yet.
This study was performed to investigate the effects of an onion peel water extract (OPE) on the immune status by using the rat forced swimming test. We used a water extract rather than an ethanol extract because of its economical and procedural advantages. The effects of the OPE were evaluated by determining the blood lymphocyte numbers, immune organ weights, histopathological analysis, and the serum levels of the immune-relate cytokines Interferon (IFN)-γ, Tumor necrosis factor (TNF)-α, and Interleukin (IL)-12.
Materials and Methods
Preparation of OPE
OPE was prepared with yellow onion peels provided by Samhwa Well-being Co. (Iksan, Korea). The onions had been cultivated and harvested in Iksan, Korea. Following collection, onion peels were washed three times in tap water and were shade-dried. The yield of dried onion peels was 13-14% (w/w) as compared to that obtained with fresh peels. The dried onion peels were mechanically crushed with a food crusher (Samnet Food Co., Korea), and their composition was analyzed as described below. The dried onion peels were mixed with distilled water at a concentration of 20 mg/mL, the pH was adjusted to 6 with phosphate buffer, and extraction was carried out using the Soxhlet method at boiling temperature (100℃) for up to 30 min. The extract was filtered and concentrated in a rotatory evaporator (BUCHI Rotavapor R-220) under reduced pressure at 65±5℃ up to 20 h to obtain a semisolid material (yield: 14.9% w/w).
Quercetin, total polyphenol, and total antioxidant content determination
The total polyphenol content of the OPE was determined by the Folin-Ciocalteu Reagent (Sigma Chemical Co., St. Louis, MO, USA) using the method of Vichaponga et al. [11]. Quercetin levels were measured using a high=performance liquid chromatography (HPLC), as previously described [12]. In brief, the hydrolysis of all glycosides to quercetin aglycone in the samples was analyzed by HPLC. A 0.1 g onion peel sample was mixed with 40 mL of 60% aqueous ethanol and 5 mL of 6 N HCl. After refluxing at 95℃ for 2 h, the hydrolyzed solution was filtered into a 100 mL flask with 60% aqueous ethanol. Approximately 10 mL of the solution was filtered through a 0.45 µm filter before injection into the HPLC system. The quercetin concentration in the OPE was quantified using a Hewlett-Packard 1100 series HPLC system (Hewlett-Packard, Palo Alto, CA, USA) with a ZORBAX C18 column (150×4.6 mm, 5 µm, XDB-C18; Hewlett-Packard, Palo Alto, CA, USA). Elution was performed using a mobile phase made up of water: 5% acetic acid:acetonitrile (40:30:30) at a flow rate of 1.0 mL/min. The UV detector was set at 370 nm. The sample injection volume was 20 µL. The quantification was extrapolated from a standard curve obtained with pure quercetin (Sigma Chemical Co., St. Louis, MO, USA). The total antioxidant status (TAS) of the OPE was analyzed using a TAS kit (Randox Laboratories Ltd., London, UK), according to the manufacturer's instruction. The assay was performed in duplicate on an automated biochemical analyzer, ChemWell-T (Awareness Technology Inc., Palm City, FL), as per the manufacturer's instructions (Randox Laboratories Ltd.). The analyzer was programmed using a ChemWell-T Assay Editor in the standard assay mode to add 200 µL of chromogen (metmyoglobin and ABTS®) and 4 µL of sample/standard control/distilled water, incubate at 37℃ for 10 s, and read at 630 nm. This was followed by the addition of 40 µL of substrate (hydrogen peroxide in stabilized form), incubation at 37℃ for exactly 3 min, and measuring absorbance at 630 nm. A standard control (6-hydroxy-2,5,7,8-tetramethylchroman-2carboxylic acid) provided in the kit was used for calibration.
Animals
Four-week-old specific pathogen-free (SPF) male Sprague-Dawley rats were obtained from Samtaco Co. (Osan, Korea). All rats were kept at the inspecting facility of Wonkwang University (Iksan, South Korea) for 1 week to allow acclimation before experimentation. Thereafter, they were kept in an isolated SPF barrier room under a regulated temperature (23±1℃), humidity (50±5%), and light/dark cycle (12/12 h). The rats were fed a sterilized (2 M rad radiation) pellet diet (Purina, Seoul, Korea) and had access to sterilized water ad libitum. All studies were performed in accordance with the Guide for Animal Experimentation of Wonkwang University and approved by the Institutional Animal Care and Use Committee of Wonkwang University (WKU-12-56). All efforts were made to minimize pain or discomfort to the animals used.
Experimental design
Following a 1-week adaptation period, 36 rats were randomly divided into six groups: NC (normal control), forced swimming control (FSC), PC (positive control; quercetin 20 mg/kg), OPE-4 (OPE 4 mg/kg), OPE-20 (OPE 20mg/kg), and OPE-100 (OPE 100mg/kg). All rats received a volume of 10 mL/kg vehicle or vehicle with OPE via oral administration daily for 4 weeks. Vehicle without OPE was administered to the rats in the FSC and NC group, rats in the PC group received vehicle containing 20 mg/kg quercetin, and rats in the OPE-4, OPE-20, and OPE-100 groups received 4, 20, and 100 mg/kg OPE, respectively.
Forced swimming test
We used the rat forced swimming test to evaluate the effect of the OPE on the immune status according to a previous reported method [13]. In brief, the apparatus used in this test was an acrylic plastic pool (width, depth, and length (cm): 100×80×100) filled with water to a depth of 50 cm. The surface of the tank was clear and smooth to prevent the rats from supporting themselves while swimming. A current was generated in the pool by circulating the water with a pump. The water temperature was maintained at 25±2℃ by using a water heater (Aquarium Heater 3615200, EIEIM GmbH & Co. KG., Germany). Steel washers were attached to the tail of each rat. The washers weighed approximately 4% of the rat body weight. At the end of the 4-week treatment period, all rats, except those in the NC group, were fasted overnight and were subjected to the forced swimming test. Endurance was defined as the time from placement into the pool until the time that the animal remained submerged in water without movement. Rats underwent the test until they reached exhaustion, i.e., when they failed to rise to the water surface to breathe within a 7-s period.
Body weights and food consumption and organ weights
Body weights and food consumption of the rats were evaluated during the experimental period with digital weighing scales (IB-3100, Innotem Co., Korea). The thymus and spleen were removed from anesthetized rats immediately after completion of the forced swimming exercise, and their weights measured.
Histopathological analysis
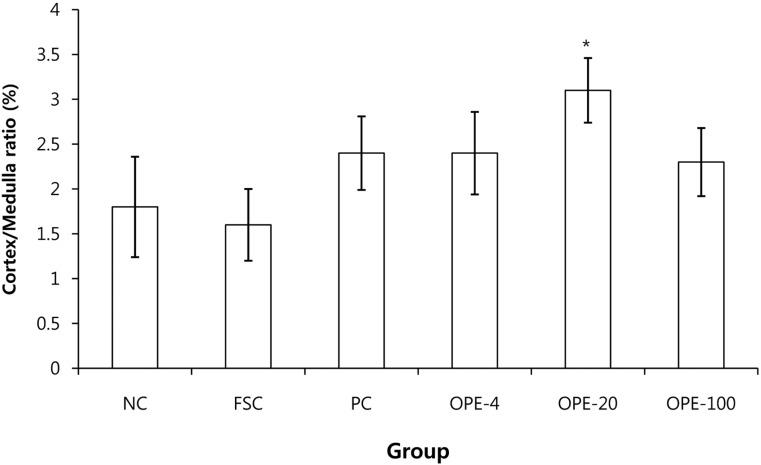
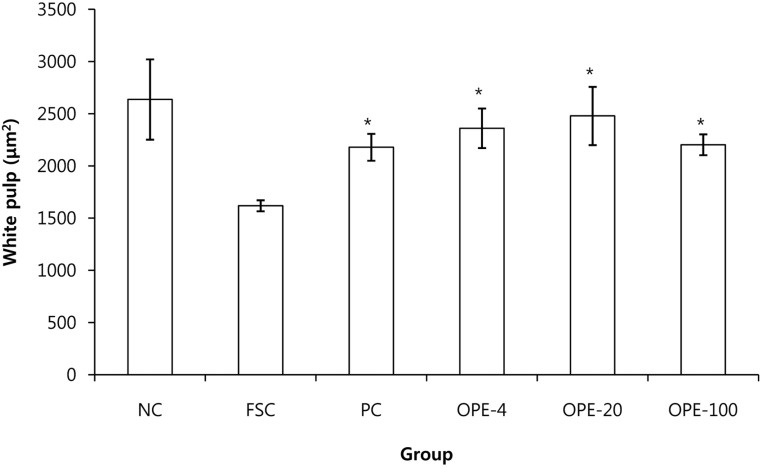
For histological analysis, the dissected tissues were fixed in 10% buffered formalin, routinely processed, and embedded in paraffin. Four-micrometer sections were cut using a microtome (Shandon, UK) and stained with hematoxylin & eosin (H&E). Thymuses and spleens were first stained with classic H&E and then analyzed using Image analyzer (Focus Technology, Germany). The ratio of thymic cortex to medulla was determined on whole thymus image slides according to a previous reported method [14]. Briefly, we measured each cortex and medullar thickness in thymus with Image analyzer (Focus Technology). Then, the ratio of thymic cortex to medulla was calculated. We also evaluated the area of the white pulp in the spleens according to Elmore [15]. The areas of the white pulps were measured with Image analyzer and then, the average values were calculated.
Blood cell counts and cytokine analysis
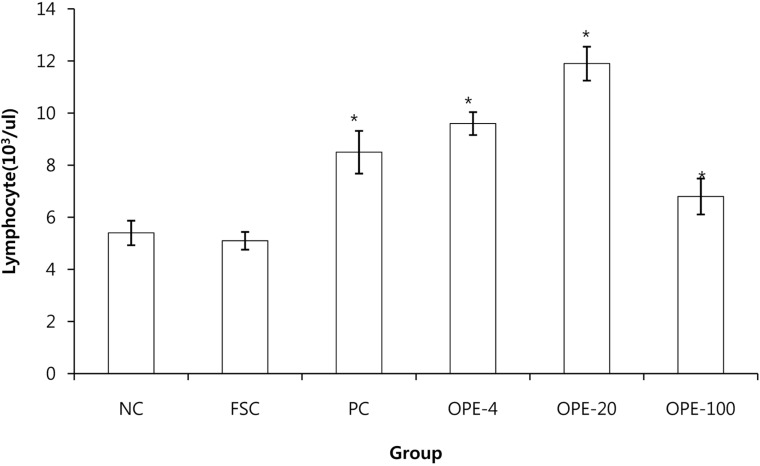
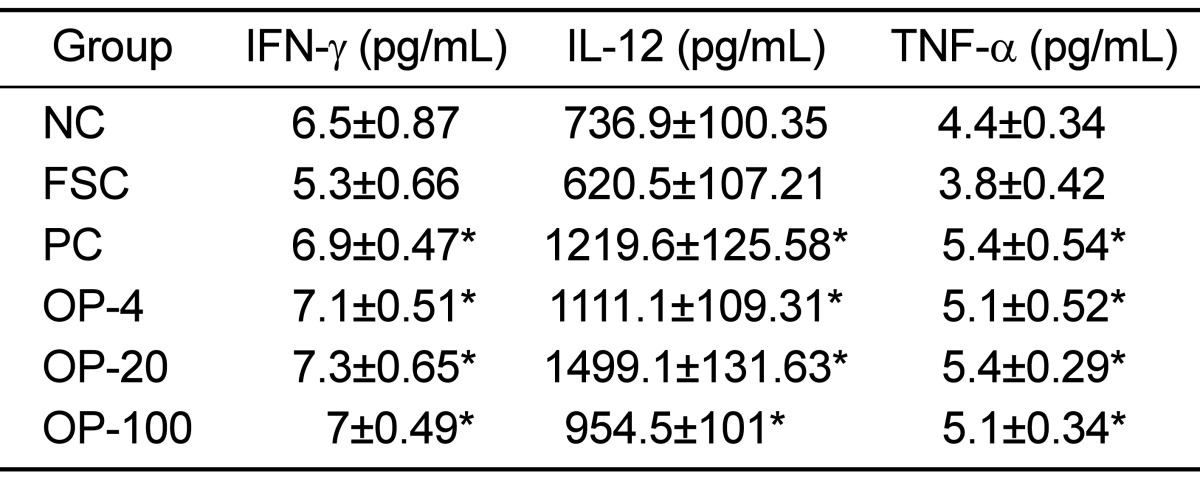
Immediately after the forced swimming test, blood was collected from the abdominal vein prior to necropsy. Blood lymphocyte numbers were counted using an automatic blood cell counter (LC660 HORIBA, Japan). Blood samples were centrifuged at 3,000 rpm at 25℃ for 10 min (Micro17TR, Hanil Science Industrial Co., Ltd, Korea). The serum IFN-γ and TNF-α levels were determined with a fluorescence kit (Millipore, USA), and the serum IL-12 level was determined with Luminex LX200 (Invitrogen, USA) by using a Microplate Reader VERSA Max (Molecular Devices, USA).
Results
Quercetin, total polyphenol, and total antioxidant content determination
The amount of total polyphenol of OPE was 34.74 mg/g. Quercetin measurements were done using HPLC and the concentration was 13.50 mg/g. The total antioxidant status was 63.33 mg/g.
Body weight gain and food intake and organ weights
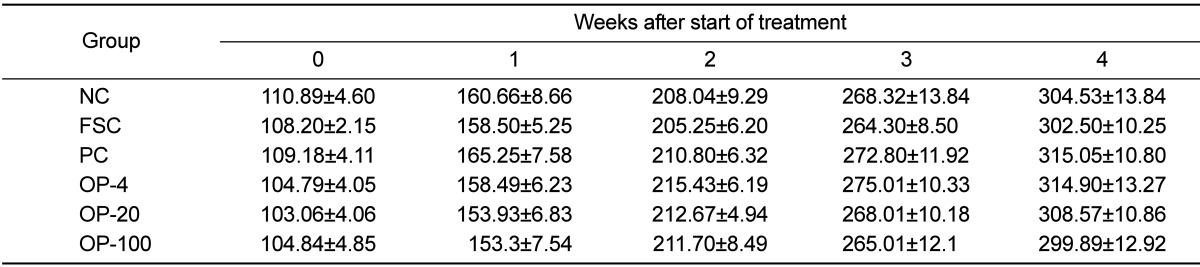
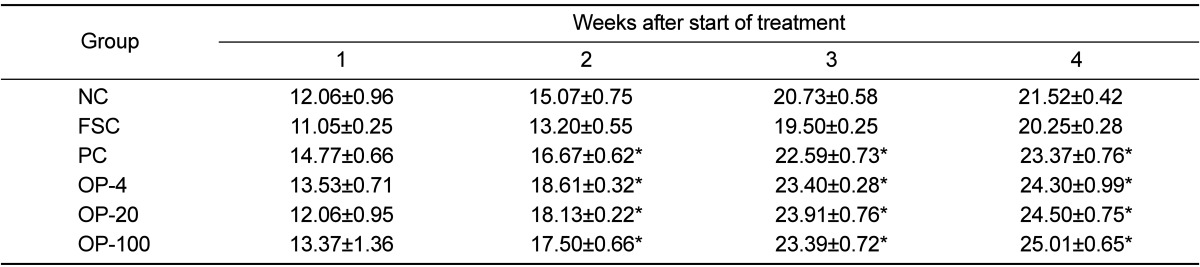
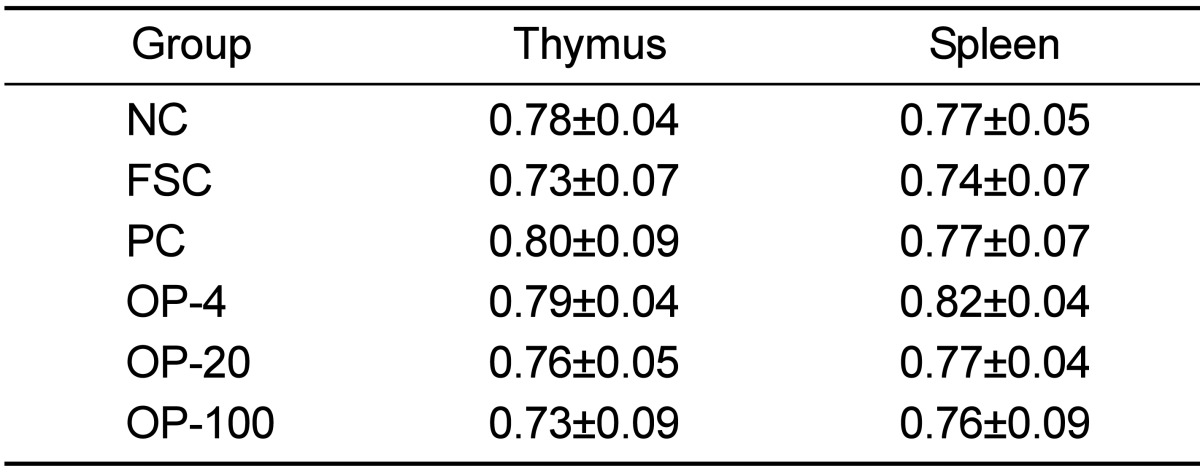
Table 1 presents the body weights of the rats during the 4-week experimental period. There were no significant differences between the groups. Although not statistically significant, the body weights of the rats in the FSC group were relatively low as compared with those of rats in other groups. Table 2 shows the average amount of food intake (g/day) during the 4-week experimental period. The OPE-treated groups consumed more food than the FSC group since 2 weeks after inoculation (P<0.05). The weights of the spleen and the thymus after the 4-week experimental period are shown in Table 3. No significant differences were found in the weights between the different treatment groups. Although not statistically different, the weights of the spleen and the thymus of the FSC group were relatively low as compared with those of the other groups.
Discussion
Onions are among the most highly consumed vegetables worldwide and contain several kinds of flavonoids, predominantly quercetin, and smaller quantities of kaempferol, isorhamnetin, anthocyanin, and taxifolin [8]. Besides quercetin, onions also contain antioxidants and quercetin derivatives where glycosyl moieties are found at different positions in the molecule [16,17]. Several epidemiologic and animal studies suggest beneficial health effects, including antidiabetic, anticancer, and antifungal activities [18,19,20], of flavonoids and organosulfur compounds, all of which are abundant in onions [21].
Until now, it had not been reported whether OPE has an anti-fatigue and exercise-enhancing effect. However, in the present study, the maximal exercise performance periods of the rats were used to evaluate the effects of OPE on physical activity. The forced swimming test has been widely used for evaluating physical activity and immune depletion [22,23,24,25]. In this study, we used forced swimming test and obtained the results indicated that the administration of OPE may enhance immune status.
Recently, research to discover immune-modulating compounds in natural products is being actively pursued [26,27,28,29]. Onion peel contains large amounts of total polyphenols, antioxidants, and quercetin [9]. Previous studies on the effects of onion peel were conducted with ethanol extracts [12,20,30]. Jung et al. [20] used 60% ethanol extracted OPE, which contained 101.28 mg/g quercetin. They treated the rats with diet containing 0.5, or 1% of OPE. In the present study, we used water extracted onion peel, which contained 13.50 mg/g quercetin. We inoculated per orally the rats with 4, 20 and 100 mg/kg respectively. In this study, OPE 20 mg/kg treated rats revealed most prominent enhancement of the immune status in rats.
TNF-α is produced by several immune cells, such as macrophages and T, B, and natural killer (NK) cells and modulates not only cell survival but also cell death (apoptosis). It is therefore referred to as a "double-edged sword" [31]. In particular, it is important in regulating inflammation and the host defense in response to bacterial infection [32]. IFN-γ is a type II interferon that exerts its effects through its receptors IFN-γR1 and IFN-γR2 [33], and activates JAK1, JAK2, and subsequently STAT1 [34]. It was recently approved by the United States Food and Drugs Authority (US FDA) for improving chronic granulomatous disease and malignant osteopetrosis [26]. IL-12 is involved in the differentiation of naive T cells into Th1 cells [35]. It is known as a T cell-stimulating factor, which can stimulate the growth and function of T cells. It stimulates the production of IFN-γ and TNF-α from T cells and NK cells, and reduces the IL-4-mediated suppression of IFN-γ [35]. Abood et al. [36] found that the intake of Tinospora crispa, which contains a high concentration of polyphenols, enhanced the immune status through the stimulation of INF-γ, IL-6, and IL-8 expression. Cyrtomium macrophyllum (Makino) Tagawa is also rich in polyphenols and the intake of the ethanol extract can improve immune function by enhancing T and B cell proliferation responses and macrophage function [37]. In addition, it has been reported that the administration of the polyphenol-rich Brazilian green propolis has a positive effect on the innate and adaptive immunity in aged mice [38].
Generally, water extracts of herbal compounds are advantageous over ethanol extracts from an economical, procedural, and safety point of view [39]. In this study, OPE was obtained by a water extraction method; therefore it could also be useful for the functional food industry. Rats in the OPE-treated groups exhibited higher food consumption and had an increased thymic cortex to medulla ratio than that observed in the rats of the FSC group (P<0.05). Furthermore, the area of the white pulp in the spleens of the OPE-fed rats was increased compared with that in the FSC rats (P<0.05). The IFN-γ, TNF-α, and IL-12 levels and blood lymphocyte numbers were significantly increased in the OPE-fed groups than those in the FSC-fed group (P<0.05). We observed the significant increase of cortex/medulla ratio, white pulp, and lymphocytes in the OPE-treated groups. Especially, the increases were most prominent in OPE-20 group. We thought that the optima dose of OPE for the immune enhance may be 20 mg/kg in rats.
Our results suggest that OPE can enhance immunity by increasing the number of immune-related cells and the concentration of specific cytokines. Considering that the majority of onion peels end up as waste with limited use, this study suggests the potential of a supplementary use of onion peels in the management of physical activity and immune status.
 XML Download