

 PDF
PDF ePub
ePub Citation
 Print
Print


INTRODUCTION
Allergic rhinitis (AR) occurs in over 500 million people worldwide and its prevalence is increasing rapidly.1 The management of AR encompasses education, pharmacotherapy, immunotherapy, and surgery. Despite the broad spectrum of strategies for the treatment of AR, there is a need for new effective therapeutic options with fewer side effects. Serine proteases are involved in the maintenance of the epithelial barrier in the skin and airways and can cause epithelial lysis. Several recognized mutations and defects in genes controlling serine protease inhibitors and proteases are associated with allergic conditions.2,3 To understand how defects in protease homeostasis may specifically stimulate allergic responses such as an epithelial barrier lysis, a Th2 cytokine shift and IgE stimulation, the immunological responses of dust mite serine and cysteine protease allergens can be examined.4 Compound 4-(2-Aminoethyl) benzene sulfonyl fluoride hydrochloride (AEBSF) is an irreversible serine protease inhibitor with broad specificity (trypsin, chymotrypsin, plasmin, thrombin, kallikreins) and high affinity. AEBSF is a unique molecule that can inhibit serine proteases as well as NADPH oxidase, the primary enzyme responsible for catalyzing the production of reactive oxygen species in epithelial cells, inflammatory cells, and phagocytes.5 Due to these properties, we hypothesized that AEBSF might reduce allergic airway inflammation. Recently, it was reported that nafamostat mesilate, a potent serine protease inhibitor, inhibits airway eosinophilic inflammation and airway epithelial remodeling in a murine model of allergic asthma.6 Additionally, several serine protease inhibitors induce interlukin (IL)-10 in an airway allergic model.7 IL-10 is a key mediator released from regulatory T (Treg) cells that protects against allergic diseases.8 We hypothesized that induction of Treg cells may be associated with the anti-allergic effect of AEBSF in an allergic model.
In this report, we explored the effect of AEBSF on allergic inflammation and induction of Treg cells in a mouse model of AR. In addition, we explored differences in the effect of AEBSF according to the timing of its administration.
MATERIALS AND METHODS
Experimental animals
Six-week-old healthy female BALB/c mice (20-30 g) were used in the present study. The experiment was performed with the approval of the Institutional Animal Care and Use Committee at the Catholic University of Korea.
Reagents
Derf crude body extract (Arthropods of Medical Importance Resource Bank, College of Medicine, Yonsei University, Seoul, Korea) was used as allergen. The Derf crude extract was solubilized and stored at -70℃ and dissolved prior to use. The serine protease inhibitor AEBSF (Sigma Aldrich, St. Louis, MO, USA) and ciclesonide (Omnaris®, Nycomed Canada Inc., Oakville, Ontario, Canada) were prepared in sterile phosphate-buffered saline (PBS).
Production of the AR model and treatment protocol
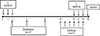
Forty mice were randomized into 5 groups: CON (control, n=8), Derf (AR mice, n=8), S (AR mice treated with AEBSF before sensitization, n=8), C (AR mice treated with AEBSF after challenge, n=8), and steroid (AR mice treated with steroid before challenge, n=8). Allergen sensitization and challenge for development of the AR murine model are summarized in Fig. 1. Briefly, on days 2, 9, and 16, all mice were immunized by intraperitoneal injection of 100 µg Derf and 1-mg aluminum hydroxide (Sigma Aldrich). Mice in the S group were treated intranasally with 10 µg AEBSF on days 0-2. One week after sensitization, all mice were challenged intranasally with 20 µg Derf for 6 consecutive days. Mice in the C group were treated intranasally with 10 µg AEBSF on days 26-28. Mice in the steroid group were treated intranasally with 20 µg of ciclesonide on days 26-28. The control group received PBS intranasally instead of Derf.9
Evaluation of allergic symptoms induced after allergen challenge
The numbers of sneezing and nose-rubbing motions during the 15 minutes after the final allergen challenge were recorded and compared among the experimental groups by observers blinded to the experimental groups.10
Nasal lavage fluid (NALF)
Using ether anesthesia, thoracotomies were performed on the mice in each group 24 hours after the final allergen challenge. NALF was obtained after partial tracheal resection using a 22-gauge catheter. The catheter was inserted into the tracheal opening and advanced in the direction of the upper airway into the nasopharynx. The nasal passages were perfused with 1 mL of PBS from the choana to the nostril, and NALF was collected from the nares.11,12
Nasal mucosal tissue evaluation
Mice were sacrificed and decapitated 24 hours after the final allergen challenge. The heads were fixed in 4% paraformaldehyde for three days at 4℃, washed in running water, decalcified for three days with Calci-Clear Rapid (National Diagnostics, Atlanta, GA, USA)13 at room temperature, dehydrated by passage through a graded alcohol series, and embedded in paraffin blocks. The blocks were cut into 4-µm-thick sections and stained with hematoxylin and eosin to evaluate the general morphology and the number of eosinophils in the lamina propria. Eosinophils were counted under a light microscope. The individuals who counted eosinophils were blinded to the animals' group assignments.
Cytokine levels in NALF and Derf-specific immunoglobulin E levels in serum
To evaluate the allergic reaction using NALF, interferon (IFN)-γ and IL-10 levels were measured using enzyme-linked immunosorbent assays (ELISA; Multiplex; Millipore, Billerica, MA, USA). Serum Derf-specific immunoglobulin E (IgE) levels were measured using an ELISA kit (Indoor Biotechnologies, Manchester, UK).
Real-time polymerase chain reaction (PCR)
The nasal mucosa was removed for detection of IL-13 and TGF-β using real-time PCR. The spleen was removed from each animal aseptically 24 hours after the final challenge. Total RNA was extracted from splenic mononuclear cells using the TRIzol reagent (Invitrogen, Carlsbad, CA, USA), and the first strand was reverse-transcribed using random primers (TaKaRa, Otsu, Japan).14,15 The oligonucleotide primer sequences were as follows: T-bet forward primer, 5'-GCCAGGGAACCGCTTATA-3', and T-bet reverse primer, 5'-CCTTGTTGTTGGTGAGCTTTA-3'; GATA-3 forward primer, 5'-CTGGATGGCGGCAAAGC-3', and GATA-3 reverse primer, 5'-GTGGGCGGGAAGGTGAA-3'; Foxp3 forward primer, 5'-GAAAGCGGATACCAAATGA-3', and Foxp3 reverse primer, 5'-CTGTGAGGACTACCGAGCC-3'; IL-13 forward primer, 5'-CCTCTGACCCTTAAGGAGCTTAT-3', and IL-13 reverse primer, 5'-CGTTGCACAGGGGAGTCT-3'; TGF-β forward primer, 5'-CCTCTGACCCTTAAGGAGCTTAT-3', and TGF-β reverse primer, 5'-CGTTGCACAGGGGAGTCT-3'; glyceraldehyde 3-phosphate dehydrogenase (GAPDH) forward primer, 5'-GCACAGTCAAGGCCGAGAAT-3', and GAPDH reverse primer, 5'-GCCTTCTCCATGGTGGTGAA-3'. The T-bet, GATA-3, Foxp3, IL-13, TGF-β, and GAPDH mRNA levels were determined using real-time PCR with the ABIPRISM 7300 Real-Time PCR System (Applied Biosystems, Foster City, CA, USA) and SYBR Green PCR master mix (TaKaRa). The levels of expression of these mRNAs were analyzed using the ABI 7300 Sequence Detection System (Applied Biosystems). The results were normalized relative to GAPDH expression and are shown as fold increases compared to the control group.
Flow cytometry
For cell-surface staining, aliquots of 106 splenic mononuclear cells were incubated with fluorescein isothiocyanate (FITC)-conjugated anti-mouse CD4 (GK1.5) antibody (eBioscience, San Diego, CA, USA). For intracellular staining, cells stained with CD4 were incubated with fixation/permeabilization working solution, and Fc receptors were blocked with excess mouse Fc block. Cells were then stained with anti-phycoerythrin (PE)-Cy5-conjugated anti-mouse Foxp3 (FJK-16s) and anti-allophycocyanin (APC)-CD25 antibodies (eBioscience). CD4+CD25+Foxp3+ T cells were analyzed by flow cytometry (FACSCalibur; Becton Dickinson, San Jose, CA, USA).15,16
Proteolytic activity in NALF
To evaluate proteolytic activity in NALF, green fluorescent dye-impregnated casein (Sigma Aldrich) was used as a substrate. Ten milligrams of substrate in 1 mL of Tris-HCl buffer (pH 6.5) were incubated with 20 µL of NALF at 20℃. After 60 minutes of incubation with constant shaking at 200 rpm, 4% trichloroacetic acid was added to stop the reaction. The mixture was centrifuged and the absorbance was measured at 490/525 nm. One unit of specific activity was defined as a 1.00 change in absorbance per microgram of protein per hour.
Statistical analysis
All measured parameters were expressed as means±standard deviation. Differences among groups were analyzed using the Kruskal-Wallis test. In cases of statistical significance, the ranked parameters were compared using one-way analysis of variance and Bonferroni's multiple comparison tests (PASW Statistics 18; SPSS Inc., Chicago, IL, USA). In all analyses, P<0.05 was considered to indicate statistical significance.
RESULTS
Allergic symptoms
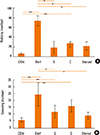
Allergic symptoms were determined based on the numbers of nasal rubbing motions and sneezes during the 15 minutes after the final challenge. The numbers of nasal rubbing motions were 6.0±1.58 in the CON group, 73.62±10.11 in the Derf group, 18.62±12.91 in the S group, 27.37±9.13 in the C group, and 21.62±8.66 in the steroid group. The numbers of sneezes were 6.0±1.58 in the CONgroup, 24.37±8.55 in the Derf group, 11.83±4.7 in the S group, 16±4.56 in the C group, and 9.12±2.35 in the steroid group. The number of nasal rubbing motions was significantly higher in the Derf group than in the other groups (all P=0.000; Fig. 2A). The number of sneezes was significantly higher in the Derf group than in the CON, S, and steroid groups (P=0.000; vs P=0.002, vs P=0.000; Fig. 2B).
Serum Derf-specific IgE
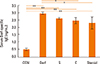
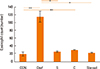
Serum Derf-specific IgE levels were significantly higher in the Derf group (2.95±0.07 ng/mL, P=0.000) than in the CON (0.52±0.08 ng/mL), S (2.61±0.06 ng/mL, P=0.018), C (2.46±0.20 ng/mL, P=0.002) groups, and steroid (2.30±0.39 ng/mL, P=0.000) groups. The CON group had a significantly lower serum Derf-specific IgE level than all other groups (P=0.000; Fig. 3).
Eosinophil counts in the lamina propria
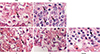
Fig. 4 shows eosinophil infiltration in the lamina propria. Eosinophil numbers were 20±5.35 in the CON group, 115.3±13.65 in the Derf group, 26±1.73 in the S group, 30.6±1.15 in the C group, and 23.6±1.15 in the steroid group. The eosinophil count was significantly higher in the Derf group than in the S (P=0.024) and steroid (P=0.002) groups (Fig. 5).
NALF cytokine analysis
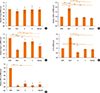
IFN-γ levels in NALF were 9.86±2.40 pg/mL in the CON group, 4.00±1.06 pg/mL in the Derf group, 4.61±1.87 pg/mL in the S group, 3.91±0.64 pg/mL in the C group, and 4.61±1.65 pg/mL in the steroid group. IFN-γ levels were higher in the CON group than in all other groups (Derf, P=0.003; S, P=0.011; C, P=0.012; Steroid, P=0.031; Fig. 6A).
IL-10 levels in NALF were 4.45±3.62 pg/mL in the CON group, 4.54±4.03 pg/mL in the Derf group, 162±13.52 pg/mL in the S group, 151.0±9.0 pg/mL in the C group, and 3.78±0.65 pg/mL in the steroid group. The IL-10 level was significantly higher in the S and C groups than in the Derf group (S, P=0.028; C, P=0.049; Fig. 6B).
Real-time PCR
T-bet, GATA-3, and Foxp3 mRNA levels in splenic mononuclear cells were evaluated using real-time PCR. T-bet mRNA levels showed no significant differences among the groups (Fig. 7A). The GATA-3 mRNA level was significantly higher in the Derf group than in the CON (P=0.000), S (P=0.009), C, and steroid groups (all, P=0.000; Fig. 7B). Foxp3 mRNA levels were significantly higher in the S (P=0.000), C (P=0.000), and steroid (P=0.013) groups than in the Derf group (Fig. 7C). IL-13 mRNA levels were significantly higher in the Derf group than in the S (P=0.000), C (P=0.001), and steroid (P=0.001) groups (Fig. 7D). TGF-β mRNA levels showed no significant differences among the groups (Fig. 7E).
Flow cytometric analysis of CD4+CD25+Foxp3+ T cells from splenic mononuclear cells
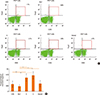
Cells were sorted based on Foxp3 and CD25 expression levels and whether they expressed CD4 (Fig. 8A). CD4+CD25+Foxp3+ T cells accounted for 0.065±0.026% of all splenic mononuclear cells in the CON group, 0.047±0.013% in the Derf group, 0.122±0.033% in the S group, 0.143±0.033% in the C group, and 0.07±0.028% in the steroid groups. The S and C groups had significantly
higher percentages of these cells than the CON (S, P=0.008; C, P=0.000) and Derf (S, P=0.000; C, P=0.000) groups. The steroid group had a significantly higher percentage of CD4+CD25+Foxp3+ T cells than the Derf group (P=0.008) (Fig. 8B).
AEBSF modulates the proteolytic activity in NALF
Derf-sensitized and challenged mice showed increased protease activity in NALF. AEBSF treatment significantly reduced proteolytic activity in S and C groups (Fig. 9). Additionally, there was a significant reduction in protease activity in NALF of the steroid group compared with that in the Derf group.
DISCUSSION
Steroids, a major therapeutic agent for AR, are not an ideal treatment because of undesirable side effects with long-term use. Thus, there is a need for new effective therapeutic options with fewer side effects. One therapeutic strategy is to use serine protease inhibitors, anti-inflammatory proteins that are thought to play a protective role in allergic disease.18
Earlier studies suggested that the protease load in human airways increases significantly following allergen exposure and lead to a protease-anti-protease imbalance at the respiratory mucosal surfaces.19,20,21 Treatment of ovalbumin-sensitized mice with AEBSF was reported to suppress the development of hallmark features of allergic airway disease in several previous studies.22,23 In this report, we investigated the effect of AEBSF on an allergic inflammation model and determined the underlying mechanism of the anti-allergic effect of AEBSF in the AR model.
In the present study, AEBSF treatment was performed in sensitized mice, which were administered intranasal treatment to limit the effect of protease inhibitors on affected tissue. The dose of AEBSF used was determined in a preliminary study.22
In our study, repeated exposure to Derf induced a T helper 2 (Th2) milieu in mice with a subsequent increase in serum IgE levels, GATA-3 expression levels in the spleen, IL-13 expression levels in nasal mucosa, and tissue eosinophil counts. AEBSF treatment significantly decreased serum IgE levels, GATA-3 mRNA levels, and IL-13 mRNA levels in the S and C groups compared with those in the Derf group. Tissue eosinophil counts were also reduced significantly in both the S and C groups. These results indicated that AEBSF decreases the Th2 response.
We next explored how the AEBSF pathway generates an anti-allergic effect in the AR model. One proposed mechanism is that an imbalance in proteases and anti-proteases can result in lysis of the epithelial barrier.4,24 Dust mite serine proteases and serine/cysteine protease inhibitors are involved in the maintenance of the epithelial barrier in the skin and the airways. Additionally, it was reported that house dust mite cysteine proteases influence Th2 and IgE regulation. One role of house dust mite protease is cleaving the IL-2 receptor (CD25) from T cells, blocking a major Th1 cytokine, and increasing IL-4 from T lymphocytes.4 IL-2 is a key growth and survival factor for natural Treg cells. And CD25 is a component with high affinity IL-2 receptor. IL-2 receptor is therefore an indispensable molecule for their anti-allergic effect in Treg cells.25 We suggested that the serine protease inhibitor can prevent destruction of the IL-2 receptor. In addition, it may have an anti-allergic effect through Treg cells.
One cellular mechanism for maintenance of immune tolerance to foreign antigens, including allergens, is the natural Foxp3+ Treg cell population.26,27 These cells have been implicated as potent inducers of a nonresponsive state in several immune-mediated pathologies, such as autoimmunity, graft-versus-host disease, and allergy.28,29,30,31,32 For allergies, it has been shown that Treg cells can be transferred, conferring specific tolerance to subsequent challenges with allergen.33,34 Importantly, Foxp3 deficiency in mouse models leads to severe immune dysregulation characterized by allergic and autoimmune manifestations.35 In our study, Foxp3 mRNA levels were significantly increased in both the S and C groups compared with those in the Derf group. The percentage of CD4+CD25+Foxp3+ T cells determined by flow cytometry also increased significantly in both S and C groups compared with the Derf group. Thus, AEBSF may induce CD4+CD25+Foxp3+ Treg cells.
Other studies suggested that nafamostat mesilate and gabexate mesilate increased IL-10 levels in an airway inflammation model.6 It was also reported that the IL-10 level increased significantly in the AEBSF treatment group of mice compared with the control group.22 Thus, in the present study, we focused on the role of IL-10-secreting Treg cells in the anti-allergic effect of a serine protease inhibitor.
In our study, IL-10 levels increased significantly in both the S and C groups compared with those in the Derf group. Additionally, our hypothesis that the induction of Treg cells may be related to the anti-allergic effect of AEBSF in the allergic model is supported by our findings.
In summary, the anti-allergic effect of AEBSF in the AR model can be explained by several pathways. First, serine protease inhibitors can prevent lysis of the epithelial barrier. If the epithelium becomes disrupted, then there is an increase in trans-epidermal water loss and the subepithelium is more exposed to bacteria and allergens.4,24 Second, AEBSF may influence Th2 and IgE regulation through several mechanisms. For example, serine protease inhibitors may prevent an increase in IL-4 and activation of PAR receptor.4 Third, AEBSF may induce Treg cells, which suppresses allergic responses via their capacity to inhibit various immune responses.36 Additionally, IL-10-secreting Treg cells (called Tr1 cells, one subset of Treg cells) may play an important role in the anti-allergic effect of AEBSF in the AR model.25 There may be no significant difference in the effect of Treg cells according to the timing of AEBSF administration.
Our study differs from prior research in several respects. An important strength of the present study was the use of intraperitoneal sensitization and intranasal challenge with D. farinae, which is the most common aeroallergen to elicit AR in human patients. Additionally, we hypothesized that Treg cells play a role in the anti-allergic effect of AEBSF. Our data support a relationship between induction of Treg cells and the anti-allergic effect of AEBSF.
CONCLUSIONS
Both prophylactic and therapeutic treatment with AEBSF significantly reduces allergic airway inflammation and may induce Treg cells in a murine model of AR. Additionally, no significant difference was found in the effect of Treg cells according to the timing of AEBSF administration. Overall, the anti-allergic mechanism of AEBSF requires further investigation.


 XML Download