

 PDF
PDF ePub
ePub Citation
 Print
Print


INTRODUCTION
Food Hypersensitivity (FH) is defined as the presence of any adverse reaction after food consumption; unlike food allergy, it is feasible to demonstrate the presence of immunologic mechanisms.1 In some regions of the world, there is a perception that FH has shown substantial increment.2 The prevalence of FH ranges from 3% to 35% (based on self-report of symptoms)3 and is considered more common in the early years of life.4 In fact, children were studied more frequently, and it is believed that FH in adults is an uncommon condition. Recent surveys have estimated the prevalence of FH to be between 12% and 20% in adults.5,6,7,8,9
The consequences arising from the suspicion of FH on a family member may influence eating habits of all household members, even in the absence of a confirmed diagnosis.10 Foods involved in the presentation of these events vary considerably, and these changes depend on prevalent eating habits in each country or continent.9,11,12,13,14 The prevalence of FH in our country for adults is unknown, and most studies have focused on children. Therefore, we aimed to determine the prevalence of FH, their clinical manifestations, and food involved in adults.
MATERIALS AND METHODS
Design and setting
We conducted a cross-sectional survey from December 2012 to April 2013, where young adults (18 to 24 years old) and adults (25 to 50 years old) were recruited from the general population, invited from a recreational pathway ("Via Recreactiva") of the metropolitan area of Guadalajara (Guadalajara, Zapopan, Tlaquepaque, and Tonala), Jalisco, Mexico. The recreational pathway comprises a route through main streets of the cities previously mentioned, that simulate a park to perform sport, cultural and recreational activities on Sundays. This event has been carried out since 2006, approximately 140 thousand people assist on a regular day, and the population includes all economic strata as well as all ages.
Sampling and data collection
The sample was obtained through systematic sampling by age and sex, prefixed by quota according to residential cities. Each "Via Recreactiva" route was considered a stratum and corresponded to one of the studied cities. We calculated a proportional sample size to the number of people in adulthood for each stratum, so for example, if a city contributed with 10% of the total of inhabitants of the metropolitan area, we ensured that the sample obtained from the "Via Recreactiva" route also contributed with 10% of the total sample size. Operating modules were strategically placed in each city to ensure the adequate recruitment of subjects, and they were selected consecutively as they were concurring to the selected place.
Pilot test
Two medical students and 1 nutrition student were trained for subject selection and data recompilation. They were also instructed in the following topics: a) hypersensitivity reaction type I; b) an overview of allergic diseases; c) food allergy and; and d) technical application of food survey.
The pilot test aimed to identify possible errors in the questionnaire or insufficient training of the interviewers. It was conducted with 50 interviewed subjects in public places of the city of Guadalajara, and these results were not considered for the final analysis.
Questionnaire
The first requirement to include patients was to answer affirmative the question: "Do you suffer from allergic reactions after eating or drinking?"; then, they were interrogated about personal history of allergic diseases diagnosed by a physician (asthma, allergic rhinitis, atopic dermatitis, drug allergy, and urticaria), type of discomfort, and food associated with FH.
Definitions
FH was defined according to guidelines proposed by the European Academy of Allergology and Clinical Immunology, which consider the presence of symptoms or reproducible signs initiated by exposure to food in which mechanisms involved are immunological or not immunologically related.1
Ethics
Approval of the study was obtained from the Research Ethics Committee of the University of Guadalajara Lamar and Municipal Sports Council of each participating city, and a verbal informed consent was obtained from each participant.
Statistical analysis
The prevalence of FH was calculated by dividing its frequency by the number of respondents at the time of the study. To compare proportions, Chi-square test was used or Fisher's exact test as needed. We performed Student's t test for the comparison of quantitative variables with normal distribution for independent groups. Associated factors were identified by odds ratio (OR), with confidence intervals set at 95% (95% CI). Any value of P≤0.05 was considered statistically significant. All statistical analyses were performed using SPSS version 20.0 (IBM Co., Armonk, NY, USA).
RESULTS
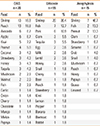
Out of 1,126 subjects interviewed, 188 showed FH (16.7%; 95% CI, 14.5%-18.8%). We observed a prevalence of 17.5% (99 of 565) in women and 15.9% (89 of 561) in men, without statistically significant difference (Table 1).
The most common clinical manifestations of FH are shown in Table 2, seventy subjects presented oral allergy syndrome (OAS), 55 had urticaria, and 15 had anaphylaxis.
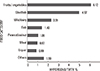
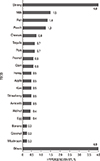
FH was mostly associated with fruits and vegetables (6.12%), followed by seafood (4.97%), shrimp (4.0%), milk (1.5%), and fish (1.4%) (Fig. 1 and 2); peanut, walnut, and others were below 1%; kiwi, avocado, and banana showed a prevalence of <0.5%.
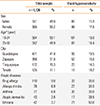
The most common food associated with IgE-mediated clinical entities is shown in Table 3. Shrimp and peach was more commonly related to OAS (18.8% for each); shrimp (36.4%) and fish (12.7%) to urticaria; and shrimp (46.7%) and fish (13.3%) to anaphylaxis. Interestingly, 8 subjects had hypersensitivity to tequila, 3 of them were women, and none had a history of allergic disease, with the following clinical manifestations: OAS (n=3), urticaria (n=3) and headache (n=2).
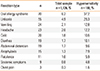
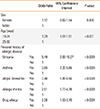
Adults at<25 years of age had a higher frequency of FH (OR, 1.39; 95% CI, 1.01 to 1.91; P<0.001), and also the personal history of some atopic diseases was significantly associated with FH (P<0.0001) (Table 4).
DISCUSSION
In our study, we observed that perception of FH in adult residents of Guadalajara metropolitan area was 16.7% and that there was homogeneity among studied cities, without significant prevalence differences between genders.
Recent surveys have reported a 12 to 20% prevalence of FH in adults.5,6,7,8,9,15 A recent multicenter study conducted in Europe showed that FH perception index differs markedly between countries.16 Some investigators have reported prevalence exceeding 20% in some regions,9,17 while others have shown prevalence under 10%.11,14 Estimated prevalence was reported to be 9.1% in the United States,12 8.3% in Canada,18 and 14.9% in Colombia.13 Fifteen studies on FH have been carried out in Latin America,19 (9 in Mexico); however, none of them had a population basis, so our study provides relevant information in this regard. As there is a wide variation in the prevalence of FH worldwide possibly due to methodological differences, demographic and cultural conditions related to food consumption habits must be considered.3, 9,11,12,14
OAS and urticaria were the most common symptoms of FH; OAS symptoms include oropharyngeal and lip itching immediately after food contact20 and represent the most common food allergy in adults.21,22 For subjects who presented FH, the frequency of OAS perception was 37.3%, similarly to that observed in Spain (46.5%),23 in contrast to Colombia (4.7%).13
Regional eating habits and methods of food preparation play an important role in the prevalence of food category mostly associated with FH, with seafood, fruits/vegetables, milk/dairy products, and peanuts being most commonly reported.11,12,13 Our results are consistent with those of previous studies.12,13 Shrimp, milk, and fish were the most common foods related to FH. Although Mexico is one of the countries with the lowest per capita seafood consumption, compared to Japan, Spain, and the United States, the proportion of subjects with self-reported hypersensitivity to shellfish has been increased. The prevalence of hypersensitivity to fish and seafood was reported to be 0.4%-2.0% in the United States,24 and 0.6%-1.9% in Canada.18 In Denmark, the prevalence of hypersensitivity to fish was 0.6%, and that to seafood was 1.1%.21 This is probably related to an increased self-perception of fish and seafood allergy or genetic predisposition to development of FH. In the case of milk, it is known that the prevalence of allergy is higher in the pediatric population than in adults and that adverse reactions to milk have more to do with the likelihood of lactose intolerance.25
Peanut is one of the most commonly causes of food allergy. We observed a prevalence hypersensitivity of 0.6%, similarly to the reported prevalence of 0.5% in the United States,12 0.78% in Canada,18 and a relatively high prevalence of 1.17% in Denmark.21 Nut allergy has also been reported in those studies with a prevalence of 0.5%, 1.07%, and 0.5% respectively,12,18,21 which is similar to ours (0.5%).
It is difficult to estimate the prevalence of FH to kiwi, mango, and banana which frequently cross-react with latex due to the shortage of information, differences in eating habits, geographical differences or methods used for diagnosis. The prevalence of FH to kiwi and banana have been reported to be 7.8% and 0.4%, respectively.21 An additional study found that the prevalence of kiwi allergy was 0.09%.26 With the exception of kiwi, our results are consistent with those of these studies.
Ethanol hypersensitivity reactions were previously described,27,28 and a cross-sectional study based on a questionnaire reported a prevalence of intolerance to wine of 7.2%.29 An interesting finding in our study was the presence of hypersensitivity to tequila in a very similar proportion to peanut, clam, apple, and kiwi. Tequila is extracted from the agave (Agave tequilana) and is considered the emblematic alcoholic beverage of our country. Alcoholic drinks contain a complex mixture of substances from grapes, yeast, hops, barley, or wheat as well as and chemicals derived from natural foods (such as salicylates) and preservatives (such as sodium metabisulfite derivatives of wood), which all have the potential to trigger the reactions not through the immune system.
Clinical entities with a higher probability of immunologic response are OAS, urticaria, and anaphylaxis. By category, fruits and vegetables are the most common food involved in these clinical features; however, shrimp remains the most prevalent food implied in these reactions. It is now acknowledged that OAS can precede systemic manifestations to food, without limitation to fruits and vegetables. The predominance of plant-related food is consistent with that of another study recently published in Mexico,30 where fruits derived from Rosaceae family had this characteristic.
Urticaria-related foods vary and depend on the availability and consumption habits of the population. In Spain, urticaria represented over 30% of the symptoms associated with FH;23 in Colombia, the most frequent self-reported symptom was cutaneous one (61.4%).13 In our reports, shrimp and fish were the most common cause of urticaria, followed by peanut. Food-induced reactions account for 30 to 50% of cases of anaphylaxis in the United States, Europe, Asia, and Australia. Although a wide range of foods has been reported to cause anaphylaxis, most likely involved are peanuts, nuts, milk, egg, sesame seeds, fish, and seafood induced anaphylaxis, for both adults and children.31 In Japan, milk, egg, and wheat were most commonly reported for anaphylaxis,32 which is inconstant with our result showing that shrimp, fish, and peanut ranked the first places.
It is noteworthy that shrimp was the most important food implied in clinical manifestations of FH, such as OAS, urticaria, and anaphylaxis, suggesting the existence of a process of sensitization in the development of IgE-mediated diseases.
Previous epidemiological studies have reported the prevalence of anaphylaxis, ranging from 0.1% to 2.7%.13,21,22,33 We found a prevalence of 1.3% in food induced anaphylaxis (FIA), but the prevalence was difficult to quantify because our study only included cases in which the same subject responded and the diagnosis had previously been established by a physician. However, it is noteworthy that we also observed a similar prevalence of systemic symptoms (0.8%) that could well correspond even to anaphylactic reactions undiagnosed. Foods mainly related to FIA identified in our study were shrimp, fish, and peanut, which are consistent with those of recently reported studies.31
Risk factors associated with the development of food allergy have recently been reviewed by Lack,34 which include genetic predisposition, exposure time to food, changes in the composition of the diet, and hygiene hypothesis among others.
We identified a personal history of atopic disease and age as factors associated with FH. Some studies have documented the predominance of FH in females,12,13 while others have not, as in our study.35
One of the limitations of our study is patient selection conducted by systematic sampling. No random selection was performed because we did not have a well-defined population. However, one of the strengths of our study is the allocation of quota sampling strata where each stratum corresponded to one of the cities that constitute the metropolitan area of Guadalajara, which led us to have a population base. In addition, calculating the prevalence of FH in subjects who performed a recreational activity at the time of survey decreased the possibility of over-representation of the disease, as often happens, for example, during interviews of subjects from a hospital or any care unit. Finally, it is important to remember that our results represent subjects at the age of 20 to 50 years who wish to attend "Via Recreactiva" routes and that extrapolation of our results should be made with caution considering this population. Involvement of the immune system in the genesis of FH is beyond the scope of this study.
CONCLUSIONS
The prevalence of FH was identified in 16.7% of the mexican-population, which appears similar to those reported by previous studies in Latin American countries. To our knowledge, there is no published study on this issue. Therefore, the results of this study provide the basis for further studies on the tendency of FH in Mexico.
 XML Download