

 PDF
PDF ePub
ePub Citation
 Print
Print


INTRODUCTION
Minerals in human nutrition are basically required for electrolytes in extracellular and intracellular fluids. Particularly intracellular fluid, the site of major metabolic activities, needs more the maintenance of optimal amount and concentration of minerals [1]. As the life expectancy increase, some chronic diseases are epidemic all around world. Especially, cardiovascular disease, arthritis and diabetes mellitus type II are prevalent in young people as well as in elderly. In recent, these diseases are referred being related with mineral status in the body through immune system [2].
Even though the trace amount of minerals which exist under 100 mg in the body, they perform vital roles for metabolic functions. For example, microminerals such as zinc (Zn), copper (Cu) and iron (Fe) are important for enzyme cofactors, stabilizers of organic molecules or participants in redox reactions. Therefore either a deficit or excess of any of them should be harmful for health [3]. In addition, interaction between minerals may influence their bioavailability, although they are not serious in physiological level. These interactions could lead to nutrient imbalance and increase the need for balanced intake of minerals. For example, intake of Fe and calcium (Ca) represses the absorption of Zn, while Cu intake does not [4,5]. As a matter of fact, a good source of one mineral may be a poor source of another, e.g. meats are rich of Fe, but deficit of Ca [6]. Some studies suggested that Fe, Zn as well as ascorbic acid and carbohydrates influenced Cu bioavailability [7]. Moreover according to species manganese (Mn) could decrease Fe absorption in animals but not humans [8].
Generally Korean ordinary diets are referred to be good for human health in worldwide. However it is uncertain whether they provide microminerals enough for growth and health of teenagers. The aim of this research is to identify the contents of Fe, Zn, Cu and Mn of cuisines and relationship between these microminerals in school meals around Changwon area.
MATERIALS AND METHODS
Materials and pretreatment
The fifty cuisine samples among school meals were collected around Changwon. They were homogenized and stored at -80℃ until analysis. For the concentration of Fe, Zn, Cu and Mn, five grams of each sample were incinerated at 600℃ to obtain ash and were diluted to 25 ml with 5% (v/v) hydrochloric acid solution.
Analytical methods
The diluted sample were run by inductively coupled plasma optical emission spectrometry (ICP-OES) using Perkin-Elmer Optima 3,000DV (Waltham, USA) at the Center for Instrumental Analysis in Kyungnam University. Absorbance for Fe, Zn, Cu and Mn were read at 238.2 nm, 257.6 nm, 327.4 nm, 206.2 nm respectively. To verify analysis accuracy, the standard mineral preparations were run every consecutive experiment and replicated three times per sample. All chemicals used were the product of Junsei Chemical Co. Ltd. (Tokyo, Japan).
Statistics
Using SPSS Statistics 14.0K (IBM, Chicago, USA), descriptive statistics were carried for all variables. The data were expressed as mean and standard deviation, percentage (%) as well as range value from minimum to maximum. And linear regression analysis was performed to determine the relationship between microminerals.
RESULTS
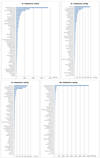
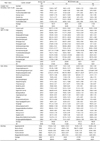
The amount of microminerals was expressed with unit as ug per one serving size of cuisine categorized into four groups as cooked-rice, soup, kimchi and side-dish (Table 1, Fig. 1).
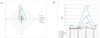
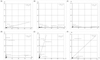
The quantitative contribution of minerals to school meal and %DRI of each microminerals were obtained (Fig. 2). Linear regression showing for relationship between microminerals in all cuisines was expressed in Fig. 3.
The amount of microminerals per serving size of cuisines.
The range of Fe contents per serving size of cuisines was 22.4-3373.2 µg. Among all cuisines Fe level of Pangibuseotpaprika-salad was the highest, while that of Yulmu-bab was the lowest. In average, Fe level was higher in side-dishes (346.6 µg) than other three cuisine groups. (Fig. 1) The range of Zn contents per serving size of cuisines was 8.6-1,312.3 µg. Among all cuisines, Sullung-tang had the highest Zn value, while Mugeungikimchi-muchim had the lowest. The average Zn level was higher in soup (229.1 µg) than in other groups. The range of Cu contents per serving size of cuisines was 2.3-966.3 µg. Among all cuisines, Buchu-kimchi showed the highest Cu level, while Yubumu-guk showed the lowest. In average, Cu level was higher in kimchi (217.5 µg) than other cuisine groups. The range of Mn contents per serving size of cuisines was 1.0-4,134.0 µg. Among all cuisines, Gumeunkongyangnyum-gui had the highest Mn value, while Yimyunsoo-gui showed the lowest. In average, Mn level was higher in side-dishes (198.4 µg) than other three cuisine groups.
Regarding to Ssal-bab in cooked rice group, there remained no ash after incineration and not detected any minerals.
The ratio of microminerals and % DRI of cuisines in school meals.
Regarding to micromineral contribution of cuisines to those of total diet in school meals, the results showed that each cuisine seems to provide one or two specific microminerals to cooked-rice (Fig. 2). Cooked rices containing relatively a small amounts of microminerals might be supplemented Cu from kimchi, Mn from side-dishes, Zn from soup and Fe from these all three cuisines. Comparing to Korean Dietary Recommended Intakes (KDRI) level of microminerals, school meals have provided insufficient amount (< 25% DRI) of Fe, Zn or Mn, but excessive amount (> 125% DRI) of Cu.
The relationship between microminerals in school meals
Using linear regression, two significant positive relationships were found between Fe versus Zn, and Fe versus Cu in all cuisines. Their coefficient of determinant (R2) was 24.2%, 28.6%, respectively. Interestingly these graphs show that the ratio of Cu to Fe is 3.13, and that of Zn to Fe is 0.25, and so the ratio of Cu : Fe : Zn are approximately 12: 4 : 1. Therefore it is suggested that through school meals the student may consume twelve folds cooper and four folds iron as if intake of zinc increases. The main sources of these minerals were Buchu-kimchi, Pangibuseotpaprika-salad or Nockchasamgyubsal-gui (Fig. 3).
DISCUSSION
During the past century researchers had focused on the effect of nutrition on the control of diseases induced from malnutrition involving the immune response and its modifying agents [9,10]. In recent several studies have reported that the some relationship between minerals, vitamins or phytochemicals and development of some chronic diseases such as cardiovascular disease and diabetes mellitus are intimately existed [11,12,13]. These two diseases are associated with obesity which is referred a stimulator to produce and secret pro-inflammatory cytokines TNF-a, IL-6, but to reduce anti-inflammatory cytokines like adiponectin.[14]. Inflammation is a kind of catabolic mechanism to keep body weight within acceptable range [6] or a kind of immune responses against obesity [15]. In immune system, relations between Fe, Zn, Cu and Mn are interconnected primarily through antioxidant function. In general these microminerals are important for enzyme cofactors, stabilizers of organic molecules or participants in redox reactions [16]. Fe is existed under 100 mg in the body, and one of the antioxidants which function to make metabolite being reduced states [17]. Zn is needed for enzymes as many two hundred or more to function in the body [18]. Those functions are related to DNA or RNA synthesis, cell growth and development, antioxidants defenses, immune function and acid-base balance for maintaining optimal health. And Cu is essential for energy metabolism, neurotransmitter regulation, collagen synthesis, and for antioxidant defense against free radicals. Deficiencies of Cu are associated with accelerated bone mineral loss and increased blood pressure and cholesterol levels. Higher doses of Cu may lead liver damage, coma and death. Mn is a cofactor for many enzymes with importance for carbohydrate metabolism, protein digestion and metabolism, biotin function, cartilage regeneration, and free radical defense. Mn deficiency causes decreased fertility, higher susceptibility to seizures, and bone fractures. The toxicities of ingested Mn result in tremor, delayed movement, and rigidity due to nervous damage [17].
Still there are some informational gaps about the role of micronutrients in human health and lacks of studies on biological endpoints that reflect sufficient or insufficient body stores of them. In addition there should be needed to identify and quantify the effects of interactions between micronutrients and interactions between micronutrients and other food components, the food matrix, food processing such as cooking [19,20,21,22].
In this study Fe and Zn contents in soups were almost double of those in kimchies and side-dishes, and that of cooked rice with grains was the lowest among all foods. The Mn content was also higher in kimchies and side-dishes than in cooked rice with grains as well as in soup. In side-dishes, Mn content was high, but Cu content was relatively low. However comparing to Korean Dietary Reference Intakes (KDRI) level of microminerals, average school meal as a lunch set provided insufficient supply (< 25% DRI) of Fe, Zn or Mn, but did excess (> 125% DRI) of Cu, especially from kimchies. All these results could be applicable as a fundamental data estimating optimal micromineral contents and their relative ratios in typical school meals for healthy adolescents.
In conclusion, the contents of Fe, Zn and Mn provided from school meals were not sufficient for teenagers in Gyeongnam area. In contrast Cu contents were excess when compared with KDRI for both 9-11 year-old and 12-14 year-old students. Moreover the results showed that students consumed twelve folds of Cu and four folds of Fe as their intake of Zn increase. Therefore in the field of school meal, substantial alterations to the menus should be considered to ensure the nutrient value of cuisines in the future. At the same time, it should be the right time to think over on determining the dietary reference intakes of microminerals as well as their relative ratios for Korean teenagers.
 XML Download