

 PDF
PDF ePub
ePub Citation
 Print
Print


Introduction
Obesity, particularly abdominal obesity, is strongly associated with insulin resistance and cardiovascular disease (CVD) risk factors such as waist circumference, hypertriglyceridemia, low high-density lipoprotein (HDL)-cholesterol, hyperglycemia, and hypertension [1,2].
Dietary restriction and lifestyle modification are the most effective methods for reducing body weight. Intervention studies have shown that a reduction in excess abdominal fat is associated with a reduced risk of CVD [3]. Ahn et al. [4] reported that diabetes mellitus (DM) patients who restrict calories have significant reductions in body weight as well as VAT, and greater improvements in insulin sensitivity.
Many studies use abdominal fat distribution to identify metabolic syndrome [5-6] and abdominal fat accumulation is influenced by many factors such as age, menopause, stress, smoking, alcohol intake, socioeconomic status, and genetic factors [7-9]. Visceral adipose tissue (VAT), a component of abdominal fat, seems to be more strongly associated with CVD risk factors than subcutaneous adipose tissue (SAT) [10-12].
There still remains controversy surrounding the question of whether VAT is a superior measure of obesity compared to SAT or other anthropometric measures [10,13-15]. Some investigators reported that these questions are best answered by measuring VAT at several sites [16,17]. Recently, several studies questioned whether a single image can predict total VAT and obesity-related health risks [18,19]. Historically, L4-L5 has been selected as a landmark to assess abdominal adiposity. Single images obtained at the L3-L4 or L4-L5 levels are able to predict abdominal obesity equally well [20]. Shen et al. [21] reported that measuring VAT at the traditional L4-L5 level might not be the best marker of obesity-related health risks in both men and women. Song et al. [22] suggested that VAT is more strongly associated with metabolic syndrome than SAT in the Korean population regardless of the measurement site, and an image located in the upper abdomen (L2-L3 or L3-L4) would be a better predictor. Several studies have suggested that L1-L2 or L2-L3 would be a more suitable predictor of metabolic risk than L4-L5 [23]. Kuk et al. [24] also reported that VAT measured at L1-L2 is more strongly associated with total VAT volume and CVD risk factors than VAT measured at L4-L5 in Caucasian men.
None of these studies clarified which location of VAT best assesses CVD risk factors after weight reduction through calorie restriction. Thus, this study evaluated the correlation between cross-sectional slice locations and CVD risk factors in obese Korean women who have lost weight via calorie restriction.
Subjects and Methods
Subjects
Thirty-three non-diabetic obese women participated in the study and all subjects successively completed 12 weeks of a calorie restriction program. Subjects were recruited via postings on a notice board in Kyung Hee Medical Center. They were examined at baseline (T0) and after caloric restriction (T1). Women were included if they were premenopausal, had a BMI > 25 kg/m2, had a stable weight (< 2 kg) for at least six months prior to the beginning of the study, did not smoke, and had not participated in any structured physical activities during the previous year. Women were excluded if they had an endocrine disease or other secondary causes of obesity, were pregnant or lactating, had evidence of severe hepatic or renal diseases, or used medication that affects body weight, such as estrogen, oral hypoglycemic agents, and beta-blockers. The protocol and consent forms for the study were approved by the ethics review board of the Kyung Hee Medical Center and each subject provided informed written consent before participation.
Anthropometric parameters measures
Anthropometric measurements were taken at baseline and at 12 weeks, with the subjects in light clothing and without shoes. Height and weight were recorded using an automatic height-weight scale, to the nearest 0.1 cm and 0.1 kg. Body mass index (BMI) was calculated by dividing weight (kg) by height squared (m2). Percent body fat and lean body mass were measured by bioimpedance analysis (Inbody 3.0, Biospace, and Seoul, Korea). Mid-upper arm, thigh, waist and hip circumference were measured by a flexible measuring tape. Waist circumference was measured between the costal inferior border and the iliac crest. Hip circumference was measured at the widest point of the hip. Waist-to-hip ratio (WHR) was calculated by dividing waist circumference by hip circumference. Skinfold thickness was measured with a skinfold caliper at the triceps and thigh.
Blood sampling and biochemical assessment
At baseline and at 12 weeks, blood pressure was measured on the left arm with an automated blood pressure monitor after the subjects were at rest for 10-15 min. Blood samples were taken after a 10-h overnight fast and were centrifuged to obtain plasma, which was stored at -70℃ until analyzed. Plasma glucose was measured by a glucose oxidase method and total cholesterol, high density lipoprotein cholesterol (HDL-C), triglyceride levels were measured via enzymatic procedures using an auto analyzer (Bayer, USA). Low density lipoprotein cholesterol (LDL-C) was calculated by the Friedewald equation [25]. Insulin was analyzed with a Coat-A-Count Insulin kit (DPC, Diagnostic products Cor.) and leptin was analyzed with a human leptin RIA kit (Linco Research, St Charles, MO, USA). The homeostasis model assessment (HOMA) was used to calculate insulin resistance (IR) as HOMA-IR = [fasting insulin (µIU/mL) × fasting blood glucose (mg/dL) / 18) / 22.5]
Measurement of abdominal fat distribution by computed tomography (CT)
A single-slice CT scan taken at the level of L2-L3, L3-L4 and L4-L5 was performed using a PQ6000 scanner (General Electric Medical Systems, Milwaukee, WI) to measure visceral and subcutaneous abdominal adipose tissue areas at baseline and at 12 weeks (Hounsfield units (HU): -190 to -30) (Ryan and Nicklas, 1999). The subcutaneous abdominal adipose tissue (SAT) area was calculated by subtracting the visceral abdominal adipose tissue (VAT) area from the total adipose tissue (TAT) area. The visceral-to-subcutaneous fat ratio (VSR) was calculated by dividing VAT by SAT.
Caloric restriction
Subjects were placed on a low calorie diet of 1,200 kcal/day. A trained dietician met with the subjects during the baseline visit, the 1st week, 2nd week, 4th week, 8th week and 12th week. Subjects were provided with dietary information including the components of a balanced diet, the importance of food choice, and instructions on low-fat cooking methods. All subjects were instructed to complete a three day dietary record (two weekdays and one weekend day) before the start of the study and at the end of the study. Dietary records kept during the study were used to reinforce dietary advice and strengthen compliance. Restriction of alcohol consumption either by reducing the frequency or amount of alcohol intake was strongly recommended to all subjects. A nutrient analysis was quantified using a computer aided nutritional analysis program (CAN pro, Korean Nutrition Society, and Seoul, Korea).
Statistical analysis
The results were presented as mean ± SD. Changes in anthropometric measurements, abdominal fat distribution and cardiovascular risk factors before and after the caloric restriction were analyzed by paired t-test. Changes in diet before and after calorie restriction were analyzed by a Student t-test. Correlations among anthropometric measures, abdominal fat distribution, BP and cardiovascular risk factors were analyzed by Pearson's correlation coefficients. The three sites (L2-L3, L3-L4 and L4-L5) were compared by an ANOVA model with a two-sided test level of 0.05 and post-hoc analyses were performed with Duncan's test. Statistical analyses were performed with SAS 9.0 for Windows (SAS institute Inc. Cary, NC). A P-value < 0.05 was considered statistically significant.
Results
Baseline characteristics and changes after caloric restriction
Thirty-three obese women enrolled in the study. Basal characteristics and changes in daily intake of nutrients are presented in Table 1. The mean age was 32.4 ± 8.5 yrs (range, 20 to 46 years). All study subjects had a BMI higher than 25 kg/m2 and the mean BMI of the subjects was 27.1 ± 2.3 kg/m2. Weight, BMI and systolic blood pressure decreased significantly after calorie restriction (P < 0.001, P < 0.05), whereas diastolic blood pressure did not change.
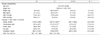
Changes in daily intake of nutrients after caloric restriction
Mean daily energy intake at baseline and after caloric restriction was 1,776.2 ± 338.6 and 1,451.5 ± 139.4 kcal, respectively. Intake of energy, carbohydrate, fat and cholesterol decreased significantly after caloric restriction (P < 0.001, P < 0.001, P < 0.05 and P < 0.01, respectively), whereas protein intake did not change. Daily energy intake decreased by 324.7 ± 438.9 kcal and daily carbohydrate intake decreased by 51.6 ± 47.9 g/d.
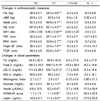
Changes in anthropometric measures after caloric restriction
Changes in anthropometric measures and blood parameters are presented in Table 2. Anthropometric measures (body fat mass, waist circumference, hip circumference, waist-to-hip ratio, TSF, MAC, Thigh SF and TICR) decreased significantly after the caloric restriction (P < 0.001), whereas lean body mass did not change. Body fat and waist circumference decreased by 2.3 ± 2.5 kg and 5.4 ± 3.3 cm, respectively.
Changes in blood parameters after caloric restriction
Plasma levels of total cholesterol and LDL-cholesterol decreased significantly after caloric restriction (P < 0.05), whereas levels of triglyceride, HDL-cholesterol and atherogenic index did not changed. Total cholesterol and LDL-cholesterol decreased by 12.6 ± 26.8 mg/dL and 7.7 ± 20.6 mg/dL, respectively. Plasma levels of glucose, insulin, HOMA-IR and leptin also decreased significantly after caloric restriction (P < 0.01). Glucose, insulin, HOMA-IR score and leptin decreased by 4.7 ± 8.8 mg/dL, 3.7 ± 10.6 µIU/mL, 0.5 ± 1.1, and 3.1 ± 5.3 ng/mL, respectively.
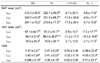
Changes in abdominal fat at the levels of L2-L3, L3-L4 and L4-L5 after caloric restriction
After caloric restriction, SAT and VAT decreased significantly at all sites with the exception of VAT at L4-L5 (Table 3). The percent change in VAT at L3-4 was significant compared to other abdominal measurement sites (10% vs. 3-7%).
VSR at L2-L3, L3-L4, and L4-L5 was 0.47 ± 0.21, 0.43 ± 0.24 and 0.30 ± 0.14, respectively. VSR did not change after caloric restriction.
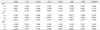
Correlation between changes in abdominal fat and CVD risk factors after caloric restriction
Changes in SAT, regardless of the measurement site, were not correlated with changes in CVD risk factors (Table 4). However, changes in VAT measures at L2-L3, L3-L4 and L4-L5 were positively correlated with the changes in SBP. In addition, VAT at L3-L4 was positively correlated with changes in total-cholesterol, LDL-cholesterol and HOMA-IR. The correlation between changes in CVD risk factors and VAT at L3-L4 was stronger than the correlation between changes in CVD risk factors and VAT at L2-L3 and L4-L5. The correlation between changes in VSR and CVD risk factors was similar to that of VAT and CVD risk factors.
Discussion
This study examined the relationship between anthropometric measures, abdominal fat distribution at the levels of L2-L3, L3-L4 and L4-L5, and CVD risk factors. The results show that food intake, anthropometric measures, SBP, % fat, total-C, LDL-C, HOMA-IR, leptin, SAT and VAT decreased significantly after calorie restriction. In addition, after calorie restriction, changes in VAT at L3-L4 were more strongly correlated with CVD risk factors than changes in VAT at L2-L3 and L4-L5. However, changes in SAT, regardless of the measurement site, were not correlated with changes in CVD risk factors.
Weinsier et al. [26] and Kelley et al. [27] suggested that a low energy diet may rapidly reduce CVD risk factors. Furthermore, Wing et al. [28] reported that reducing energy intake by 400 kcal/day improved fasting glucose levels and insulin sensitivity. In this study, the subjects reduced their calorie intake primarily by reducing carbohydrate and fat intake. This caloric restriction was part of a program that included teaching subjects how to eat a balanced diet, make healthy food choices, and use low fat cooking methods. During the study subjects tended to maintain their lean body mass, perhaps due to the consistent intake of protein and a generally well-balanced diet during the period of caloric restriction.
In this study, a reduction in visceral fat was correlated with improvements in insulin resistance and systolic blood pressure. This suggests that a well-balanced, low calorie diet may reduce abdominal obesity, which in turn might improve selected CVD risk factors.
Paré et al. [20] showed that the decrease in cross-sectional areas of VAT was higher than a decrease in the SAT area after weight loss. Furthermore, the decrease in VAT at L4-L5 was higher than at L2-L3 (19% vs. 15%). Conversely, Ross and Rissanen [29] reported that the relative loss in the VAT area 15 cm above L4-L5 via diet- and exercise-induced weight reduction was significantly larger than the loss in the VAT area in other abdominal slice areas. In this study, after a 350 kcal/day caloric restriction, SAT decreased by 4-6% and VAT decreased by 4-10% compared to their initial values at L2-L3, L3-L4 and L4-L5. However VSR did not change. The percent change in VAT at L3-L4 was greater than other abdominal sites (10% vs. 3-7%), illustrating that VAT at L3-L4 is strongly influenced by caloric restriction compared to VAT at L2-L3 or L4-L5.
Previous studies have demonstrated that VAT might be more strongly associated with CVD risk factors compared to SAT [23,24]. On the other hand, several investigators have reported that SAT contributes to the development of metabolic syndrome (MS) although the correlation of SAT with MS is inconsistent and varies according to the measurement site [3]. Several studies found that the L4-L5 location is the most frequently used single-slice site to assess abdominal adiposity [19-21] whereas other studies reported that the L2-L3 site might be more appropriate [30,31]. Kuk et al. [24] reported that VAT was more strongly associated with MS than SAT, independent of the measurement site.
In previous studies, changes in VAT and SAT regardless of the measurement site were generally not related to corresponding changes in a number of MS risk factors [5]. In this study, however, changes in VAT at L3-L4 were significantly associated with changes in TC, LDL-C, SBP and HOMA-IR. Changes in VAT at L3-L4 were more strongly correlated with CVD risk factors than those at L2-L3 and L4-L5. VAT based on a single-slice CT scan was somewhat site-specific, and the level of VAT at L3-L4 was more strongly associated with CVD risk factors than L2-L3 and L4-L5 in obese Korean women. These results suggest that an image located in the upper abdominal region L3-L4 rather than the L4-L5 level would be a better predictor of the relationship between VAT and CVD risk factors.
This study has several limitations. First, the sample size was small, which may lessen the significance of the results. The authors attempted to enroll more participants, but this was difficult due to the expensive cost of CT scans. Second, the physical activity levels of the participants were not noted. Therefore, it was not possible to distinguish the additive effects of caloric restriction and increased levels of exercise on the results. Third, the subjects were premenopausal women. Several cross-sectional studies in Western populations have reported that postmenopausal women accumulate more VAT than premenopausal women [6,32] and that VAT increases with age. The results of this study only apply to premenopausal Asian obese women. These limitations should be addressed in future research.
This study found that changes in VAT at the L3-L4 site had a stronger correlation with CVD risk factors than with other AT measurement sites after caloric restriction in obese Korean women.
 XML Download