

 PDF
PDF ePub
ePub Citation
 Print
Print


Introduction
Over the next 30 years, the elderly population (65 years and older) in the United States is expected to double [1]. By the year 2040, 20% of Americans will be 65 years of age and older as compared to 12.97% in 2010. From 2010 to 2050, the total population is expected to increase by 142%; the age group of 65 years old and over is expected to increase by 220%, the age group of 85 years old and over is expected to increase by 331%, and the age group of 100 years old and over is expected to increase by 761%. Although there has been an increase in life expectancy, the later years may not be lived in good health. The burden associated with providing health care to an aging population is likely to increase, with nutrition being one of the most important factors for maintaining quality of life [2].
To maintain health, independence, and well-being, the elderly require adequate nutritional intake. However, many studies indicate that seniors' diets are low in calories and other nutrients [3]. Within the community, efforts have been made to develop nutrition programs targeting older people of high nutritional risk [4]. Meals-On-Wheels (MOW) services are part of this effort. Home delivered meals program, such as those provided by MOW, can make a significant contribution to the nutrient intakes of the homebound [5]. Despite the sincere intentions of organizations, administrators of charitable programs often over-focus on the nutritional content of meals with little concern for recipients' food preferences, satisfaction, or more importantly, avoidances. Therefore, this study was conducted to evaluate recipients' perceptions of food quality, volunteer service and responsiveness, and their satisfaction of home delivered meals program.
Malnutrition among the elderly may be related to illness, cognitive impairment, medication usage, functional decline, and mental illness [6-8]. Previous research showed that 74% to 98% of elderly recipients of MOW were at nutrition risk. Furthermore, many elderly people have physical problems that make it difficult for them to consume certain foods. Coulston et al. [9] used the Nutrition Screening Initiative (NSI) screening tool and reported that 83% of MOW participants were at high risk for poor nutritional status compared to the 74% considered at risk by the nutritional assessment criteria of their study.
Even though the rate of participants at high nutritional risk in this study was lower than those originally assessed from MOW programs, the result still indicated that the number of participants at high nutritional risk is high. While certain groups of seniors are at greater-risk of hunger, hunger cuts across the income spectrum [6]. For example, over 50% of all seniors who are at-risk for hunger have incomes above the poverty line; likewise, it is present in all demographic groups. Seniors living in non-metropolitan areas are as likely to experience food insecurity as those living in metropolitan areas, suggesting that food insecurity cuts across the urban-rural continuum [4].
Since adequate nutrition is essential for maintaining health, decreasing existing health problems, and maintaining functional independence, improving nutritional status and maintaining functional independence are seriously important to prolong good health status and well-being [9]. Weatherspoon et al. found that enjoyable meal times and appropriate nutrition intake allow the elderly to improve their health and quality of life; therefore, health status and quality of life might be influenced by recipients' satisfaction with the meals and services provided from health-care facilities [2].
Service quality assessment has received considerable attention in hospitality research [10-13]. Service quality is defined in the marketing literature as a customer's post-consumption evaluation of service that compares expectations with perceptions of performance. The evaluation of service quality is based on the manner in which the service was delivered and the outcomes that resulted from that service [14]. Although service quality is similar to customer satisfaction, the two are different. Service quality addresses issues of quality only, while satisfaction may include non-quality components (e.g. price). Satisfaction is an overall measure of how happy or content customers are in general with a product or service offered [15].
The majority of service quality researchers have adopted the SERVQUAL model [12,14,16,17]. This model utilizes a 44-item measurement that compares differences between customers' expectations of service and their assessment of actual performance. Respondents' expectations of excellent service are evaluated first in this instrument by 22 questions (before consumption), followed by another 22 matching questions rating perceived performance of the service provided (after consumption). Five dimensions of service quality have been specified in SERVQUAL: reliability, responsiveness, empathy, assurance, and tangibles. Despite the popularity of the SERVQUAL model, it has generated numerous criticisms. For example, there are disagreements concerning the proposed linkage between quality and satisfaction.
Stevens et al. [18] proposed an instrument called DINESERV to assess customers' perceptions of a restaurant's service quality. DINESERV was adapted and refined from SERVQUAL containing 29 statements on a seven-point response scale. They selected a random sample of people from telephone directories of a midsize city in the North Central US and used DINESERV to conduct telephone interviews with adults who had eaten out six or more times during the previous 6 months in three restaurant segments: quick service, casual/theme, and fine dining. DINESERV consists of five dimensions: assurance, empathy, reliability, responsiveness, and tangibles. In order to evaluate customer perceptions of foodservice quality, Kim et al. [19] conducted a study to evaluate the reliability and validity of a modified DINESERV instrument to fit the needs of specific establishments: a casual Italian restaurant in the US and an American-style casual restaurant in Taiwan. Another study was conducted to validate five dimensions of the DINESERV instrument in Korean casual dining restaurants and explored any possible differences in the perceived service quality of those restaurants [20].
One could easily assume that recipients would be satisfied with the meals and services of MOW or other congregate meal programs because almost all meals from these programs are free, and most staff of these programs are volunteers. Therefore, such programs may not be interested in satisfaction research. However, some research has indicated that many recipients explicitly expressed their dissatisfaction; for example, in a study by Lirette, some recipients felt that the vegetables were too firm (19%) and the meat was too tough (24%) [21]. They also indicated their dissatisfaction about texture, vegetables, salads, and ethnic choices. In Roy and Payette's study, nineteen subjects (95%) usually or never consumed their entire meal, and eight (40%) subjects reported they threw away parts of their meal [22]. These responses are related to their satisfaction with meals provided from MOW. This study indicated that fifteen (75%) were satisfied with meal quality, time of delivery, variety, choice, and temperatures of foods.
These results imply that MOW recipients may not eat sufficient amounts of food to meet their nutritional needs. Moreover, research has suggested that recipients' preferences and acceptance should be strictly monitored and evaluated to ensure that meals are going to be eaten [23]. Therefore, MOW agencies must understand recipients' perceptions about food quality, volunteer service, and level of satisfaction. In the current study, Midwest MOW recipients' perceptions and meal satisfaction were investigated.
Consequently, this study was designed to evaluate recipients' satisfaction with meals and services from the MOW program in Lubbock, Texas. The specific objectives of this research were to:
Subjects and Methods
Questionnaire
Based on a literature search of previously conducted satisfaction surveys [21,24], a satisfaction questionnaire was developed. This instrument was adopted and modified in order to investigate the recipients' satisfaction. The initial questionnaire contained 24 items, using a 5-point Likert scale ranging from 1 (strongly disagree) to 5 (strongly agree). After the pilot test, some statements were rephrased and modified. The final version of the questionnaire included 21 questions.
The final questionnaire had 21 items and used the 5-point Likert scale. In order to examine factors affecting the recipients' satisfaction, the recipients were asked about their experiences with meals and services they had received during this study. There were four design considerations addressed in this questionnaire. The first consideration was a large font size. A 14 point font was selected to assure ease of reading for older participants. The second consideration was paper color. The survey paper was yellow or blue instead of white because it would be easier for recipients and volunteers to distinguish them among other papers. The questionnaire language was simply written because federal regulations advise a 7th grade reading level for written consent for ordinary adults. The last consideration was language. Questionnaires were prepared in two versions, English and Spanish, because almost half of the recipients spoke and read only Spanish. A native Spanish speaker translated the English questionnaire to Spanish. Another native Spanish speaker then translated the questionnaire back into English in order to confirm the accuracy of the Spanish questionnaire. Original and back translated documents were then compared, and it was confirmed that the Spanish questionnaire was suitable for use in the study.
Pilot test
The questionnaire was pilot tested by 40 recipients on two delivery routes. Forty questionnaires were distributed, and 20 questionnaires were collected in March 2008. Originally, the questionnaire used for the pilot test had 20 items and two variables. After data analysis, the questionnaire was modified to 21 items and three variables. Unnecessary items were removed and some necessary items were added. For efficiency, extra distributors and collectors were not employed. Volunteers delivering lunches for MOW were asked to distribute the questionnaires when they delivered meals, and they were also asked to collect the questionnaires either the next day or the next time they completed their routes. The 1-page (two sided) questionnaire was printed on 8.5"×11" paper and folded in half. Two different colors were used to differentiate the languages: yellow for English and blue for Spanish. No code numbers were used on individual questionnaires to ensure the anonymity of responses. To encourage participation, the researcher made a $1 donation to MOW for every completed survey.
Statistical analysis
The data was compiled and statistically analyzed using the statistical analysis program SPSS (Statistical Package for Social Sciences) release 15.0 for Windows (SPSS Inc., Chicago, IL). Descriptive statistics described the respondents' socio-demographics in frequencies and percentages. The data were analyzed following Anderson and Gerbing's [25] two-step approach: a measurement model and a subsequent structural model. The multiple-item scales of four constructs were subjected to a Confirmatory Factor Analysis (CFA) to determine whether the manifest variables reflected the hypothesized latent variables. The reliability levels (coefficient alpha values) for each construct were above the cutoff of 0.70 proposed by Nunnally [26]. After reliability coefficients of the four dimensions reached the required level, the coefficient alpha for total items was calculated within the construct. The adequacy of the items was assessed by composite reliability, convergent validity, and discriminant validity. Once the measures were validated, Structural Equation Modeling (SEM) was used to test the validity of the proposed model.
SEM describes relationships between variables. This study used several fit indexes: Chi-square to df ratio (χ2/df), which is the chi-square fit index divided by degrees of freedom. The comparative fit index, CFI, compares the existing model fit with a null model that assumes the indicator variables (and hence also the latent variables) in the model are uncorrelated (the "independence model"). The normed fit index (NFI), also known as the Bentler-Bonett normed fit index, or simply Delta1. NFI was developed as an alternative to CFI, but one which did not require making chi-square assumptions. The incremental fit index, IFI, is relatively independent of sample size and is favored by some researchers for that reason. Root mean square error of approximation, RMSEA, is also called RMS or RMSE or discrepancy per degree of freedom. RMSEA is a popular measure of fit, partly because it does not require comparison with a null model and thus does not require the author to posit as plausible a model in which there is complete independence of the latent variables, as does for instance, CFI. The Tucker-Lewis index, TLI, is similar to NFI, but penalizes for model complexity.
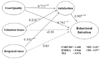
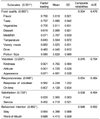
SEM analysis is similar to combining multiple regression and factor analysis. SEM also offers some important, additional benefits over these techniques, including an effective way to deal with multicollinearity, and methods for taking into account the unreliability of consumer response data. There were five latent variables in this model: Food quality, volunteer issues, responsiveness, satisfaction, and behavioral intention. Each latent variable included more than 2 measured variables (Table 2).
Results
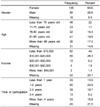
The socio-demographic characteristics of respondents in this study are exhibited in Table 1. Out of 398 questionnaires, 265 (66.6%) were collected, and 209 questionnaires (52.5%) were used for the statistical analysis. Females constituted 64.6% of the respondents. The average age of respondents was 75.7 years old, and the largest group (22.0%) out of five age groups was less than 70 years old. More than half (52.1%) of the respondents were older than the average age, above 76 years old. The income level was very low; the largest portion of the group (44.0%) made less than $10,000 per year. Except for the respondents who did not answer this question, more than 90% were making less than $20,000 per year. Most of them had retired long ago, so they were largely relying on a government subsidy or pension. Households had been receiving meals from MOW for different lengths of time. About one fifth (21.5%) of the respondents did not answer this question, possibly because they did not remember how long they had been served meals from this organization. The average length of time respondents had been receiving meals was 2.84 years; the largest group (23.9%) had been receiving meals between 1 and 2 years.
The following average scores of perceptions toward meals and services were calculated: flavor (3.62), taste (3.69), vegetables (3.81), meat/fish (3.71), temperature (3.55), dessert (4.00), drinks (4.04), portion size (3.63), variety (3.82), appearance (4.68), kindness (4.75), attitude (4.72), meal schedule (4.13), and response (4.23). The results show that items for meals were rated slightly lower than those for service. Specifically, temperature, flavor, and portion size were quite low compared to others. Therefore, if MOW organizations address the quality of these items, recipients will be more satisfied with this program.
The level of internal consistency in each construct was acceptable, with Cronbach's alpha estimates ranging from 0.698 to 0.939 [26]. All of the composite reliabilities of the constructs were over the cutoff value of 0.50, ensuring adequate internal consistency of multiple items for each construct [27] (Table 2). Convergent validity was satisfied in that all confirmatory factor loadings exceeded 0.452. In addition, the Average Variance Extracted (AVE) of all constructs exceeded the minimum criterion of 0.454, indicating that a large portion of the variance was explained by the constructs. The AVEs were greater than the squared correlations between any pair of constructs, suggesting discriminant validity. The five-factors confirmatory measurement model demonstrated the soundness of its measurement properties. The ratio of χ2 to degrees of freedom was 2.433 (P < 0.001). Given the known sensitivity of the χ2 statistics test to sample size, several widely used goodness-of-fit indices demonstrated that the confirmatory factor model fit the data well (NFI = 0.873, CFI = 0.986, IFI = 0.921, RMSEA = 0.083).
As a second step, the MOW recipients' perception model was estimated (Fig. 1). The estimation produced the following statistics: χ2 (119) = 167.508 (P < 0.005), χ2/df = 1.408, NFI = 0.927, CFI = 0.977, IFI = 0.978, RMSEA = 0.044. The model's fit as indicated by these indexes was satisfactory and path coefficients were analyzed. Two paths between (1) volunteer issues and behavioral intention and (2) responsiveness and behavioral intention were not significant. The path for predicting a positive relationship between food quality and satisfaction was supported (γ11 = 0.733, t = 2.68, P < 0.01). The results show that having high food quality may create recipient satisfaction. Also, food quality significantly influenced positive behavioral intention (γ21 = 0.762, t = 12.38, P < 0.001). While volunteer issues such as appearance, kindness, and attitude had less influence on satisfaction (γ12 = 0.238, t = 5.68, P < 0.001) than food quality and responsiveness (γ31 = 0.331, t = 6.38, P < 0.001). The findings suggest that food quality and responsiveness are significant predictors of positive satisfaction. Moreover, satisfied recipients have positive behavioral intention for MOW programs (β12 = 0.907, t = 18.38, P < 0.001). One reason for there being no significant association between volunteer issues/responsiveness and behavioral intentions could be related to recipients' experiences. The average length of time respondents had been receiving meals was from 2.84 years and they were already satisfied and not concerned about retention of the service or word-of-mouth aspects.
Furthermore, this study examined the mediating role of satisfaction. The structural equation model was re-estimated by constraining the direct effect of satisfaction on behavioral intentions (β12 = 0). Baron and Kenny's (1986) first three conditions were met in the original structural model (γ11, β12, and γ12 were significant). The fourth condition was also satisfied; the parameter estimate between satisfaction and behavioral intentions program (β12 = 0.907, t = 18.38) in the mediating model became less significant (partial mediation) than the parameter estimate (γ to bi = 0.31, t = 2.093) in the constrained model. The difference in χ2 value between the constrained model (χ2 (120) = 171.6) and the mediating model (χ2 (119) = 167.508) was statistically significant (χ2 d(1) = 4.092, P < 0.05), indicating that the mediating model was a significant improvement over the constrained model. Thus, the mediating effects of satisfaction clearly demonstrate that excellent food attributes produce favorable future behavior outcomes through satisfaction.
Discussion
This study aimed to evaluate recipients' satisfaction with meals and services from the MOW program in the USA. Thus, we evaluated recipients' satisfaction with meals and services from MOW. We then investigated the factors affecting the recipients' satisfaction. This research indicated significant results.
First, this study created a comprehensive MOW recipients' perception model. This allowed for better understanding of recipient's satisfaction and behavioral intentions in the MOW program. Second, this study examined the way in which satisfaction mediates between perceived food quality and consumer behavioral intentions. The mediating effects demonstrate how consumer perceptions of food quality can affect behavioral intentions via the creation of satisfaction. The results also empirically support that satisfaction has a stronger positive indirect effect than the direct effect from other attributes on behavioral intentions. Third, the results show that not all the proposed relationships were supported along with the effects of volunteer and responsiveness stimuli in association with satisfaction and behavioral intentions. This empirical evidence could establish the important links among food quality, volunteer issues and responsiveness, satisfaction, and behavioral intentions
However, this study has limitations in terms of survey procedures, reliability, and generalization issues. MOW and other congregate meal programs are different from commercial restaurants in terms of money. Therefore, the reliability of the response cannot be 100% certain because MOW recipients may fear exclusion from the service if they respond with dissatisfaction. Furthermore, this study has obvious limitations in terms of items in the questionnaire. When the questionnaire was developed, the director of MOW restricted some items such as ethnicity and illness records of recipients. If these data were collected, more detailed and various results could be analyzed. Moreover, this study did not deal in depth with nutritional issues. According to previous research, the nutritional issues of meals provided from MOW were primary topics. Therefore, for future studies, greater development of the items and concern about nutritional issues is needed. This research considered only one MOW program. If this study had been conducted in different segments of the MOW program, the results may have shown different relationships among the studied constructs.
 XML Download