

 PDF
PDF ePub
ePub Citation
 Print
Print


Introduction
Vitamin D status is measured by circulating levels of 25-hydroxyvitamin D (25(OH)D), and which is the combined product of cutaneous synthesis from solar exposure and dietary sources. A high prevalence of vitamin D deficiency and insufficiency was reported in different populations across the world [1-4]. Vitamin D plays an important role in bone mineralization and facilitates the intestinal absorption of calcium and phosphorus by both genomic and nongenomic mechanisms [5]. Furthermore, vitamin D plays a role in cancer prevention [6], immune regulation [7], and glucose homeostasis [8]. Low serum 25(OH)D levels have been linked to some chronic diseases, including cancer [9,10], cardiovascular diseases [11,12], multiple sclerosis [13], diabetes mellitus, [14,15], and hypertension [16].
Insulin resistance has been considered a possible mechanism underlying the metabolic syndrome [17]. Previous research suggests that low vitamin D levels are associated with insulin resistance [18], β-cell dysfunction, and impaired insulin secretion and action [18,19]. Vitamin D was found to play a role in the regulation of lipolysis [20]. This might therefore contribute to the development of the metabolic syndrome. Recently, several cross-sectional studies [16,21-34] explored the association between 25(OH)D and metabolic syndrome (MeS). While some of these studies [21-30] showed an inverse association between 25(OH)D level and MeS, other studies [31-34] did not support this association. Although there is an agreement amongst the majority of study results on the presence of a association between 25(OH)D and MeS, the evidence remains uncertain and incongruent. Studies have differed substantially in terms of methodology, populations studied, study design, as well as reporting, measuring, and analysis of 25(OH)D. Some of these studies did not adjust for important variables with putative associations to MeS such as parathyroid hormone (PTH) and calcium and magnesium, which are of great importance because elevated levels of PTH and hypomagnesemia were reported to be associated with MeS [24,35]. Furthermore, some studies were limited by restricted age variability and a lack of representation of the general population.
Since both MeS and vitamin D deficiency are highly prevalent worldwide, establishing an association between them may potentially have wide public health implications. The objective of this study was to determine the association between 25(OH)D and MeS among a nationally representative sample of Jordanian adults.
Subjects and Methods
Sampling
A national population-based household sample was selected from the 12 governorates of Jordan. These 12 governorates belong to the three regions of the country, namely, the north, middle, and south. A complex multistage sampling technique was used to select the households, taking into consideration the geographic distribution of the population as well as the urbanrural residence. Since the population is covered by an extensive network of health centers and because the study procedures had to take place in a medical setting, the selection households were health center-oriented. The health director in each governorate was contacted and asked to identify at least two health centers in which to conduct the study procedures. He was asked to select the health centers so that urban and rural areas in each governorate were represented and the selected centers had enough space to host the study team, participants, and equipment. A total of 31 health centers were identified and people served by these centers were targeted. A systematic sample of households was selected from the population served by the selected health centers. The number of selected households was approximately proportional to the population in each region.
In each selected area, one day before data collection, 2-membered teams (a male and a female each) visited the selected households, explained the purpose of the study, and invited all members aged ≥ 7 years to attend the health center in the next day after an overnight fast. Subjects on regular medications were asked to not take their medications early in that day, and to bring all their medications with them to the survey site. To encourage participation, the study team worked every day of the week including official holidays with the exception of Fridays during the entire study period. Of the 9,000 subjects invited to participate, 5,640 subjects (1,607 males and 4,033 females) aged between 7 and 90 years responded. The overall response rate was 63% (36% for males and 90% for females). The main reason for no response was lack of time due to being at work.
The present report deals exclusively with adults aged > 18 years who had complete information on all individual components of MeS (n = 3,234).
Data collection
All field work was carried out between July 1st and November 30, 2009. Because of Ramadan (the fasting month for Muslims) and the following holidays, field work stopped for about 6 weeks during the period of August 20 to September 30, 2009. Thus, data collection was carried out during summer and autumn. Participants attended the health centers in the morning (8-11 am) with a minimum fasting time of 10 hours.
A pilot-tested structured questionnaire was prepared and administered by trained interviewers to collect relevant information that was necessary to answer the current research question and other selected research questions that will be addressed in separate publications. The questionnaire sought information on demographics, medical history, and factors potentially influencing serum 25(OH)D concentrations including highest level of education obtained, average monthly family income, amount of exercise per week, and smoking habits.
Two questions related to physical activity were modified from the Leisure Time Exercise Questionnaire to assess the physical activity of participants [36]. The two questions individually assessed moderate and vigorous activity by asking, "In the past week, how many hours did you spend doing moderate activity" and "In the past week, how many hours did you spend doing vigorous activity". More than 10 examples of common specific activities were given after each question.
Anthropometric and clinical measurements
Anthropometric measurements including weight, height, and hip and waist circumferences, were measured with the subjects wearing light clothing and no shoes [37]. Waist circumference was measured to the nearest centimeter using a non-stretchable tailor measuring tape at the midpoint between the bottom of the rib cage and above the top of the iliac crest during minimal respiration. Hip circumference was measured at the widest part of the body below the waist. Body mass index (BMI) was calculated as the ratio of weight in kilograms to the square of height in meters. Readings of systolic (SBP) and diastolic blood pressure (DBP) were taken with a subject seated and the arm at heart level, after at least 5 minutes of rest, using a standardized mercury sphygmomanometer.
Laboratory analysis
For laboratory analysis and all biochemical measurements, two sets of fasting blood samples were drawn from a cannula inserted into the antecubital vein, into sodium fluoride potassium oxalate tubes for glucose and lithium heparin vacuum tubes for lipids. The samples were centrifuged at 3,000 rpm for 10 min within 1 hour at the survey site, and the plasma was transferred to separate labeled tubes and placed immediately in cold boxes filled with ice and taken to the central laboratory of the National Center for Diabetes and Endocrinology. All biochemical measurements were carried out by the same team of laboratory technicians and by using the same method throughout the study period.
Serum 25(OH)D concentrations were determined by radioimmunoassay (BIOSOURCE Europe S.A., Nivelles, Belgium) [38]. The intra- and inter-assay coefficients of variation (CVs) values were 5.6% and 11%, respectively. The limit of detection was 0.6 ng/ml. Serum intact PTH level was measured with a electrochemiluminscence (ECLIA-PTH) assay (Roche Diagnostics, Manheim, Germany) [39]. The detection limit of the assay was 1.2 pg/mL, and the intra- and inter- assay coefficients of variation were below 5%. Creatinine, lipid parameters (total cholesterol, HDL, LDL, and triglycerides (TG)), and glucose were analyzed for all samples using enzymatic assays. Calcium was determined using the Scharzenbach method with o-cresolphthalein complexon. Magnesium was determined by a colorimetric method using chlorophosphonaxo III and phosphorous was determined by direct reduction of phosphomolybdate on a Cobas-800 analyzer (reagents supplied by Roche Diagnostics, Germany). The assays were conducted according to the manufacturers' instructions. Other laboratory analyses were also performed for several blood constituents, but these are not described here because they are irrelevant to the current report.
Definition of variables
The subjects were classified as vitamin D-deficient on the basis of 25(OH)D concentrations of < 30 ng/mL (75 nmol per liter). MeS was defined according to the International Diabetes Federation (IDF) definition [40]. According to the IDF definition, a person was defined as having MeS if he or she had central obesity (defined as waist circumference ≥ 94 cm for men and ≥ 80 cm for women, with ethnicity specific values for other groups) plus any two of the following four factors: 1) Raised TG level: ≥ 150 mg/dL (1.7 mmol/L), or specific treatment for this lipid abnormality, 2) Reduced HDL cholesterol: < 40 mg/dL (1.03 mmol/L) in males and < 50 mg/dL (1.29 mmol/L) in females, or specific treatment for this lipid abnormality, 3) Raised blood pressure: systolic BP ≥ 130 or diastolic BP ≥ 85 mm Hg, or treatment of previously diagnosed hypertension, 4) Raised fasting plasma glucose (FPG) ≥ 100 mg/dL (5.6 mmol/L), or previously diagnosed type 2 diabetes.
Data management and statistical analysis
The data were entered into a computer using the Statistical Package for Social Sciences software, SPSS (SPSS Inc., Chicago, IL, USA) version 15. Participant characteristics were compared according to MeS status using χ2 tests for categorical variables. One-way analysis of variance (ANOVA) was used to compare the means of anthropometric and clinical characteristics across quartiles of 25(OH)D levels for men and women. Age-standardized rates of MeS were calculated using the world population as a standard population.
Multivariable logistic regression models were fit to examine the associations of 25(OH)D with MeS and its components. In the multivariate analyses, MeS and its individual components were treated as dependent variables (in a separate analysis) and serum 25(OH)D was treated as the independent variable. Serum 25(OH)D was analyzed in three different forms: dichotomous (a cut-off value of 30 ng/mL), categorical using quartiles of 25(OH)D levels, and continuous. A P-value of less than 0.05 was considered statistically significant.
Results
Participants' characteristics
This study included a total of 3,234 adult individuals (776 men and 2458 women) who had complete data on all components of the MeS. Their age ranged between 19 and 90 years with a mean (SD) of 41.8 (13.3) years. The socio-demographic, anthropometric, clinical, and relevant characteristics of participants are shown in Table 1. Of the total, 42.0% (41.2% for men and 42.3% for women) had MeS and 31.7% (6.3% for men and 39.7% for women) had 25(OH)D < 30 ng/ml. About 1.8% and 5.2% of the participants reported current use of vitamin D and calcium supplements, respectively, with no significant difference between those with and without metabolic syndrome.
Anthropometric and clinical parameters according to quartiles of 25(OH)D levels
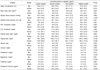
Table 2 shows the differences in the anthropometric and clinical parameters across quartiles of 25(OH)D level for men and women. Among the men, there were significant differences in the averages for triglycerides, phosphorus, magnesium, and PTH levels across quartiles of 25(OH)D. The average for triglycerides was highest in the highest quartile of 25(OH)D level and the average for PTH was highest in the lowest quartile of 25(OH)D. Among the women, there were significant differences in the averages of all studied anthropometric and clinical parameters across quartiles of 25(OH)D except in the average of HDL. The averages for LDL, fasting blood sugar, and triglycerides were highest in the upper two quartiles. The average PTH was highest in the lowest quartile. The differences in other parameters were small and were likely to be of marginal clinical significance.
25(OH)D and MeS
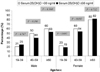
The age-standardized rate of MeS was 34.5.0% (95% confidence interval (CI): 31.0%-38.0%) for males and 40.5% (95% CI: 38.5%-42.5%) for females. Bivariate analysis showed that subjects with low 25(OH)D levels had lower prevalence of MeS than subjects with normal 25(OH)D levels (38.2% vs. 43.8%, P-value = 0.003). However, in stratified analysis, the prevalence of MeS did not differ significantly between subjects with low and normal 25(OH)D levels for men and women in all age groups (Fig. 1).
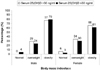
The lack of a significant difference in the prevalence of MeS between subjects with low and normal 25(OH)D was consistent among normal weight, overweight, and obese adults when the subjects were stratified according to BMI/gender (Fig. 2) or when stratified according to BMI/age group. Furthermore, there were no significant differences in the age standardized rates of MeS between subjects with low and normal 25(OH)D levels (standardized rate ratio was 0.87 (95% CI: 0.45-1.40) for males and 0.91 (95% CI: 0.83-1.002) for females).
Multivariate analysis
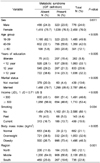
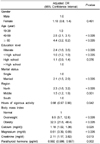
In the multivariate analysis, the only variables that were significantly associated with MeS were age, educational level, marital status, region, body mass index, and serum levels of calcium, magnesium, creatinine, and PTH (Table 3).
After adjusting for all significant variables in the model shown in Table 3, the odds of MeS were not significantly different between subjects with low and normal 25(OH)D levels (OR = 0.85, 95% CI: 0.70, 1.05, P-value = 0.133) (Table 4). The association between 25(OH)D and MeS remained non-significant when 25(OH)D was analyzed as a continuous variable (OR = 1.004, 95% CI; 1.000, 1.008, P-value = 0.057). There was no evidence of a sex interaction with 25(OH)D in all types of analysis. To explore a potential non-linear relationship between MeS and 25(OH)D, quartiles of 25(OH)D were implemented in an additional analysis that confirmed the absence of the association.
Considering the association between 25(OH)D and the individual components of MeS, none of the individual components of MeS were significantly associated with 25(OH)D level in the multivariate analysis.
Discussion
Serum 25(OH)D level is the standard clinical measure of vitamin D status. Although a consensus regarding the optimal level of serum 25(OH)D has not yet been established, we chose a cut-off value of 30 to define vitamin D deficiency, to be consistent with the majority of experts who define the optimal level of 25(OH)D as ≥ 30 ng/ml (75 nmol/l) [41]. This level has been shown to be associated with maximal suppression of PTH and reduced fracture rates and was postulated to be associated with better health outcomes [42,43].
Among the men and women, the univariate analysis showed significant differences in the averages of some clinical and anthropometric parameters across quartiles of 25(OH)D. However, the differences in these parameters were small and were likely of marginal clinical significance. Furthermore, these differences may have resulted from the effects of confounders. In the multivariate analysis, after adjusting for important variables including age, gender, marital status, education level, region, hours of vigorous activity, body mass index, and calcium, creatinine, PTH, and magnesium levels, there was no significant association between low 25(OH)D level and MeS. The association remained non-significant when 25(OH)D level was used in its continuous form or when categorized based on the quartiles of 25(OH)D level.
The findings of previous cross-sectional studies [20-35] that explored the association between 25(OH)D and MeS are contradictory. Our finding of a lack of association between 25(OH)D level and MeS is in agreement with findings of previous studies [31-34]. However, the majority of studies [21-30] have shown an inverse association between 25(OH)D level and MeS. The reasons behind the contradictory findings could be multiple, which makes the comparisons between studies difficult. Previous studies used different cut-off values to define insufficiency or deficiency of vitamin D, different definitions to define MeS, and used different statistical analysis strategies to analyze the data. During analysis, some authors used MeS as the dependent variable while others used 25(OH)D as the dependent variable. Some studies analyzed 25(OH)D as continuous and other studies analyzed it as dichotomous or as categorical based on quartiles or quintiles.
In the multivariate analysis, the association between 25(OH)D and MeS was adjusted for important variables, including magnesium, calcium, and PTH. Not all previous studies adjusted in the multivariate analysis for important variables such as PTH and magnesium, which may at least partly explain the inverse association observed between vitamin D and MeS in other studies. Adjustment for such variables is extremely important because a close relationship exists between 25(OH)D, calcium, and PTH [34], to the extent that changes in the levels of any one of these biomarkers affects the levels of the others. A recent Swedish study of elderly men [44] showed that plasma PTH level was associated with a higher risk of cardiovascular mortality, even after adjustment for established cardiovascular risk factors and vitamin D deficiency. The effects of PTH and magnesium are of particular interest, as elevated levels of PTH and hypomagnesemia have been reported together with MeS [24,33,35], and low serum magnesium levels have also been linked to insulin resistance [45]. The Medical Research Council Ely Prospective Study [46] showed that the inverse association between baseline 25(OH)D levels and the MeS risk Z score was no longer significant after adjustments for PTH, calcium, and IGF-1.
Considering the association between 25(OH)D and individual components of MeS, 25(OH)D level was not significantly associated with individual components of MeS. Previous studies that explored the association between 25(OH)D and individual components of MeS showed inconsistent findings ranging from no association to inverse or positive associations. Studies that analyzed NHANES III data showed an inverse association between blood pressure and vitamin D concentration, even though it was not consistent across all different groups of subpopulations [47,48]. Other studies [49,50] did not show a significant association. The majority of cross-sectional and prospective studies in various populations have shown inverse associations between circulating 25OHD and fasting plasma glucose (FPG) [14,24,33], as well as triglyceride concentrations, especially in patients on hemodialysis, and various anthropometric measures. Some studies did not support such associations or reported discordance in the results depending on the population [14] and the measured outcomes.
One of the strengths of the present study is that the generalizability of the study findings is enhanced by the selection of a nationally representative sample of Jordanian adults. However, this study is limited by its cross-sectional design, which impairs causal inference due to the lack of temporality. Furthermore, only a single measurement of 25(OH)D was obtained.
In conclusion, this study did not provide evidence to support the association between 25(OH)D levels and MeS or its individual components. Prospective studies are necessary to better determine the roles of 25(OH)D levels in the etiology of MeS.

 XML Download