

 PDF
PDF ePub
ePub Citation
 Print
Print


Introduction
Various factors including the increased availability of sweet beverage with calories, aggressive marketing by beverage industries and changes in human preference for beverages may have contributed to global increase in obesity [1]. The consumption of commercial beverage has increased dramatically in Korea with a market size of 2.86 billion dollars as of 2008 [2].
Sugar, caffeine and organic acids, which are common components of many commercial beverages such as carbonated soft drinks, coffee, and fruit juice drinks, have been associated with obesity, type II diabetes, bone loss, and tooth decay [3-6]. From 1999 to 2004, US youth consumed a mean of 224 kcal per capita per day from sugar-sweetened beverages, representing approximately 11% of their daily energy intake [7]. Caffeine content may be another concern regarding cardiovascular diseases [8] and bone loss [5], especially when soft drinks become a favorite choice resulting in substitution of milk [9]. Tooth erosion is another health concern related to beverages popular in the United States [6]. The risk of developing obesity was shown to increase by 60% in children with each additional daily drink in a longitudinal study [3]. According to a cross-sectional study [10], total energy intake was about 10% higher in the school children who drank soft drinks compared with those who did not.
The acuity and preference of taste play important roles in determining the nutritional status of and consequently the general health of an individual. Increased threshold of taste was found to occur with ageing [11], certain diseases such as chronic renal failure [12], and use of medications [13] and was associated with decreased nutrient intake. In addition, patients have been shown to modify their selection of food in certain circumstances; for example, sweet foods tasted sweeter due to significant reduction in the threshold for sucrose in patients who had Roux-en-Y gastric bypass [14]. Improved acuity for salty taste by a reduction in dietary salt intake as well as decreased acuity by a high intake of salt tablets was reported [15]. How much salt they preferred in their food was shown to depend on the level of salt they consumed, and salt preference was shown to be lowered by a reduction in sodium intake [16,17]. Considering the changes in acuity and preference for salty taste by dietary salt intake, the effect of frequent beverage consumption on perception of sweet taste deserves to be studied in current society which is struggling with obesity and related diseases.
Although dietary habits and lifestyles of university students have a great influence on nutritional intake and consequently general health of later life as well as life expectancy, this early adulthood is the time when they have the least amount of interest on diet and health. Especially, university students are likely to have frequent snacking, eating out, eating at night and overeating because of the tight or inappropriately planned class schedule, newly obtained independency and burden from study and workstudy [18]. Because male students tended to discuss nutrition with their friends less frequently and hold less stronger beliefs related to nutrition [19], they might be more vulnerable to have undesirable beverage consumption pattern compared to females.
Therefore, lifestyles, dietary habits and consumption pattern, as well as sweet taste perception were compared among groups divided by the frequency of consumption of commercial beverages. The results can provide better understanding of the factors associated with frequent consumption of commercial beverages and will be useful in planning an evidence-based education program focusing on wise consumption of commercial beverages.
Materials and Methods
Research participants
The participants of this study were 480 male students of a private university located in Northern Kyeonggi province, Korea. Originally a total of 577 university students were recruited using advertisements on department bulletin boards. Among them, 97 incomplete questionnaires were excluded from the study. Participants were divided into three groups according to the average servings of commercial beverages consumed per week: less than one (rare consumption group, 120); 1-3 (moderate consumption group, 227); more than 4 (frequent consumption group, 133). Among 480 male students, 58 agreed to participate in this study as taste test subjects. This study was approved by Daejin University Institutional Research Board and informed written consents were obtained from the subjects. Survey and taste test were conducted between May and June of 2008.
Questionnaire development
The developed self-administered questionnaire was 3-page long and took less than five minutes to complete in most cases. The questionnaire included the definition of commercial beverages and assessed general characteristics of the subject (age, perception of own health status, experience of dieting, and monthly allowance); consumption pattern of commercial beverage (consumption frequency, occasions associated with consumption, reason for consumption, the most important factor that influence the choice of beverage, place of purchase, daily expense for beverages); lifestyles (frequency and duration of exercise, frequency and amount of alcohol intake, smoking status, and hours for screen viewing (TV watching and computer use); dietary habits (meal regularity, breakfast type, frequencies of eating out, snacking, and eating delivered foods, processed foods, sweets, and salty or MSG-containing foods). The frequency of commercial beverage consumption was determined by asking subjects to mark 0, 1, 2, 3, 4, 5, 6, 7, and 8 for consuming 0, 1, 2, 3, 4, 5, 6, 7, and more than 7 servings per week, respectively.
Taste test
For the taste perception tests, 58 subjects were selected from volunteers, after excluding those who were smokers or on medication. The acuity for sweet taste was represented by the detection threshold concentration of sucrose solution. The taste test was conducted in 10-12 am or 3-5 pm, at least two hours after a meal. Sucrose and sodium chloride used were of food grade. A three-alternative, forced-choice procedure was employed to determine the threshold of detection, using a single blind design [20]. The concentrations of sucrose solution used were 0.88, 1.75, 2.63, 3.50, 4.38, 5.84, 7.30 and 8.76 mM dissolved in deionized water and stored at 4℃. Before the taste test, the solution was allowed to reach room temperature. For each concentration, one cup of sucrose solution and two cups of deionized water, as a triad on each dish, were placed on the table before each participant arrived. Each cup was marked with a 5-digit code identifiable by the test givers but not by the participants whether solution contained sucrose or not. Beginning with the lowest concentration, the participants were required to taste all three fluids in a random order in an attempt to distinguish the sucrose solution from the deionized water. The lowest concentration that was detected successfully in two consecutive trials was recorded as the detection threshold concentration. The threshold was considered to be 8.76 mM when a participant could not detect the sweet taste even at the highest concentration.
Jelly was used to determine the preference for sweet taste. Omija (Schizandra chinensis Baillon) extract was made by soaking 60 g of omija in 1 L of deionized water which was cooled after boiled, for 18 hours at 4℃. In order to make jelly with 11% sucrose, 55g of sucrose and 60 mL of omija extract were added in 371 mL of deionized waster and heated to boil. After removed from heat, 14 g of gelatin was added and mixed until dissolved completely. For jelly with 13%, 15%, 17% and 19%, 65 g, 75 g, 85 g and 95 g of sucrose and 361 mL, 351 mL, 341 mL and 341 mL of deionized water were used, respectively. After completely dissolved, jelly was transferred to plastic container with tight lid and hardened at 4℃. Each participant was requested to choose the jelly which he liked the most from five cups containing jellies with different sweetness.
Statistical analysis
Statistical analysis was done using SPSS 14.0K for Windows. The consumption pattern, favorite commercial beverage, dietary habits and lifestyles were reported as frequency (%). The age of participants, frequency of each commercial beverage consumption, and taste perception were represented as mean ± standard deviation. Significant differences in frequencies between groups were analyzed using Chi square test and significance was set at P<0.05. Significant differences among groups were tested by ANOVA followed by Duncan's multiple range tests for individual group comparisons and significance was set at P<0.05.
Results
Consumption pattern and sweet taste perception
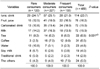
Age and taste test results of groups categorized by the frequency of commercial beverage consumptions are summarized in Table 1. The rare consumption group tended to have lower detection threshold than other groups (0.083 vs. 0.172 and 0.169 mM, respectively, P = 0.072), while the preference for sweetness was similar among groups. There were no significant differences among groups in age (21.8 year), perception of own health status (55.4% and 9.6% feel them healthy and unhealthy, respectively, data not shown), and dieting experience (data not shown). However, there were significant differences in monthly allowance among groups. While the monthly allowances of rare consumption group were equally distributed from less than 100,000 won to more than 300,000 won, 53.3% of moderate consumption group's and 64.0% of frequent consumption group's allowances were more than 200,000 won, indicating that frequent consumption group had more spending money.
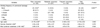
The consumption pattern of subjects according to the frequency of commercial beverage consumption is shown in Table 2. Compared to other groups, more subjects in frequent consumption group answered to consume commercial drinks casually without any particular occasion (45.1% vs. 17.5% and 22.0%, respectively), while more subjects in rare consumption and moderate consumption groups answered to consume during snacking (30.0% and 26.4% vs. 19.6%, respectively), after meal (15.8% and 14.1% vs. 12.0%, respectively), after exercise (16.7% and 15.4% vs. 6.0%, respectively), and when feeling hungry (7.5% and 6.2% vs. 2.3%, respectively) (P = 0.000). Half of the subjects in frequent consumption group spent 1,000 to 2,000 won daily on the purchase of beverages, which was significantly more than other groups. About 70% of subjects in other groups spent less than 1,000 won for beverages daily. The most influential factor in selection of a beverage was a flavor (72.1%), followed by price, health benefits and container.
Preference and consumption pattern of commercial beverages
There were significant differences in favorite commercial beverages among groups (P = 0.031) (Table 3): water, tea and soy milk were chosen as favorite commercial beverages in 10.8%, 9.2% and 6.7% of rare consumption group subjects, while those were chosen as favorites by only 3.1%, 6.2% and 2.6%, respectively of moderate consumption subjects and by 2.3%, 6.0% and 3.8% respectively of frequent consumption subjects. On the other hands, carbonated soft drink and coffee were the favorite commercial beverages to more subjects in frequent consumption group (15.4% and 18.0% vs. 10.8%, respectively) and moderate consumption group (7.0% and 9.0% vs. 2.5%, respectively) than those in rare consumption group. Sports drink was the most frequently answered favorite commercial beverage among the beverages assessed in this study, throughout the groups (24.1, 25.1 ad 21.0% in rare, moderate and frequent consumption groups, respectively).
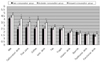
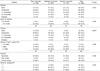
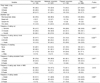
The consumption frequency of each commercial beverage is summarized in Fig. 1. Subjects in the frequent consumption group had significantly higher consumption frequencies of fruit juice (2.68 and 2.95 vs. 3.58, P = 0.001), coffee (2.52 and 2.95 vs. 3.87, respectively, P = 0.000) and non-carbonated soft drink (2.52 and 2.59 vs. 3.47, respectively, P = 0.000) than those in moderate and rare consumption groups. Also, frequency of carbonated drink consumption was significantly higher in frequent consumption group than moderate consumption group and higher in moderate consumption group than rare consumption group (P = 0.000). Milk was the most frequently consumed commercial beverage for total subjects (4.34 ± 2.42), followed by carbonated soft drink (3.19 ± 2.12), fruit juice (3.06 ± 2.04), coffee (3.04 ± 2.45), non-carbonated soft drink (2.81 ± 1.96), tea (2.57 ± 2.18), yogurt drink (2.44 ± 2.01), vitamin drink (1.95 ± 1.82), soymilk (1.78 ± 2.09), traditional drink (1.60 ± 1.80) and functional drink (1.50 ± 1.92).
Lifestyles
Health-related lifestyle practices are represented in Table 4. While the frequency and duration of exercise as well as the usual amount of alcohol intake were not significantly different among groups, the frequent consumption group showed significantly more frequent alcohol intake than other groups (P = 0.029): 33.3%, 43.2% and 48.9% of the rare, moderate and frequent consumption groups, respectively, drank more than once a week. Frequent consumption group tended to have more current smokers: 26.7%, 34.3% and 41.3% of rare, moderate and frequent consumptions groups, respectively, were current smokers (P = 0.065). Hours of screen-viewing except for studying tended to be longer in frequent users: 55.8%, 64.3% and 68.4% of rare, moderate and frequent users, respectively spent in viewing TV or computer screen for longer than 2 hours (P = 0.078).
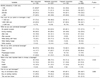
Table 5 shows several undesirable dietary habits associated with the frequent consumption of commercial beverages. More subjects in moderate consumption group ate traditional breakfasts instead of bread with milk or cereal with milk than those in rare consumption group (78.3% vs. 65.2%) and in frequent consumption group (P = 0.008). The most frequently answered frequency of eating out was less than bimonthly in rare consumption group (41.7%), monthly to bimonthly in moderate consumption group (45.8%) and monthly in frequent consumption group (38.3%), suggesting that frequent eating out is associated with frequent use of commercial beverages (P = 0.003). Frequent consumption of commercial beverages was also associated with frequent intake of delivered foods (P = 0.000), processed foods (P = 0.001), and sweets (P = 0.002): 13.3%, 24.2% and 39.9% of rare, moderate and frequent consumption groups ate foods delivered more than once a week; 29.1%, 34.4% and 51.9% of rare, moderate and frequent consumption groups, respectively ate processed foods more than 3 servings per week, and 48.3%, 51.1% and 69.2% of rare, moderate and frequent consumption groups ate sweets such as candy, chocolate and cakes more than three servings per week, respectively. Also more of rare consumption group never snacked (26.7% vs. 16.5%, respectively, P = 0.002), while more of subjects in frequent consumption group snacked more than twice a day (25.0% vs. 33.1%, respectively). On the other hand, there was no significant difference in the frequency of eating salty foods or MSG-containing foods.
Discussion
Although consumption of diet beverage with artificial sweetener does not contribute to extra caloric intake, it may lead to energy overconsumption by increasing people's preference for sweet taste [1]. The tendency of decreased taste acuity for sweet taste in frequent beverage consumption group found in this study provides another evidence to suggest that the young generation should be educated to avoid excessive intake of unnecessary sugary drinks. Although there is no study which investigated the effect of excessive intake of sweet foods or drinks on sweet taste acuity, Huggins et al. [15] reported the tendency of improved acuity of salty taste by a reduction of dietary salt intake, providing similar observation to the result of this study.
The results supported the emerging trends of the high consumption of sports drink by these age groups. Along with continuous development of newer items and increased advertisement, the emerging health-conscious trend may have led to the popularity of sports drinks, of which consumption even exceeded that of carbonated soft drinks [21]. Despite the absence of caffeine and less sugar content, a 8-oz serving of sports drink still provides 65 kcal per serving, which is not only unnecessary but also something to be avoided unless someone has engaged in a prolonged heavy exercise, for most cases. More than half of the subjects in this study answered that they consume commercial beverages to quench the thirst. This result calls for the need to educate people to drink just water instead of sports drink or ionic drinks.
It is worth noting that water and tea was answered more as the favorite drink in rare consumption group than in frequent and moderate consumption groups. Water and tea are the only two unsweetened commercial beverages with the possible beneficial effects on lipid risk factors associated with cardiovascular diseases [22]. On the other hand, more people from the frequent consumption group than from the rare consumption group chose carbonated soft drinks and coffee as their favorites, which are considered typically as unhealthy due to undesirable ingredients. Black tea as well as green tea is usually not sweetened in Korea.
Despite its ubiquitous use and stimulating effect on mental function, the effects of caffeine and coffee on cardiovascular diseases [8] and calcium homeostasis [23,24] raised a great concern for people at risk. Moreover, the majority of Koreans predominantly enjoys the type of coffee which is premixed with cream and sugar, resulting in increased fat and sugar intake, providing extra 65 to 300 kcal per serving, negating possible beneficial effects of anti-oxidants in coffee itself. The excessive intake of carbonated soft drinks has been well identified as the important target for obesity prevention, too [3].
Significantly higher frequency of alcohol intake, along with the tendencies of smoking and prolonged screen-viewing, were undesirable lifestyle practices found in the frequent beverage consumption group in this study. The results is comparable with the study results on adolescents [21] in which hours of watching TV and hours of using computer were positively correlated with the frequency of carbonated drinks consumption.
Milk was the most frequently consumed commercial beverage for total subjects in this study, which is consistent to the result on elementary school students, in which milk was the highest amount of beverage consumed among all beverages [25]. Frequent snacking and skipping meals as well as westernized type of breakfast have been associated with high consumption of beverages in previous studies done in adolescents [26], in which water was the most often chosen drink for meals primarily consisted of rice, while milk was the one with bread. However, the proportions of those who had bread or cereal as breakfast in this study were not different among groups (9.2%, 12.3% and 11.4% of the rare, moderate and frequent users, respectively), suggesting that the type of breakfast of the subjects who answered 'the other' should be clarified in future study regarding this aspect. It is possible that lower rate of having traditional breakfast in frequent consumption group may result from the fact that more subjects in this group skip breakfast as shown in Table 5.
Whether consumption of delivered foods, processed foods and sweets as well as eating out may be the cause or consequence of commercial beverage consumption remains unclear from the results of this study and any of these dietary habits has not been directly associated with beverage consumption in the previous studies as far as we are aware of. However, it is reasonable to state that frequent intake of processed foods and sweets may be closely linked to the frequent snacking. Also in many cases, ordering of beverage is encouraged when main dish is ordered in restaurants and when delivery foods are ordered. Moreover, popular menu are sold in combination with beverages in a set menu with lower price, encouraging consumers to purchase the set menu rather than to purchase only what is needed, without beverage, with very little extra cost.
All the undesirable dietary habits found in frequent beverage consumption group in this study were those identified as the factors leading to lower nutrition status in previous studies. For example, direct association between frequent beverage drinking and nutritional intake was studied with coffee [27] and coffee drinkers were found to have significantly lower intake of dietary fiber, several vitamins and vegetables compared to non-coffee drinkers.
Caution should be exercised in extrapolating our findings to general population due to limited sample size, homogenous subject population and the observational type of study design used. However, the present study comprises one of the first investigations designed to study undesirable dietary habits, lifestyle and taste acuity according to the frequency of sugary drinks consumption.
Several suggestions have been made to reduce the intake of carbonated soft drinks as well as fast foods [28]. Developing nutrition education materials, programs by web-site and booklet, and government and schools as well as the mandatory nutrition labeling which indicates contents of sugar and calories as well as keeping vending machine out of reach of schoolchildren, are among them. Another suggestion which should be considered by policy maker could be mandatory warning signs regarding possible health risks associated with excessive consumption attached to the label of commercial beverages containing calories and simple sugar exceeding upper limit.
 XML Download