

 PDF
PDF ePub
ePub Citation
 Print
Print


Introduction
Colored rice such as black and red rice consumptions are rapidly growing presently due to their healthy functional food ingredients in Korea. Anthocyanins, a group of reddish or purple flavonoids, are reported to be the primary pigments in these rice varieties (Abdel-Aal & Huel, 1999, 2003; Mazza & Gao, 2005; Moreno et al., 2005). Anthocyanins have been recognized as health-promoting functional food ingredients due to their antioxidant activity (Nam et al., 2006; Philpott et al., 2006; Saute-Gracia et al., 1997), anticancer (Kamei et al., 1995; Hyun & Chang, 2004; Zhao et al., 2004), hypoglycemic (Tsuda et al., 2003), and anti-inflammatory effects (Tsuda et al., 2002), and these functions provide synergic effects with various nutrients in vivo. The world production of anthocyanins has been estimated at 10,000 tons from grapes alone, and the average daily intake has been estimated as 215 mg in summer and 180 mg in winter. These numbers reflect the importance of anthocyanins in the human diet and a need to better understand their compositional characteristics and functionality in food and nutrition.
Anthocyanins from colored rice would be consumed more and consistently than those from grapes regardless of seasons among Koreans since rice is the major staple food in Korea. Therefore, anthocyanin-pigmented or colored rice holds promise as functional foods. At present, red rice is commonly used as a food colorant in bread, ice cream, and liquor (Yoshinaga, 1986). Anthocyanins are located in certain layers of the rice kernel, which could be separated into anthocyanin-rich fractions for use as functional colorants or functional food ingredients. Although an extensive scientific literature (Francis, 2000; Mazza & Gao, 2005) on the composition of anthocyanins in fruits and vegetables exists, little is known about anthocyanin composition in colored rice. Early studies have shown cyanidin-3-glucoside (C3G) as a major anthocyanin in black rice, but the minor ones were reported either malvidin-3-glucoside (Yoon et al., 1995) or peonidin-3-glucoside (Pt3G) (Choi et al., 1994). Recently, black rice was analyzed to contain a wide range of total anthocyanin content, with C3G being the most common anthocyanin (0.0~470 mg/100 g) in most of the 10 varieties studied, whereas Pt3G (0.0~40 mg/100 g) was the second dominant anthocyanin (Ryu et al., 1998). However, studies have shown substantial differences in anthocyanin content and composition between grains and their potential as natural food colorants.
The present study was aimed at characterizing anthocyanin composition in varieties of colored rice to identify anthocyanin-rich rice for the development of functional foods and/or functional food colorants. We used commercially available rice rather than samples grown in the laboratories despite the lack of background information, since we aimed to investigate rice varieties more easily accessible to the public. Easily accessible rice varieties will influence the diet of the public and consequently public health more than laboratory grown varieties. The identity of anthocyanin compounds was based on spectroscopic and mass data obtained from HPLC, Ultraviolet-Visible (UV-Vis) absorption spectrophotometer, paper chromatography and liquid chromatography-mass spectrometry (LC-MS).
Materials and Methods
Anthocyanin extraction
A diverse array of edible and ornamental black, red and wild (mixed with black and white grains) rice were purchased from a local retail market. The pure standard materials of C3G, delphinidin-3-glucoside (D3G) and Pt3G were the generous gift from the Department of Herbal Medicine Resources, Kangwon National University.
Thirty grams of each sample were grounded with pestles and mortars after frozen with liquid nitrogen. Anthocyanins were extracted according to the method described by Abdel-Aal et al. (2006) with slight modifications after grounded samples were soaked in 30 ml hexane for 24 hr to remove fats and oils. Three grams of the ground materials were extracted twice by mixing with 30 mL of methanol acidified with 1.0 N HCl (85:15, v/v) and shaking on a shaker at 4℃ for 24 hr. The crude extracts were filtered with Whatman No. 1 paper.
Analysis of anthocyanins and LC-MS confirmation of anthocyanin
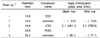
Anthocyanins in the partially purified extracts were separated and quantified with reverse phase HPLC equipped with a Xterra MS C18 column (3.5 µm, 4.6 × 250 mm), Tosoh TSK-6040 UV-Vis detector (Tokyo, Japan). The column was eluted with a mobile phase consisting of H2O:methanol:formic acid (75:20:5, v/v/v) with flow rate of 0.5 ml/min. The separated anthocyanins were detected and measured at 530 nm, and the identity of anthocyanins was based on the congruence of retention times and UV-Vis spectra with those of pure authentic standards. The anthocyanins were further identified with LC-MS after separation of each peak carried out by preparative HPLC with GROM-SIL 120 ODS-5 ST 0.5 µm (150 × 20 mm) column and Younglin M720 UV-Vis detector at 530 nm. The eluent of preparative column was same as the analytical HPLC system with flow rate of 10 ml/min, and the injection volume of the sample was 500 µl. Each peak sample was collected separately and concentrated approximately 5-fold by freeze-drying.
Confirmation of identity of each peak was carried out by LC-MS (Agilent Technologies, Santa Clara, CA, USA) employing electrospray ionization (ESI) and operating in a single quadrupole mode. The instrument was scanned over the m/z range of 50 to 1000 in the ESI positive ion mode. The LC-MS was eluted with acetonitrile (ACN) and 0.5% NH4OH (90:10, v/v) with flow rate of 0.4 ml/min, and the injection mode was FIA (Flow injection analysis). The mass spectrometer was tuned for maximum response to C3G.
Identification of sugar moiety of the unknown peak
After the aglycone of the unknown anthocyanin was confirmed with LC-MS, the sugar moiety was confirmed by HPLC chromatography after acid hydrolysis. Acid hydrolysis was carried out according to the standard procedure (Schou, 1927). The hydrolysate was extracted with amyl alcohol and used for aglycone analysis with paper chromatography and UV spectrophotometer. The aqueous phase after extraction was concentrated and used for sugar analysis with HPLC. HPLC condition to identify sugar moiety was equipped with a Prevail Carbohydrate ES (GRACE, 5 µm, 4.6 × 250 mm) and ELSD 3300 detector (Alltech, Deerfield, IL, USA). The column was eluted with a mobile phase consisting of 75% ACN with flow rate of 0.7 ml/min. The identity of sugar moieties was based on the congruence of retention times with those of pure authentic standards.
Results and Discussion
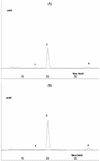
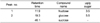
The acidic methanol extracts of the black and wild rice showed mixtures of three peaks that were characterized on the basis of UV-Vis/MS properties and the retention times of components separated by LC, while no pigment was found from the acidic methanol extract of the red rice. The results of HPLC analysis of black and wild rice and the authentic standards of anthocyanin pigments are shown in Table 1 and HPLC chromatograms are shown in Fig. 1. Peak 2 was identified as C3G by the congruence of the retention time with authentic standard of C3G. Peaks 1 and 3 could not be identified by comparison with authentic standards. Consequently, they were further investigated on the bases of spectroscopic and spectrometric properties or by chromatographic methods.
In order to identify the unknown peaks 1 and 3 of extracts from black and wild rice, acid hydrolysis was conducted. The typical structures of anthocyanins are composed of a central flavonoid ring structure (aglycone) and a saccharide moiety connected to aglycone. More than 539 possible combinations have been investigated so far, and the saccharides may be underivatized or have an attached acyl moiety. Different positional and structural isomer possibilities are added to the complexity. Therefore, the typical anthocyanins can be cleaved to aglycone and saccharide moieties by acid hydrolysis (Strack & Wray, 1989). The aglycone fractions liberated from acid hydrolysis of the extracted anthocyanins by acidic methanol were analyzed and confirmed as cyanidin with UV-Vis spectrum and paper chromatography (Table 2). The wavelength showing a maximum absorbance (λmax) from UV-Vis spectra of aglycone fractions of anthocyanins varies widely by the investigators or research groups (Fuleki & Francis, 1968; Harborne 1984; Kim et al., 1973; Sakamura & Francis, 1968; Schou, 1927; Spaeth & Rosenblatt, 1950). Our results showed λmax of 547 nm in accordance with the reports of Fuleki and Francis (Fuleki & Francis, 1968). The same wavelength was reported as λmax of delphinidin by Spaeth et al. (Spaeth & Rosenblatt, 1950), but the results of paper chromatography confirmed that the aglycone moiety from this study was cyanidin. As the confirmation by UV-Vis spectrum and paper chromatography was conducted with acidic methanol extracts, the confirmation may not solely applied to the unknown peaks of 1 or 3. Therefore, by preparative HPLC, peak 3 was separated from other peaks and collected for further study.
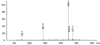
The anthocyanin fraction of peak 3 was characterized by fragmentation patterns arising from MS created by ESI in the positive mode. Fig. 2 illustrates the results of LC-MS spectrum of peak 3. A typical ESI positive MS shows two ions. One is the protonated molecular ion designated as [M+H]+ and the other is a fragment ion designated as [M+H-X]+ arising from the loss of the saccharide moiety. However, one observes a true molecular ion [M]+ and a fragment ion [M-X]+ because the anthocyanins have a natural residual positive charge. The fragment ion is that of the underivatized aglycone. The MS of the compound showing ions at m/z 287 and 449 suggests that the aglycone is cyanidin (m/z 287), and the difference of m/z 162 suggests a hexose (Abdel-Aal et al., 2006). Unfortunately, ESI-MS cannot distinguish various hexoses. Furthermore, the point of attachment to the aglycone also cannot be distinguished. Therefore, the confirmation of hexose of the anthocyanin fraction from the peak 3 was conducted by HPLC analysis.
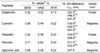
The saccharide moieties liberated from acid hydrolysis of the purified anthocyanins were identified. We could not conduct acid analysis with the peak 3 fraction solely since collected peak 3 fraction by preparative HPLC was not enough to run both LC-MS and identification of saccharide after acid analysis. Therefore, saccharide confirmation was conducted with acidic methanol extracts, which contained all 3 peaks. The results of HPLC analysis of the saccharide moiety showed that acidic methanol extracts of black rice contain glucose and fructose. Since peak 2 was confirmed as C3G, fructose could be liberated from the anthocyanin fraction of peak 3. The aglycone identified from the acidic methanol extracts was only cyanidin, and the saccharide moieties were confirmed as both glucose and fructose. Therefore, we tentatively conclude that anthocyanin fraction from peak 3 of the acidic methanol extract of black rice is cyanidin-fructose. We could not confirm the point of attachment of fructose to cyanidin at the moment. Peak 1 could not be identified due to a small amount. Both black and wild rice showed similar anthocyanin profiles (data not shown). Therefore, only the differences between these two varieties were the C3G contents.
In conclusion, anthocyanin fraction found from peak 2 was confirmed as C3G based on the congruence of retention time of pure authentic standard. Further analysis of anthocyanin, aglycone and sugar moieties tentatively identified peak 3 as cyanidin-fructoside on the basis of spectroscopic properties with λmax of aglycone in 1% HCl methanol at 537nm, ESI-MS spectra with major ions at 449 and 287 m/z and chromatographic properties of several hexoses. But peak 1 was not characterized due to a limited content. Black and wild rice showed same anthocyanin profiles whereas red rice variety did not show any anthocyanins.
 XML Download