

 PDF
PDF ePub
ePub Citation
 Print
Print


Introduction
Growing numbers of people have an interest in health and many studies have been conducted on bioactive non-nutrients that should have been based on the study of nutrients. Only when the studies are conducted considering both factors, it is possible to acquire accurate data to maintain optimal health. Studies on nutrients are imbalanced as they are concentrated on specific nutrients, and there are not enough studies on the effects of minerals. Recently, mineral deficiency caused by over-consumption has been a concern, and as the function of minerals has been examined in relation to chronic diseases, the necessity of studies on the minerals that have been underestimated needs further study.
Studies on the relationships between chronic diseases and minerals started with epidemic study (Schroeder, 1960) that examined the effect on residents who consumed hard water in which calcium and magnesium had a rich content. The results showed a lower mortality rate caused by circulatory diseases than those who had consumed soft water. Since that time, studies have been conducted on the effect of calcium and magnesium with regard to the maintenance of the constancy of blood pressure and the decrease of blood lipids and studies on the effect of consumption of micro-minerals including zinc, copper and iron on blood lipids (Choi, 2000; Klevay et al., 1984), studies on the metabolism of manganese and cholesterol (Davis & Greger, 1992), studies on the metabolism of chromium, sugar and protein (Mertz et al., 1974) and also studies on the metabolism of selenium and lipid (Diplock, 1987). An increasing number of people have an interest in the effect of the health-related functions of minerals, but there is still a lack of study on the function of micro-minerals and consumption patterns.
Specifically, manganese (Mn) needs further study, more than any other mineral, for the following reasons. First, with regard to chronic diseases, it plays a role in maintaining health. Manganese is known to be a nutrient essential to the formation of the skeletal structure and the metabolism of amino acids, cholesterol and carbohydrates (Keen et al., 1999). Koreans typically have a weaker skeletal structure due to a lack in the consumption of calcium, and as anti-oxidation is related to various diseases, attention needs to be paid to the function of manganese in this area. When calcium and manganese are administered as a supplement to osteoporosis patients that experience a decrease in manganese in blood, bone mineral density have shown improvement (Freeland-Graves & Turnlund, 1996). Furthermore, when there is a lack of manganese, active MnSOD has decreased and lipid peroxide levels have increased (Malecki et al., 1994).
There is also the lack of a database on the manganese content in Korean foods. The food composition table (National Rural Living Science Institute, 2006) by the rural development administration provides a database on 262 types of manganese content, but it also cites 118 types of foreign data (45%). Since inorganic content in foods varies depending on region and diet patterns, it is problematic to evaluate the amount of consumption through the use of foreign data. It is continuously complemented, but there is not enough sufficient data in terms of the type and number of analyzed foods. The food contains many functional minerals known to play important roles such as the prevention of cancer and oxidation and the improvement of glucose metabolism in the body, but there is still a shortage of related study on mineral intake in Koreans.
In this regard, this study aims to estimate daily intake of manganese in Korean adults. This is done through the use of the database of manganese content in 366 frequently consumed Korean foods (Choi & Kim, 2007) after first conducting anthropometric measurement and a survey on dietary intake with 354 Korean adult males and females.
Materials and Methods
Subjects of the survey
Subjects of the survey agreed to take part after the objectives, contents and process of the study were fully explained, and healthy people were selected, which included a total of 354 subjects, comprised of 149 males and 205 females.
Anthropometric measurement and the survey on dietary intake
The subjects took off their shoes and wore light clothes to have their heights and weights measured twice through the use of a height and weight measurer (JENIX, Korea), and an average height and weight was calculated. The types and quantity of foods that the subjects ate for breakfast, lunch, supper and between-meal-snacks as well as food consumed for the past 24 hours from the moment they woke up in the morning until they went to bed were surveyed. Researchers helped the subjects to accurately recall the amounts of foods that the subjects consumed by suggesting prepared models and viewing photos to standardize the survey on diet. Based on the results of the dietary intake survey, the amount of consumption of nutrients was analyzed through the use of CAN-Pro 3.0 (The Korean Nutrition Society), and the amount of manganese consumption was calculated through the use of the manganese content database in the 366 frequently consumed foods by Koreans (Choi & Kim, 2007).
Statistical analysis
Average and standard deviation of all results of the study were calculated through the use of the SAS program (version 8.01, SAS Inc, Cary, NC). As for variations between males and females, an unpaired t-test was used in the case of continuous variables, and a χ2-test was used in the case of discontinuous variables. Correlation between variables was calculated through the use of Pearson's correlation coefficient, and a significance test on all results was conducted at level of p<0.05 unless otherwise stated.
Results
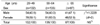
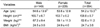
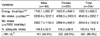
As seen in Table 1, there was no significant difference in terms of the distribution of age of subjects according to gender, and general characteristics on the subjects are the same as reported in the previous study (Choi & Kim, 2007) as seen in the Table 2. Table 3 indicates the results of manganese intake of the subjects. Males posted 1740.1 kcal in daily average energy consumption while females posted 1432.6 kcal. Males recorded 5.2 mg in daily manganese intake and females 4.1 mg showing that males posted a higher intake (p<0.001). Males and females posted, respectively, 3.0 mg and 2.9 mg in manganese intake per 1000 kcal of consumed energy showing no significant difference. Males and females posted, respectively, 148.8% and 135.2% of the adequate intake, and 8 males and 3 females surpassed the tolerable upper intake level.
Discussion
There is not enough sufficient data on the distribution of manganese intake by Koreans, and it is due to the shortcomings of the database on manganese content in foods. Evaluation of manganese consumption of same subjects based on data on the manganese composition in foods at home and abroad (National Rural Living Science Institute, 2006; Suzuki, 1993; USDA, 2003) found that males and females posted, respectively, 3.7 mg and 3.2 mg (Choi & Kim, 2007) in daily manganese intake, which indicates lower rates generated for data analyzed in this study. In addition, according to evaluation through the use of food composition data (National Rural Living Science Institute, 2006; Suzuki, 1993; USDA, 2003) similar to a previous study (Choi & Kim, 2007), 50 female college students recorded 3.8 mg (Sung & Yoon, 2000) in daily manganese consumption, which indicates a lower rate than that found in this study. The study of Kim & Lee (2006) showed high intake of energy (1889.4 kcal) but low intake of Mn (3.7 mg) compared to the present study. And the study of Cho et al. (2006) reported that similar energy (men 1720.9 kcal, women 1443.1 kcal) and Mn (3.7 mg) intake level compared to our study. However, evaluation of manganese consumption of 64 postmenopausal women based on data on the manganese composition in foods at home and abroad (National Rural Living Science Institute, 2006; Suzuki, 1993; USDA, 2003) found that females posted 5.1 mg (Choi & Sung, 2007) in daily manganese intake, which indicates higher rates generated for data analyzed in this study. Since many domestic data studies on manganese in foods cite analysis results from abroad, if they are applied as they are, frequently consumed foods might be omitted resulting in an underestimation of manganese consumption.
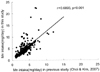
McLeod and Robinson (1972) reported 3.7 mg in manganese consumption from daily diet. Patterson et al. (1984) reported that it recorded 1.6 mg/1000 kcal while Greger et al. (1990) said that it was 2.8 mg. Since manganese intake is drastically different according to dietary patterns, frequent tea drinkers and vegetarians posted a higher rate, and the manganese consumption found in a western style diet and vegetarian meals ranges from 0.7 mg per day to as much as 10.9 mg per day (Gibson, 1994). Manganese is known to be supplied through plants such as vegetables and beans (The Korean Nutrition Society, 2005). According to this study, the main suppliers of manganese to the subjects were found to be cereals, vegetables and beans, and they are not only a source of manganese but they are also highly consumed foods in Korea. Since the study focused on the analysis of manganese content, it seems that it generated higher rates of manganese consumption than studies (Choi & Kim, 2007; Sung & Yoon, 2000) based on foreign data. Evaluation of the correlation between manganese consumption from previous study (Choi & Kim, 2007) and that calculated through the use of data (Choi & Kim, 2007) on manganese content in the foods analyzed for the study indicated a significant positive correlation as seen in the Fig. 1. It appears to indirectly explain the reliability of the data on manganese content in the foods analyzed for the study and of the manganese consumption determined by the database.
In the meantime, Kwak et al. (2003) who evaluated manganese intake of 168 elderly people residing in agricultural areas showed that males and females posted, respectively, 6.0 ± 8.6 mg and 5.5 ± 11.9 mg, indicating a great personal difference, and this was a little higher than the manganese consumption in the subjects of the study. It was already mentioned that one of the reasons for the difference is differing databases on the manganese content in the foods used for the analysis of manganese consumption and that a thorough database needs to be established through chemical analysis of manganese content in frequently consumed foods in Korea to evaluate the amount of manganese consumption more accurately. And, evaluation of manganese consumption needs to be conducted considering more diverse factors and the results of analysis need to be reviewed on a continual basis.
 XML Download