

 PDF
PDF ePub
ePub Citation
 Print
Print


INTRODUCTION
Hypertension increases the morbidity of arterial diseases, stroke, angina, and myocardial infarction, and more than 90% of hypertensive patients have essential hypertension, a form of hypertension that, by definition, has no identifiable cause. Multiple environmental factors such as eating habits, stress, drinking, and smoking, act in conjunction with genetic factors to produce hypertension, although the specific cause of the affliction is still unclear [1]. Several factors, including activation of the sympathetic nervous system, activation of the renin-angiotensin-aldosterone system, changes in G-protein-coupled receptor signaling, and infection, have been reported to cause essential hypertension [2]. Considering that these factors are caused by oxidative stress, it has been established that hypertension is associated with an increase in oxidative stress in the blood vessels. Studies on the association between hypertension and oxidative stress have recently been reported. Several previous studies comparing the levels of oxidative stress-related markers in the hypertensive group and the control group have reported that the level of DNA damage in the hypertensive group was greater than that in the control group, whereas the total antioxidant status (TAS) was lower in the hypertensive group [34]. In addition, the level of malondialdehyde (MDA), which represents lipid peroxidation, was higher, and the erythrocyte antioxidant-enzyme activity was lower in the hypertensive group, suggesting an association between oxidative stress and hypertension [5]. Hence, it seems that hypertensive patients are more sensitive to oxidative stress than normal people; therefore, nutrition intervention with anti-oxidative foods is required to prevent and reduce the oxidative stress.
Kale (Brassica oleracea acephala) is a cruciferous vegetable containing the highest amount of beta-carotene among green and yellow vegetables, as well as antioxidant vitamins including chlorophyll, vitamin C, β-carotene, and α-tocopherol, and phenolic compounds and minerals [6]. In addition, kale has a strong antioxidant effect, and reduces blood glucose and low-density lipoprotein (LDL) cholesterol [7]. In our previous study, a daily intake of mixed green juice (Angelica utilis Makino 30%, kale 30%, turmeric 23%, rooibos 17%) for 8 weeks reduced DNA damage in smokers [8].
Glutathione s-transferase (GST) is a phase II enzyme involved in the mechanistics of anti-oxidation in the body. On entering the body, carcinogens combine with glutathione to form a water-soluble complex for detoxification. There are 8 GST genetic polymorphisms associated with several genes and isozymes: alpha (GSTA), mu (GSTM), kappa (GSTK), omega (GSTO), pi (GSTP), sigma (GSTS), theta (GSTT) and zeta (GSTZ) [910]. Due to the polymorphisms, there is high variation in GST activity, which results in the intensification of oxidative stress or affects the susceptibility to diseases such as hypertension. Thus, antioxidation mechanism in the body may differ in individuals due to GST genetic polymorphism, and the effects of antioxidative foods would therefore vary [11]. In the previous studies on the effect of GST genetic polymorphism with intake of the same food, L. C. Wilms et al. [12] conducted an intervention study to investigate the association between the level of DNA damage and GSTT1 polymorphism after a 4-week intake of blueberry/apple juice. They reported higher protective effects on DNA damage in the T1 wild genotype compared to the T1 null genotype. Another study reported that intake of Brassica vegetable diet by women having the GSTM1 null genotype increased the GST-α and total GST activity [13]. In addition, smokers who drank caffeine-free green tea for four years, reported a lower level of DNA damage (determined using 8-OHdG) in subjects with GSTM1 and GSTT1 wild type than in subjects with GSTM1 and GSTT1 null type [14]. In another intervention study of smokers who drank green tea, the DNA damage was significantly reduced in the GSTM1 wild genotype group [15]. These results confirmed that the intake of the same food could produce different effects depending on genetics. In our previous studies, hypertensive patients fed kale juice demonstrated an increase in antioxidant capacity. The present study was conducted to investigate whether there is a difference in the effect of kale juice on reduction of oxidative stress, depending on the GST genetic polymorphism. In this study, hypertensive patients were classified into three groups based on their GSTM1 and GSTT1 genotypes (wild/wild, wild/null, and null/null genotype groups), and changes in oxidative stress-related markers were compared.
SUBJECTS AND METHODS
Selection of subjects and blood collection
Subjects were recruited from educational personnel and graduate students at the Hannam University located in Daejeon, employees in of the Daejeon Government Complex, and few participants from a previous study [16] residing in Daejeon. Inclusion criteria included systolic blood pressure ≥ 130 mmHg or diastolic blood pressure ≥ 85 mmHg, and subjects who had not taken antihypertensives. This study was approved by the institutional review board of Hannam University (2012-04k).
Blood sampling was performed at 0 week (baseline) before the intervention study with kale juice, and at 6 weeks after intake of kale juice. The subjects gave consent for blood sampling and were instructed not to eat or drink for at least 8 hours before blood sampling. Blood was collected in 10 mL heparinized sterile tubes (Vacutainer Becton Dickinson Co.); 200 µL of whole blood to be used for the comet assay, and 500 µL of whole blood to be analyzed for GST genetic polymorphism and glutathione (GSH) were stored separately. Rest of the sample was centrifuged at 1,000 rpm for 15 minutes to obtain the platelet-rich plasma (PRP) supernatant, which was collected and stored for measurement of ascorbic acid. The remaining sample was re-centrifuged at 3,000 rpm for 30 minutes to separate plasma and blood cells. Supernatant platelet-deficient plasma (PDP) was stored for analysis of conjugated diene (CD), oxygen radical absorbance capacity (ORAC), nitric oxide (NO), and antioxidant vitamins. Iso-osmotic phosphate buffered saline (pH 7.4) was added to the red blood cells, and the mixture was centrifuged three times at 3,000 rpm for 10 minutes, and then diluted with buffer at a rate of 1:1 to prepare an erythrocyte suspension. Plasma and red blood cells were stored at −80℃ for later analyses.
General characteristics and dietary intake survey
Demographics of the subjects were investigated using a questionnaire on sex, age, smoking status, smoking amount, smoking history, non-smoking period, drinking status, types of alcohol, drinking amount, physical activity, and exercise time. Before the blood sampling, the systolic and diastolic blood pressure values of rested subjects were measured three times at intervals of one minute using a sphygmomanometer (Watch BP home, Microlife, Switzerland), and their average values were calculated. Height was measured using an anthropometer. Weight, body mass index (BMI), body fat (%), and waist-hip ratio (WHR) were determined using the Inbody 520 (Bio-electrical Impedance Fatness Analyzer, Biospace Co., Ltd., Korea).
Dietary intake was assessed in a face-to-face interview using the 24-hour recall method, before intake of kale juice and after six weeks of juice intake. The interview was conducted by trained interviewers, and the results were converted to daily intake of nutrients by CAN Pro (version 3.0), produced by The Korean Nutrition Society.
Supply of kale juice
The kale juice used in the study was supplied by Pulmuone Co. Ltd., and was 100% kale juice. The subjects drank two bottles (total 300 mL) every day for six weeks. Kale juice was freshly extracted and delivered to each subject. The subjects kept a daily record of intake of kale juice as well as recorded their eating habits and lifestyle. The kale juice supplied to the subjects contained vitamin A (626.7 µg RE), vitamin C (131 mg), and polyphenols (115 mg).
Genetic polymorphism
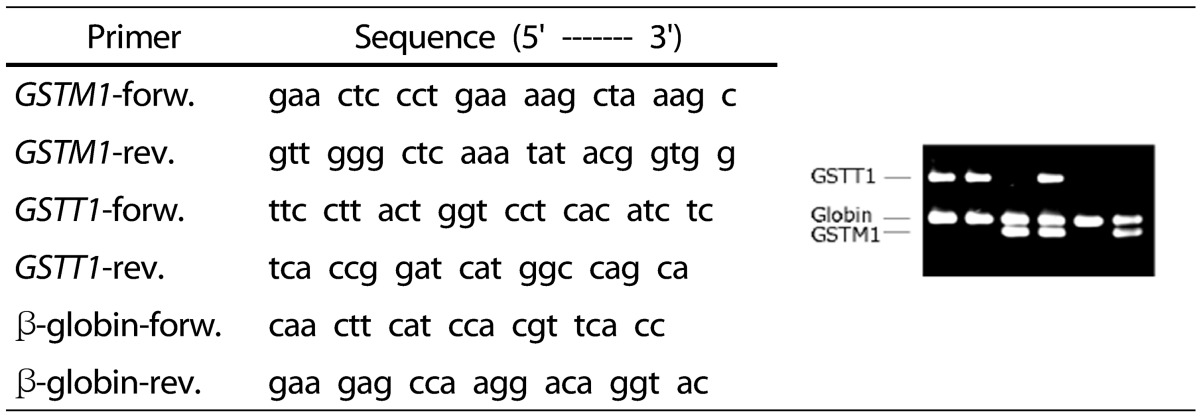
Glutathione s-transferase (GST) M1 was analyzed using the modified method of Bell et al. [17], and GSTT1 was analyzed by the modified method of Capoluongo et al. [18]. For the analysis, 500 µL of whole blood was subjected to DNA extraction using a DNA Genomic Blood Mini kit (NucleoGen, Korea). The internal standard was β-globin, and multiple PCRs were performed for gene identification. Primers were purchased from Bioneer Corporation, and the base sequence is presented in Table 1.
In the GSTM1 and GSTT1 gene analysis, 10 nmol of primers, 5 mM of dNTP, 0.5 unit of Taq polymerase (Takara rTaq), 200 mM of Tris-HCl (pH 8.3), 500 mM of KCl, and 30 mM of MgCl2 (20 µL of PCR mixture) were added to 0.1 µg of genomic DNA. The mixtures were processed in the following sequence: 95℃ for 2 minutes, 94℃ for 1 minute, 64℃ for 1 minute, and 72℃ for 1 minute. After 30 cycles of amplification, they underwent a reaction at 72℃ for 7 minutes [18]. The resultant products were then subjected to electrophoresis using 1% agarose gel containing ethidium bromide (0.1 µg/mL), and the amplified PCR product was confirmed under UV light.
Plasma antioxidant vitamin
Plasma ascorbic acid was evaluated by the 2,4-dinitrophenylhydrazine method [19] using a UV/VIS spectrophotometer. In order to determine the concentration of plasma ascorbic acid, the plasma was treated with 0.75 M metaphosphoric acid to precipitate protein and stabilize ascorbic acid. Ascorbic acid gets oxidized to dehydroascorbic acid and is then hydrolyzed to diketogluconic acid. Further treatment with 2,4-dinitrophenylhydrazine results in formation of the stable reddish brown osazone, which is was measured at 520 nm using a UV/VIS spectrophotometer.
To measure the levels of plasma vitamin A (retinol), vitamin E (α-tocopherol, γ-tocopherol), carotenoids (α-carotene, β-carotene, cryptoxanthin), and coenzyme Q10, the protein was removed using ethanol extraction, and lipid was extracted in n-hexane. The hexane was then evaporated using a rotary evaporator. The samples were dissolved in the mobile phase (methanol:dichloromethane = 85:15) and measured by HPLC[20].
Measurement of erythrocyte antioxidant-enzyme activities
The antioxidant enzymatic activity of red blood cells was measured using a UV/VIS spectrophotometer (Shimadzu UV-1601). For measuring the superoxide dismutase (SOD), the red blood cell suspension was hemolyzed, followed by addition of ethanol and chloroform. The mixture was centrifuged at 3,000 U/min for 2 minutes, and the resultant supernatant was serially diluted. Varying concentrations of the supernatant were incubated at 37℃ for 10 minutes, after which 20 µL of pyrogallol was added. This mixture was analyzed using a UV/VIS spectrophotometer at 320 nm for 180 seconds. The SOD activity of red blood cells was defined as the antioxidant potential that inhibited the autoxidation of pyrogallol by 50% [21]. To determine the glutathione peroxidase (GSH-Px) activity of red blood cells, glutathione, glutathione reductase, and NADPH were added to the hemolyzed red blood cells, and the mixture was incubated at 37℃ for 10 minutes. The enzymatic reaction was started after adding t-butylhydroperoxide, and the extinction of NADPH was measured using a UV/VIS spectrophotometer at 340 nm for 90 seconds to determine the GSH-Px activity [22]. To identify the catalase activity of red blood cells, 50 mM phosphate buffer (pH 7.0) and hydrogen peroxide were added to hemolyzed red blood cells, and the reduced amount of hydrogen peroxide was measured at 240 nm and 20℃ for 30 seconds [23].
Measurement of lymphocyte DNA damage by alkaline comet assay
The alkaline comet assay was performed using the modified method of Singh [24]. Fresh whole blood (70 µL) was mixed with 900 µL of PBS, and lymphocytes were isolated using 100 µL of Histopaque-1077. A 20 µL aliquot of lymphocytes was collected and mixed with 75 µL of 0.7% low melting agarose gel (LMA), evenly dispersed on a fully frosted slide pre-coated with normal melting agarose (NMA), and stored at 4℃ after covering with a cover glass. Once the gel hardened, the cover glass was removed, and 75 µL of 0.7% LMA solution was applied. Cold alkali lysis buffer (2.5 M NaCl, 100 mM Na2EDTA, 10 mM Tris) was mixed with 1% Triton X-100 and 10% dimethyl sulfoxide; this mixture was applied to the slide in a darkroom and incubated at a low temperature for 1 hour, to unwind the double-stranded DNA. After lysis, the slide was placed in an electrophoresis tank, and the tank was filled with refrigerated electrophoresis buffer (300 mM NaOH, 10 mM Na2EDTA, pH > 13). The DNA was unwound for 40 minutes to make it susceptible to alkalinity, following which electrophoresis was performed at 25 V/300 ± 3 mA for 20 minutes. After electrophoresis, the slide was washed three times in Tris buffer solution (pH 7.4) for 10 minutes each, and then dried. Fluorochrome staining of the cell nuclei was performed using 20 µL/mL of ethidium bromide, and the slide was covered with a cover glass and observed under a fluorescence microscope (Leica, Germany). The images of the cell nuclei acquired from a CCD camera (Hitachi Denshi, Japan) were analyzed by the comet image analyzing system (Komet 5.5, Kinetic Imaging, UK). The level of lymphocyte DNA damage was determined using three markers: 1) tail length (TL), the distance of DNA fragments from the nucleus; 2) percentage DNA in tail (TD); and 3) tail moment (TM), defined by the percentage of DNA in the tail multiplied by the length between the center of the head and tail. Two slides were prepared for each subject, and the level of DNA damage was measured for 50 lymphocytes from each slide, in a total of 100.
Whole blood glutathione level
Whole blood glutathione was measured using a glutathione assay kit (DIGT-250, Bioassay Systems. USA). For this measurement, 120 µL of 20-fold diluted whole blood was treated with 120 µL of reagent A, and the mixture was centrifuged at 14,000 rpm for 5 minutes. Then, 200 µL of supernatant was pipetted into a 96-well plate, and 100 µL of reagent B was added. The reaction was continued at room temperature for 25 minutes, after which the absorbance was read at 412 nm by an ELISA plate reader.
Conjugated diene (CD) of LDL
CD is the first product of lipid peroxidation in plasma. The level of CD in plasma LDL was analyzed by the method of Markku et al. [25]. Briefly, trisodium citrate buffer (pH 5.05, 5N HCl, 5,000 IU/L heparin) was added to plasma (1 mg/mL EDTA) to precipitate the LDL. The LDL was dissolved in Na-phosphate buffer (pH 7.4, 0.9% NaCl), to which we added 3 mL of chloroform: methanol (2:1) and 1 mL of distilled water. The fat-soluble layer was collected and vaporized by using a rotary evaporator. The product was dissolved in 1 mL of cyclohexane, and the absorbance was read at 234 nm by UV/VIS spectrophotometer.
Measurement of plasma oxygen radical absorbance capacity (ORAC)
The antioxidant capacity was measured by peroxyl radical scavenging capacity (ORACROO.) assay [26] using the ORAC. Fluorescein solution (100 µL of 80 nM) dissolved in 75 mM phosphate buffer and 50 µL of sample were pipetted into a 96-well micro-plate (black); 50 µL of 80 mM 2,2′-azobis (2-amidino-propane) dihydrochloride (AAPH) was added to the well and mixed thoroughly. The fluorescence value was measured by at intervals of two minutes using a SpectraMax i3 Microplate Reader (Molecular Devices, Sunnyvale, CA, USA) at 37℃ (excitation wavelength 485 nm, emission wavelength 535 nm). The final result was a difference in the curve area between the absorbance of the sample and the blank. The standard (Trolox) was used to convert the result to Trolox equivalents (TE µM).
Measurement of plasma total nitric oxide (NO)
The total NO concentration of plasma nitrate (NO3) and nitrite (NO2) was measured using an Oxide (total) detection kit (ADI-917-020) (Enzo Life Sciences, New York). Plasma was diluted in reaction buffer at a ratio of 1:4 and then ultrafiltered using a 10,000 MWCO filter (Vivaspin 500, Sartorius Lab instruments, Goettingen, Germany). The filtrate was pipetted into a 96-well plate, and NADH reagent and nitrate reductase enzyme were added and mixed. The plate was incubated at 37℃ for 30 minutes. After the reaction, Griess reagent I followed by Griess reagent II were added to the well, and the plate was placed at room temperature for 10 minutes. The absorbance was read at 550 nm, and the concentration was calculated using the nitrate standard curve.
Statistical analysis
Data were entered into MS Excel and analyzed using the Statistical Package for Social Science (SPSS-PC+, version 20.0). Percentage and mean ± standard error (SE) were calculated. The significance of mean difference before and after intake of kale juice was evaluated using the paired t-test. Statistical significance was defined as a P value ≤ 0.05.
RESULTS
General characteristics
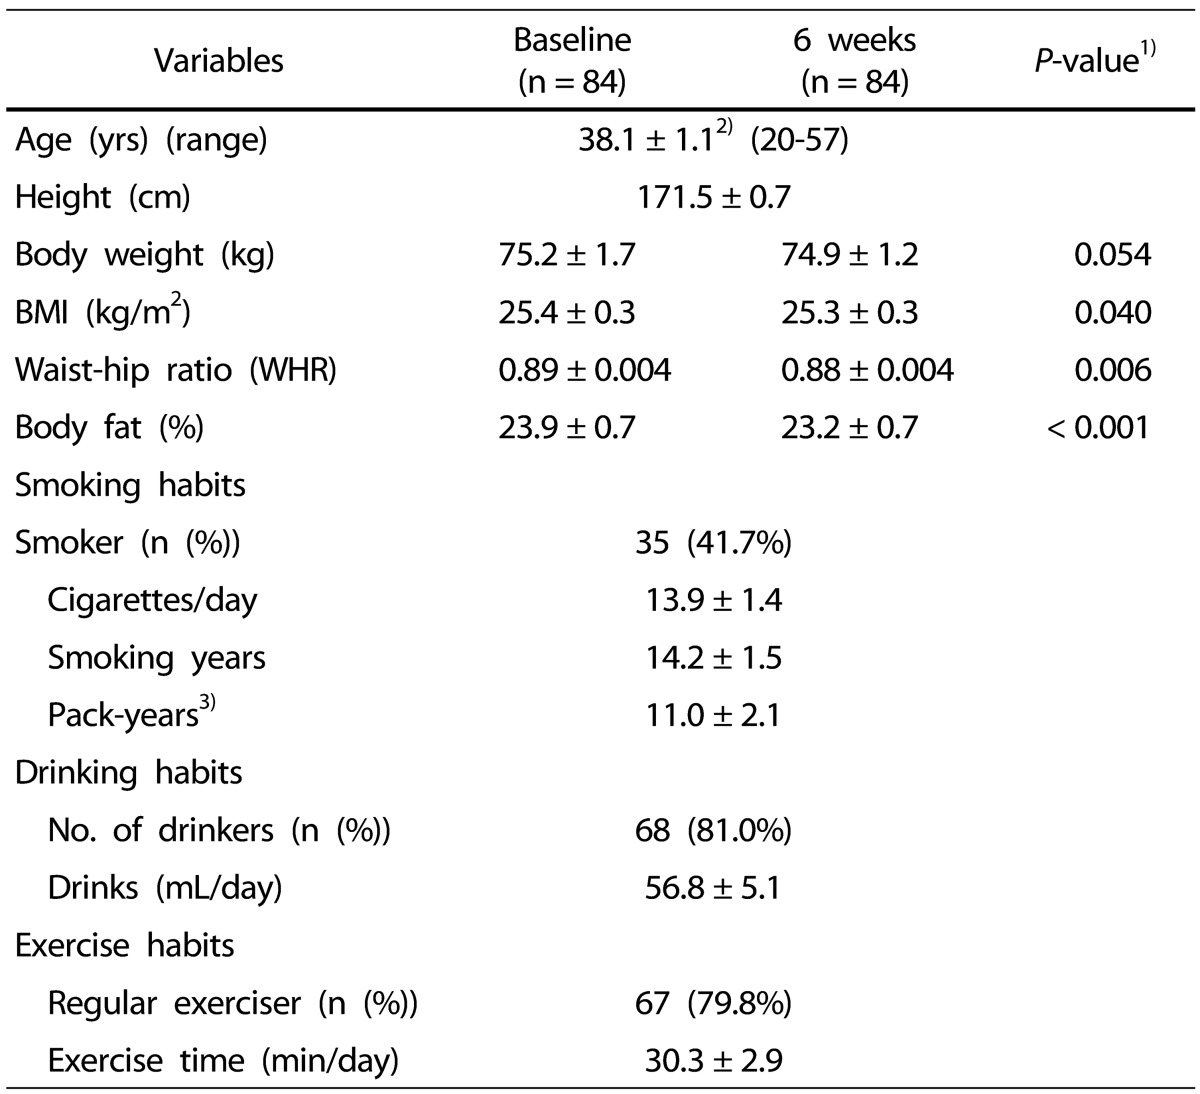
The demographics of the subjects are shown in Table 2. The mean age was 38 years (range, 20 to 57 years). The smoking statistics of the subjects obtained was: smoking rate 41.7%, smoking history 14.2 ± 1.5 years, smoking pack years (based on one pack per day) 11.0 ± 2.1 years, and the daily cigarettes smoked 13.9 ± 1.4. A total of 81% respondents reported drinking, and the mean amount of drinking was 56.8 ± 5.1 mL/day. With regard to exercise habits, 79.8% respondents reported regular exercising, with a mean exercise time reported as 30.3 ± 2.9 min/day. There was no significant difference in weight before and after intake of kale juice, but BMI significantly decreased from 25.4 kg/m2 to 25.3 kg/m2, and WHR decreased from 0.89 to 0.88. In addition, the body fat percentage also significantly decreased from 23.9% to 23.2%.
Frequency of GST genetic polymorphism
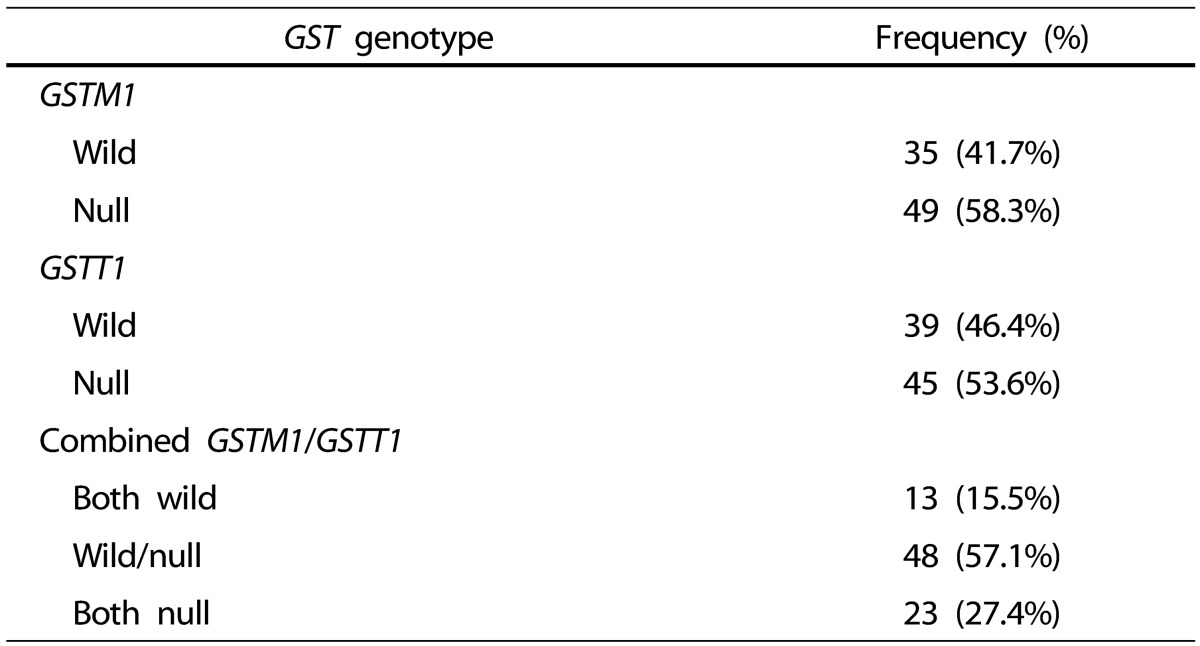
The frequencies of GSTM1 and GSTT1 genetic polymorphisms are presented in Table 3. The proportions of GSTM1 null genotype, GSTM1 wild genotype, GSTT1 null genotype, and GSTT1 wild genotype were 58.3%, 41.7%, 53.6% and 46.4%, respectively. In the GSTM1 and GSTT1 combined genotypes, the proportions of wild/wild genotype, wild/null genotype, and null/null genotype were 15.5%, 57.1% and 27.4%, respectively.
Nutrient intake before and after kale juice consumption
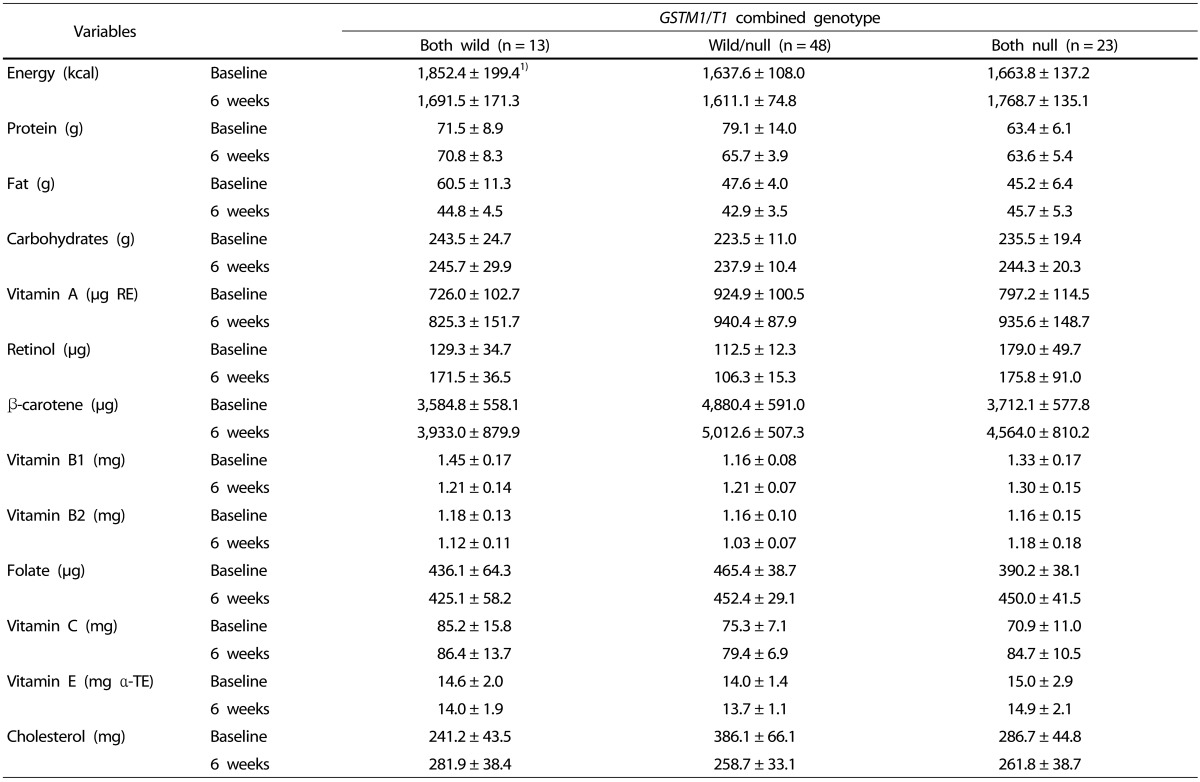
The 24-hour recall method was used to assess changes in dietary intake for the subjects who had consumed the green juice. The intake of nutrients, including antioxidative nutrients, is shown in Table 4. No difference in calories was observed before and after intake of kale juice in the groups based on genetic polymorphism. Similarly, nutrients including vitamins and minerals were also constant. Additionally, there was no significant difference in the nutrient intake in each group defined by genetic polymorphism at baseline and six weeks.
Plasma antioxidant vitamin
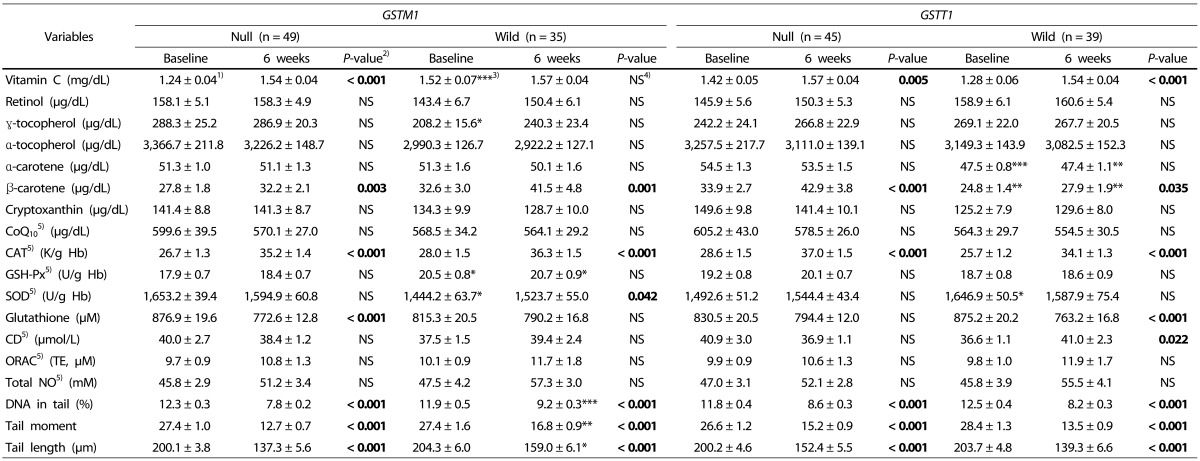
The levels of plasma vitamins before and after intake of kale juice for the hypertensive group are shown in Table 5. The level of vitamin C increased in the GSTM1 null genotype, GSTT1 null genotype, and GSTT1 wild genotype, but remained unchanged in the GSTM1 wild genotype. The level of β-carotene increased in all GSTM1 and GSTT1 genotypes, indicating that there was no difference in the effect of kale juice on this vitamin depending on GST genetic polymorphism. In addition, the levels of retinol, α-tocopherol, γ-tocopherol, α-carotene, cryptoxanthin, and CoQ10 remained unchanged before and after kale juice consumption.
Erythrocyte antioxidant-enzyme activities
The change in activity of red blood cell antioxidant enzymes after intake of kale juice is shown in Table 5. The red blood cell catalase activity was significantly increased in all GSTM1 and GSTT1 genotypes after consumption. The activity of SOD increased only in GSTM1 wild genotype. The activity of GSH-Px remained unchanged in all genotype. Among the three antioxidant enzymes, only SOD showed changes depending on the GST genetic polymorphism.
Oxidative stress-related markers
The concentration of glutathione after intake of kale juice was decreased in the GSTM1 null and GSTT1 wild genotypes. The level of CD, indicating the level of lipid peroxidation, was increased in GSTT1 wild genotype, suggesting that the effect of kale juice differed depending on the GST genetic polymorphism. The indicator of plasma antioxidant capacity, levels of ORAC remained unchanged in all genotypes after the juice consumption. The level of plasma total NO tended to increase, but the difference was not significant.
DNA damage identified by comet assay
The results of DNA in tail (%), tail moment, and tail length (µm) to identify changes in DNA damage after intake of green juice are presented in Table 5. These measures were significantly decreased in the GSTM1 and GSTT1 genotypes. No difference was observed between GSTM1 null genotype and GSTM1 wild genotype before intake of kale juice, but the result was significantly lower in the GSTM1 null genotype than in the wild genotype after consumption. DNA damage decreased in all genotypes, with the effect being highest in the GSTM1 null genotype. These results confirm that the effect on DNA damage differed based on the GST genetic polymorphism.
Oxidative stress-related markers depending on combined genotype
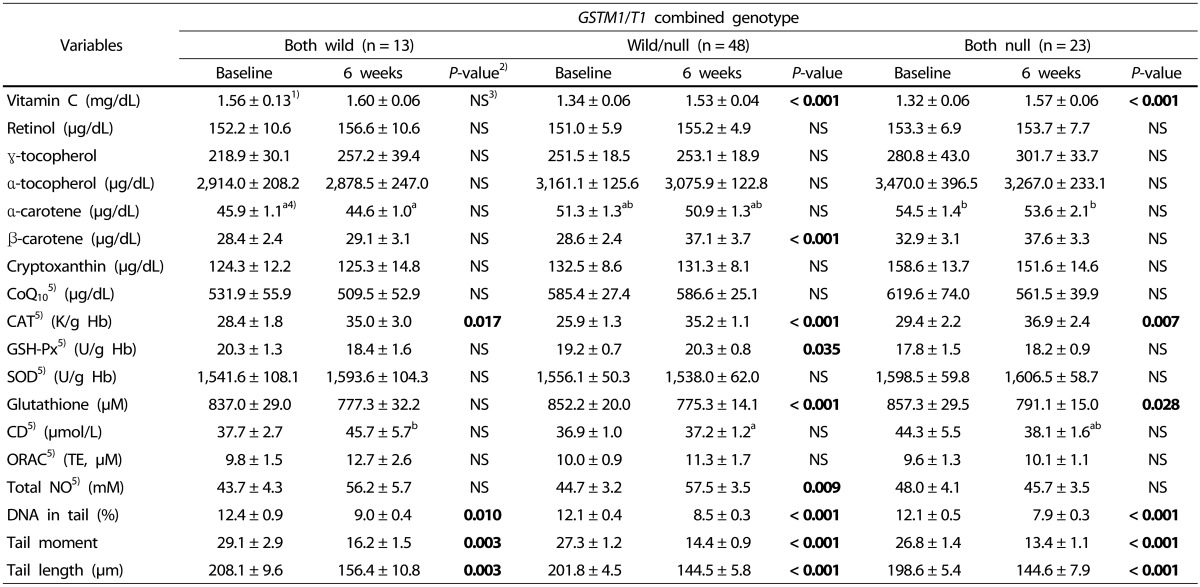
The markers depending on combined genotype are shown in Table 6. Vitamin C was significantly increased in the wild/null genotype and null/null genotype, and β-carotene was significantly increased in the wild/null genotype. Thus, there was a difference in the effect of kale juice between genotypes depending on GST genetic polymorphism. However, the levels of other vitamins did not change before and after intake.
The activity of red blood cell catalase was significantly increased in all genotypes after intake, whereas the activity of GSH-Px significantly increased only in the wild/null genotype. The activity of SOD was not significantly different in all genotypes before and after intake. Among the three antioxidant enzymes, the activity of GSH-Px differed depending on the polymorphism, although no difference was observed in the activity of catalase and SOD between the genotypes.
After consuming the green juice, the indicators of DNA damage (DNA in tail (%), tail moment, and tail length (µm)) were significantly decreased in the three GST combined genotypes. No difference was observed based on the genetic polymorphism.
The markers significantly decreased in the GSH wild/null genotype and null/null genotype, and plasma total NO was significantly increased only in the wild/null genotype. Thus, it was confirmed that there was a difference between GST genotypes. ORAC, indicating plasma antioxidant potential, tended to increase after intake, but the difference was not significant. Since lipid peroxidation indicates the oxidation of plasma LDL, the first product of peroxidation (namely, CD) was measured. The results showed no significant difference among the three genotypes.
DISCUSSION
This study was conducted to investigate changes in improvement in oxidative stress in hypertensive patients based on their GST genetic polymorphism, after intake of kale juice. The subjects were instructed not to change their lifestyle or eating habits dramatically during the six-week consumption of kale juice. Lifestyle, such as exercise, drinking, and smoking, did not change over the 6 weeks study period, and nutrient intake, including antioxidant vitamins, was not significantly different and was found to be similar both before and after intake of kale juice.
After kale juice supplementation, the BMI, WHR, body fat percentage, and blood pressure were significantly decreased [27]. In the previous study of Tominaga et al. [28], overweight subjects were given licorice flavonoid oil (LFO) for eight weeks, and three groups taking different doses showed reduction of body fat. It was suggested that LFO down-regulated the fatty acid synthesis genes, whereas it up-regulated enoyl-CoA hydratase and 3-hydroxyacyl-CoA dehydrogenase genes, which are catalysts in β-oxidation [29]. In addition, intake of LFO increased the acyl CoA dehydrogenase and the reaction rate of fatty acid oxidation, and decreased the acetyl-CoA carboxylase and fatty acid synthesis [30]. LFO has also been shown to improve β-oxidation and inhibit lipid synthesis to increase energy consumption and reduce body fat [28]. Thus, we thought that the flavonoids (possibly caffeoyl glucose and hydroxycinnamic acid sinapine) in kale could decrease the body fat through a similar mechanism. However, more studies are required on kale juice and fat cells to identify the specific mechanism.
With regard to the frequency of GST genetic polymorphism in 84 borderline hypertensive patients, the proportions of GSTM1 null genotype and GSTT1 null genotype were 58.3% and 53.6%, respectively. In a study on the association between hypertension and blood lead level in Korean workers [31], the proportions of GSTM1 null genotype and GSTT1 null genotype were 62.4% and 61.2%, respectively. Thus, it was confirmed that the frequencies of GSTM1 and GSTT1 null genotypes were higher than those of GSTM1 and GSTT1 wild genotypes in the hypertensive group. However, in an Emirates study on the association between hypertension and GSTM1 and GSTT1 polymorphism [32], the proportions of GSTM1 mutant genotype, GSTT1 mutant genotype, and GSTM1/GSTT1 double mutant were 60%, 30%, and 5%, respectively, which differed from the previous study results. It was therefore proposed that difference in hypertensive patients could be dependent on the race.
Antioxidant vitamins are important to the antioxidation system and need to be obtained from fruits and vegetables to protect cells from oxidative stress. In the present study, plasma vitamin C was significantly increased in the GSTM1 null genotype, GSTT1 null genotype, and GSTT1 wild genotype after intake of kale juice, and plasma β-carotene was increased in all the GSTM1 and GSTT1 genotypes. The levels of retinol, α-tocopherol, γ-tocopherol, α-carotene, cryptoxanthin, and CoQ10 did not change before and after consumption. In the study of Polidori et al. [33], the subjects were recommended to eat at least 400 g of fruits and vegetables every day for three months, and their plasma lycopene, α-carotene, β-carotene, retinol, α-tocopherol, and vitamin C were significantly increased, which is partially similar to our results. However, in another previous study, the plasma vitamin C and E did not change after intake of tomato for three weeks [34]. The results of studies on changes in plasma vitamins after intake of antioxidative food or antioxidant supplements are varied, possibly because of the type of foods tested and seasonal factors that could affect the results.
The antioxidation system is composed of antioxidant enzymes and antioxidant substances. Enzymatic antioxidation is induced by SOD, CAT, and GSH-Px. When the body is exposed to ROS, there is an increased expression of antioxidant enzymes [35]. After intake of kale juice for six weeks, the activity of red blood cell catalase significantly increased in all genotypes, SOD activity increased only in the GSTM1 wild genotype, whereas GSH-Px activity did not change in any genotype. Previous studies have reported that the activity of GSH-Px was significantly increased in subjects with hypercholesterolemia after intake of kale juice for 12 weeks [7]; another study reported increased activities of SOD and GSH-Px, whereas catalase remained unchanged in healthy adults who ingested parsley for two weeks [36]. In the study of Hofmann et al. [37], healthy adults who ate watercress for eight weeks showed increased SOD activity only in the GSTM1 null genotype, which is different from our result. Although there are numerous elucidations regarding the activity of antioxidant enzymes, the most common explanation is homeostasis control [38]. Thus, it is not sufficient to evaluate oxidative stress by simply measuring antioxidant enzymes.
DNA is damaged when free radicals are excessively increased in the body. The results of the comet assay to identify lymphocyte DNA damage caused by oxygen radicals showed that DNA damage was significantly decreased in all genotypes after intake of kale juice for six weeks, and the reduction was higher in the GSTM1 null genotype than that in the wild genotype. However, Wilms et al. [12] reported that protection from DNA damage was better in the GSTT1 wild genotype than in the mutant genotypes after intake of blueberry/apple juice for four weeks. In addition, in smokers who drank caffeine-free green tea for four months, the level of DNA damage (measured by 8-OHdG) was higher in subjects with GSTT1 and GSTM1 wild genotypes than in subjects with GSTT1 and GSTM1 mutant genotypes [14]. In our study, the reduction of DNA damage was greater in subjects with GSTM1 null genotype after consuming kale juice.
The concentration of GSH used in antioxidation through oxidation-reduction reactions was significantly decreased in the mutant genotype [39]. In one previous study, the intake of cranberry juice for two weeks reduced the GSH, but the difference was not significant. When toxic substances enter the body, GST enzymes are induced for detoxification, with a subsequent increase in the level of intracellular GSH. NO, which is formed from L-arginine by NO synthetase, is important for vasorelaxation and antithrombotic, anti-inflammatory, and antimicrobial effects in the body. However, the level of NO did not change in any genotypes before and after intake of kale juice. ORAC, indicating the total antioxidant capacity of plasma antioxidants, also remained unchanged in all genotypes. In a previous study where healthy adults drank blueberry/apple juice for four weeks [12], TEAC, which indicates the antioxidant capacity, significantly increased in the GSTT1 mutant genotype. The level of CD formed by oxidation of LDL cholesterol was increased in the GSTT1 wild genotype after intake of kale juice. In the study of Nadeem et al. [40], the oxidation of HDL cholesterol increased after intake of α-tocopherol and γ-tocopherol. In another study, the level of CD did not change after intake of nuts [41].
Regarding the effect of kale juice based on the GST genetic polymorphism, plasma vitamin C was significantly increased in the wild/null genotype and null/null genotype, whereas the plasma β-carotene was significantly increased only in the wild/null genotype. In addition, retinol, α-tocopherol, γ-tocopherol, α-carotene, cryptoxanthin, and CoQ10 were unchanged before and after intake. In the study of Yuan et al. [42], vitamin C tended to increase in the wild/wild genotype and null/null genotype after intake of fruit juice and vegetables for two weeks, but the difference was not significant. In addition, retinol, α-tocopherol, and γ-tocopherol also remained constant, which is partially similar to our result. There was a difference in the level of vitamin C at baseline depending on the genetic polymorphism, with the highest level noted in the wild/wild genotype. However, vitamin C increased in the wild/null genotype and null/null genotype over six weeks, to a level comparable to that in the wild/wild genotype. Thus, it was thought that vitamin C in the wild/wild genotype was sufficient at baseline, and increased to meet the requirement in the other two genotypes after six weeks of kale juice ingestion.
After intake of kale juice for six weeks, the catalase level in red blood cell antioxidant enzymes significantly increased in all genotypes. In the study of Yuan et al. [42] that compared the wild/wild genotype and null/null genotype, the activity of catalase significantly increased at one week and two weeks, respectively, compared to baseline after intake of vegetables and fruits, which is comparable to our result. The activity of GST-Px significantly increased only in the wild/null genotype. The activity of SOD did not change significantly in any genotype in our study. In the study of L. Yuan et al. [42], there was no difference in the activity of SOD in the two groups after a two-week intake, while the activity of GSH-Px significantly increased in both groups, which is partially similar to our results. Among the three antioxidant enzymes of red blood cells we measured in the current study, catalase and GSH-Px increased only in the wild/null genotype. Although the elevated activity might have been caused by ROS, it was increased after intake of vegetables or fruits in several previous studies, suggesting that kale juice improves the antioxidation system.
Results of the comet assay to identify lymphocyte DNA damage caused by oxygen radicals revealed that the DNA damage significantly decreased in all genotypes after intake of kale juice for six weeks, and the change was not different between genotypes. In the study of L. Yuan et al. [42], the level of DNA damage was determined by measuring urine 8-OH-dG, and no significant difference was observed in DNA damage between the wild/wild genotype and null/null genotype after intake of fruit juice and vegetables, which is different from our observations. This difference might be because the period of intake was short, and healthy young adults were selected in the previous study. After intake of blueberry/apple juice for four weeks, the decrease in DNA damage was considerably greater in the T1 wild genotype compared to the null genotype, suggesting varying effects depending on genetic polymorphism [13]. In our results, the effect was observed in all genotypes regardless of GST genetic polymorphism. This might be because compared to other foods, kale is more efficient in inhibiting DNA damage. However, more studies are required to verify this conclusion.
The concentration of GSH used in antioxidation for the oxidation-reduction reactions was significantly decreased in the wild/null genotype and null/null genotype. In a previous study, GSH tended to decrease after intake of cranberry juice for two weeks, but was significantly not different. When carcinogens enter the body, GST binds to glutathione. Kale juice might accelerate the activation of GST, resulting in reduction of GSH. However, more evidence is required to verify this. NO is derived from L-arginine by NO synthetase, and is important for vasodilation and antithrombotic, anti-inflammatory, and antimicrobial effects in the body. Although the level of NO increased in both the wild/null and wild/wild genotypes after intake of kale juice, the increase was significant only in the former group. In the study of hypertensive patients by Taddei et al. [43] , vitamin C partially restored the activity of the L-arginine-NO pathway to improve endothelial cell-dependent vasodilation. This might explain why both vitamin C and NO were increased in the wild/null genotype in the present study.
ORAC indicates the total antioxidant capacity of plasma antioxidant, and the levels remained constant before and after intake of kale juice. The level of CD formed by oxidation of LDL cholesterol by peroxides of fat oxidation also did not change before and after intake. In the study of L. Yuan et al. [42], the plasma total antioxidant capacity (TAOC) increased only in the wild/wild genotype after intake of fruit juice and vegetables, whereas MDA decreased in the null/null genotype and wild/wild genotype, which is different from our result. The difference might be because the subjects in the present study were supplemented with a single type of food compared to multiple foods.
In addition, further analysis showed (data not shown) that the improvement effect of antioxidant levels after kale juice ingestion was different according to the GST polymorphism. First of all, improvement in DNA damage was greater in the GSTM1 null genotype than in the wild genotype (P = 0.021). There was no significant difference among the three groups in null genotypes. Second, CD level improvement was greater in the GSTT1 null genotype than in the wild genotype (P = 0.018), and both null genotypes were significantly higher in both groups compared to both wild genotypes (P = 0.039).
From the above results obtained, we found that the degree of improvement of antioxidant status varied according to genetic polymorphism, and the effect of null genotype tended to be higher. However, since the degree of improvement in the combined null genotypes was not significantly different from that of the individual null genotype, we were unable to see any synergistic effects of GSTM1 and GSTT1.
The results of the present study showed that decrease in levels of DNA damage and increase in vitamin C was better in the GSTM1 null genotype. In the wild/null type, we observed improvements in levels of vitamin C and β-carotene. Thus, this study confirmed that the changes in antioxidative markers due to intake of kale juice differed based on the GST genetic polymorphism. These markers will be important to use as baseline data, to develop personalized nutritional prescriptions based on various personal genetics. While the strengths of this study include the recruitment of participants based on GSTM1 and GSTT1 genotype and the 6-week duration of kale juice supplementation, the limitation of the study is that there was no placebo group to compare with, although the purpose of this study was to observe the effect of kale juice with respect to different GSTM1 and/or GSTT1 genotypes. The authors have already proven that green vegetable juice (Angelica keiskei) has a beneficial effect as compared to placebo [44]. Another potential limitation is the modest sample size, which limited our power to further stratify the data by GST genotype and other possibly confounding factors, although significant changes were detected after supplementation. Thus, the results of this study need to be confirmed by a larger-scaled, controlled study in the future.
 XML Download