

 PDF
PDF ePub
ePub Citation
 Print
Print


INTRODUCTION
Socio-economic and lifestyle factors are dominant determinants of modern dietary behaviors [12]. Changes such as economic growth, female participation in the workforce outside home, single-member households, 5-day workweek, and time constraints have made eating out, take-out, and packing meals prepared at home a common lifestyle globally [3]. These changes have generated two opposite trends. First, a culture of bringing packed meals from home due to health concerns has recently developed [4]. Second, cooking at home has decreased while dependence on convenience foods, fast foods, and other foods prepared outside home has increased [5].
Many studies have examined the relationship between eating out and nutritional quality according to these lifestyle changes [678]. Findings from previous studies suggest that individuals who eat meals at home are more likely to have a high-quality diet compared with those who eat meals outside home [9]. In contrast, consumption of meals outside home is considered a risk factor for incidence of chronic diseases such as obesity and diabetes in addition to nutritional imbalance [1011].
Although various studies have examined the relationship between eating out and nutritional status, there are major limitations. There is no consensus on the definition of eating out, as meals can be prepared and consumed at different locations. The effect of eating out on diet quality can vary depending on how eating out is classified (where meal is prepared vs. where meal is consumed). The difference in the definition of eating out can provide inconclusive results regarding the relationship between eating out and diet quality [612]. Thus, defining concepts of eating out is a top priority to determine the effect of eating out on diet quality. However, since even home-made meals are composed of foods that come from outside sources, it is difficult to separate eating out from eating in [7]. Criteria for eating out and eating in should consider 'where meal is prepared/obtained' or 'where meal is consumed/eaten'.
Many researchers in the US and European countries have focused on differences in diet quality according to meal preparation/purchase location rather than eating location. In a previous study on adolescents aged 13-18 years, consumption of foods obtained from outside home, such as fast-food outlets or restaurants, was more likely to have higher energy intake and be of lower diet quality [7]. Powell and Nguyen reported that meals prepared outside home tend to be more problematic in terms of nutrient intake compared to meals consumed at home [6]. Various studies also demonstrated how food source or food purchase location is associated with daily energy and nutrient intakes. They reported that food prepared away from home is a major contributor to increased energy intake from fat as well as lowered micronutrient intakes [1314] and dietary diversity [15]. However, to date, studies on nutritional value and daily food consumption patterns while eating out and eating in among the Korean population are limited, as they are confined to one meal per day, such as breakfast or lunch. In additions, few studies in this area have elucidated the most consumed dish among Koreans according to meal preparation location and factors affecting eating out behavior and the resulting nutritional status considering socio-demographics [16].
To fill gaps in the literature, we attempted to explore the complex effects of eating out on diet quality by focusing on location of meal preparation. A single food type can be different types of dishes depending on the location where it was obtained. For instance, though vegetables and fruits are healthy foods, they are generally served with a buttery or salty sauce or with dressing when consumed outside the home. In other words, how and where certain meals are prepared may have an effect on nutrient intake and diet quality. Considering that more than one-third of the Korean population consumes a non-homemade meal once a day [17], it is necessary to separate eating out from eating in according to location of meal preparation and explore differences in dish consumption pattern and diet quality. Furthermore, the effects of socio-demographic characteristics on diet quality need to be examined rather than assessing nutritional effects of eating out and eating in for the total population.
The purpose of this study was to determine the effects of meal preparation location on diet quality within the context of total daily intake. We aimed to identify socio-demographic characteristics of those who consumed meals prepared outside in a single day in order to describe Korean adults' patterns of dish consumption and assess dietary adequacy and diversity according to meal preparation location, which has not been studied in the previous literature. The present study can provide important insights into the effect of meal preparation location in terms of nutritional quality and dietary diversity.
SUBJECTS AND METHODS
Data source and study population
The Korean National Health and Nutrition Examination Survey (KNHANES) is conducted by the Korea Centers for Disease Control and Prevention (KCDC) to identify present situations and trends in Korean health and nutritional status. Beginning in 1998, the KNHANES is an ongoing survey conducted continuously every year since 2007 (the first year of the fourth wave) [1819]. The KNHANES follows a multi-stage clustered sampling design targeted for non-institutionalized Korean citizens who live in Korea and consists of three surveys: health interview, health examination, and nutrition survey [20]. This cross-sectional study used data on meal preparation location and 24-h dietary intake from the KNHANES 2007-2009. We excluded those who were younger than 20 years of age, with < 500 or > 5,000 kcal/day of total energy intake, had incomplete information on 24-h dietary recall and location of meal preparation, and were pregnant and lactating women for a final analytic sample size of 4,915.
Dish groupings
The KNHANES collected information on types and amounts of foods and dishes consumed during the previous day using the 24-h dietary recall method. All dishes consumed by subjects were assigned a 5-digit dish identification code. We used dish codes from the KNHANES 2007-2009 to determine the most consumed dishes based on a single 24-h dietary recall. However, dish codes from the KNHANES were over-segmented. To compensate for these weak points, we used the second- and third-digit code from the KNHANES [19]. The second- and third-digits in the dish code identify one of the 23 major dish groups. Based on the KNHANES coding scheme and previous studies [21,22,23], all dish items were aggregated into 47 specific groups on the basis of the main ingredient (i.e., vegetables, meat, and seafood) and cooking methods (i.e., steaming, boiling, grilling, frying, etc.).
Definition of meal preparation location
The definition of eating out is a still controversial issue, as mentioned above. The location where the meal is prepared or consumed may be equally classified as eating out or eating in by an individual researcher. In the case of eating take-out or delivery at home, the location where the meal is consumed is home while nutritional characteristics of the consumed meal resemble a non-home-made meal. On the other hand, in the case of a home-made packed meal consumed outside home, nutritional characteristics of the meal are akin to that of a home-made meal. Therefore, this study focused on nutritional characteristics of meals rather than the effect of eating location in order to separate home-made meals from non-home-made meals in terms of preparation.
Starting from 1998, the KNHANES has accumulated information on meal preparation/purchase location (variable: N_MTYPE) of all dishes consumed by participants [19]. Thus, it is possible to determine where all dishes were obtained. We classified each dish item consumed by an individual into two categories according to meal preparation based on a previous study [24]: meal prepared at home (home-made meal; HM) and outside home (non-home-made meal; NHM) (Table 1). HMs included meals packed at home and prepared at a neighbor or relative's house. NHMs were mainly obtained from outside home at quick-service restaurants, including delivery and take-out, full-service restaurants such as Korean, Chinese, Western, or Japanese restaurants, fast-food outlets, street food or snack restaurants, instant and ready-to-eat foods (e.g., instant ramen), and other types of eating out, including institutional cafeteria food. In the present study, as only a few people consumed meals from institutional cafeterias such as the workplace and schools, we classified meals from commercial and institutional places into NHMs.
After dividing each dish item into HMs and NHMs, we classified subjects into two groups: home-made meal group (HMG) and non-home-made meal group (NHMG). Based on the fact that most Koreans consume three meals (breakfast, lunch, and dinner) per day [2526], we can determine the major source of meal preparation during the entire day based on the frequency of consuming meals prepared at home or obtained from outside home. In this study, the HMG included those who consumed more than two meals a day prepared at home while the NHMG included individuals who consumed more than two meals a day obtained outside home. People who missed more than two meals a day were determined as not having sufficient nutrient intake and were excluded from the present analyses.
Socio-demographic characteristics of subjects
We included socio-demographic variables affecting individuals' eating out behavior. All subjects were divided according to socio-demographic status of interest: sex (men and women), age (20-29, 39-49, and 50-64 years of age), income (income was calculated based on total household income of residents and then divided into quartiles from poorest to wealthiest; low, mid-low, mid-high, and high) [19], education (elementary school graduates, middle or high school graduates, and college graduate or above), marital status (married and single including divorced, widowed, or never-married), occupation (employed including self-employed and unemployed), body mass index (BMI; kg/m2) (calculated as weight [kg] divided by squared height [m]; underweight, < 18.5; normal, 18.5 to < 23; overweight, 23 to < 25; and obese, ≥ 25) [2728].
Dietary assessment
We used the 24-h dietary recall information on food intake to assess the nutritional status of study participants by meal preparation place (HMG vs. NHMG). In the current study, 24-h dietary energy, ratio of energy intake from each macronutrient (e.g., carbohydrate, protein, and fat; C:P:F ratio), and the amounts of selected micronutrient intakes were assessed for sex and each age group. The cutoff used to assess compliance individual's relative intake levels of micronutrients (e.g., dietary fiber, calcium, iron, sodium, and vitamins) was recommendations from the Dietary Reference Intakes for Koreans (KDRIs) [29]. Calcium, phosphorus, iron, vitamin A, vitamin B1, vitamin B2, vitamin C, and niacin levels were calculated based on the recommended nutrient intakes. Intake ratio of sodium and potassium was calculated based on adequate intake, whereas that of dietary fiber was calculated based on absolute intake since crude fiber content was used. Micronutrients were presented as the percentage of KDRIs.
We used both Dietary Variety Score (DVS) and Diet Diversity Score (DDS) to measure dietary diversity to gain a more detailed understanding of whether or not the HMG and NHMG showed changes in diet quality. Previous studies already showed that the DVS and DDS can reflect Korean adults' overall diet quality and are linked to their nutritional and health status [3031]. The DVS was calculated using the sum of the total number of different food groups consumed the previous day. However, there is currently no consensus on food grouping to calculate this score [32]. Some food items cooked by different cooking methods were classified in the same food group, resulting in a total of 17 food groups (i.e., cereals, potato and starches, sugars and sweeteners, pulses, nuts and seeds, vegetables, fungi and mushrooms, fruits, meats, eggs, fish and shellfishes, seaweeds, milks, oils and fat, beverages, seasoning, and others) for this study based on previous literature [3334]. All foods consumed by each subject over the 24-h dietary recall period were classified and calculated for the DVS. Seasonings and alcoholic beverages were excluded from the DVS calculation. We also used the DDS developed by Kant et al. [3536]. Every single food consumed in a single day was divided into five food groups (i.e., cereals-grains, meats, fruits, vegetables, and dairy products) and was then summed. Whenever a consumed food group was added, 1 point was given with the range of 5 (highest) to 0 (lowest) points. To prevent getting scores for intake of a small quantity in the DDS calculation, a minimum intake criterion from previous studies was set by each food group [2337]. Scores were not given for an intake lower than the criterion.
Statistical analyses
All data were analyzed using the SAS (version 9.3, SAS Institute Inc, Cary, NC, USA). The KNHANES data were collected by multi-stage stratified probability sampling instead of simple random sampling. We included weight, stratifying variables (KSTRATA), and the primary sampling unit (PSU) suggested by the KCDC and used the SURVEY procedure to account for the KNHANES complex sampling scheme [1920]. We calculated the average intake amount of each dish and determined the top 20 most consumed dish items (listed from highest to lowest) to describe the meal consumption pattern of Korean adults by meal preparation location, sex, and age group. The Wald chisquare test and multiple linear regression were used to estimate the association between meal preparation location and sociodemographic characteristics. General characteristics of subjects were represented as frequency and weighted percentage using the SURVEYFREQ procedure. To achieve our objectives, SURVEYREG procedure was used to compare differences between means of total energy intake, nutrient intake, and diet variety by meal preparation location. P-values < 0.05 were considered as statistically significant.
RESULTS
General characteristics of subjects
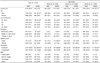
The socio-demographic characteristics of study subjects overall and by meal preparation location and age group are presented in Table 2. On the whole, among Korean adults aged 20-64 years in the KNHANES 2007-2009, 80.3% (n = 4,146) were in the HMG while 19.7% (n = 769) were in the NHMG. No differences were reported between overall BMI categories. However, differences between the HMG and NHMG by age, sex, income, education level, marital status, and occupation were significant (P < 0.01). When stratified by age, the younger adult group (20-29 years) constituted the highest proportion of those in the NHMG, whereas those 50-64 years of age formed the greatest proportion of the HMG. Those 30-49 years and 50-64 years of age comprised 78.2% and 92.0% of the HMG, respectively, which were much higher than those in the NHMG. In contrast, for younger adults, the difference between the two groups was relatively smaller (HMG; 66.2% vs. NHMG; 33.8%).
Dish consumption patterns by meal preparation location, sex, and age
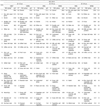
Table 3 and Table 4 list the most consumed dish items according to meal preparation location. Overall, most often consumed dishes per day varied by meal preparation location, sex, and age group. The HMG consumed more dishes consisting of grains, including white rice and rice with mixed grains, compared with the NHMG. Both men and women in the NHMG consumed more meat but fewer vegetables compared to the HMG. The HMG primarily consumed meat in stews or steamedmeat, whereas the NHMG used various other cooking methods such as grilling, deep-frying, and stir-frying for meat as well as boiling and steaming.
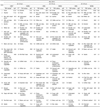
Dish consumption patterns according to sex showed that men in the HMG consumed a wider variety of vegetable dishes, such as stews and casseroles, soups, raw vegetables including salads and lettuce wrap, and steamed and seasoned vegetables. If examined based on intake amounts, men from the NHMG consumed approximately 3-fold more alcoholic beverages and 2-fold more grilled meat (e.g., samgyeopsal, grilled pork belly meat) compared to those in the HMG, although there was no significant difference in ranking. In particular, men aged 30-49 years in the NHMG group consumed more one-dish meals than those in the HMG, who consumed rice, soups, and other side dishes separately. One-dish meals most often consumed by the NHMG included bibimbap (rice mixed with vegetables, sliced beef, and gochujang), rice topped with meats or vegetables, noodles (e.g., ramen, udon, jajangmyeon, and Korean style noodle dishes), and dumplings (Table 3). Women in the NHMG consumed carbonated drinks as well as coffee and tea about 5.7-fold and 2.7-fold more often, respectively, than those in the HMG. Women aged 20-29 years in the NHMG consumed more noodles and bakeries than those in the HMG. The older adult group (50-64 years) showed a different consumption pattern from their counterparts. Even when eating NHMs, this age group consumed more Korean foods than other foods, with high consumption of rice. The most consumed dishes in the NHMG at this age consisted of more diverse items, including rice, soups, kimchi, steamed and seasoned vegetables, grilled meat, and dairy products. In terms of milk and dairy products, women in the NHMG consumed approximately twice as much compared to those in the HMG with no significant difference in ranking. On the contrary, women 50-64 years of age in the HMG showed a monotonous meal pattern consisting of rice, soups, and kimchi (Table 4).
Comparison of nutrient intakes between HMG and NHMG
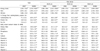
Energy intakes and nutritional status of the HMG and the NHMG are shown in Table 5. The HMG consumed significantly lower energy intake than the NHMG (1,776 vs. 2,116 kcal/day, P < 0.01). There was no significant difference in energy intake among women in both groups, whereas men in the HMG consumed significantly lower energy intake than those in the NHMG (P < 0.01). The NHMG also consumed a lower percentage of carbohydrates and higher percentage of protein and fat compared to the HMG (all, P < 0.01). The NHMG consumed 60.0%, 23.2%, and 16.5% carbohydrates, protein, and fat, respectively. However, the HMG consumed 71.3%, 14.0%, and 13.9% carbohydrates, protein, and fat, respectively. Relative nutrient intakes were similar for both the NHMG and HMG. Compared to the HMG, the NHMG consumed significantly less dietary fiber than recommended values but adequate amounts of calcium, potassium, and vitamin B2 (all, P < 0.01). Both groups consumed more phosphorus, iron, and vitamin B1 than recommended values by KDRIs, particularly in the NHMG. There was no difference in the relative intakes of vitamins A and C. Two micronutrients, dietary fiber (HMG, 35.5%; NHMG, 29.0%) and calcium (HMG, 67.2%; NHMG, 74.5%), were consumed in far less amounts than their recommended values.
Variety in consumption of foods from HMs and NHMs
To investigate diet quality of meals prepared at home and outside home, dietary diversity was compared between the HMG and NHMG (Table 6). For the DVS, the NHMG showed a significantly higher score than the HMG overall in each age or sex group (all, P < 0.01). The DVS was highest in men aged 20-29 years in the NHMG at 12.0 and lowest in men aged 50-64 years in the HMG at 9.3. The DDS was significantly different for men aged 50-64 years between the HMG and NHMG overall (all, P < 0.01). The mean DDS of the HMG was 3.6, whereas it was 3.7 in the NHMG, indicating that most consumed an average of at least three of the five basic food groups each day. The NHMG showed a higher score than the HMG, although no statistically significant differences in DDS between the HMG and NHMG were observed. Comparison of the DVS and DDS showed that the NHMG generally consumed a greater diversity of food items than the HMG.
DISCUSSION
The present study provides a more precise picture of how meal preparation location affects diet quality in Korean adults aged 20-65 years who participated in the KNHANES 2007-2009. We defined eating out by the location of meal preparation, not location of meal consumption. Based on this definition, this study determined the relationship between eating out and diet quality and examined whether or not this relationship varies by socio-economic factors.
We found that the NHMG tended to be men, single, educated, occupied, and of higher economic status. The distributions of the HMG and NHMG were similar to results of previous studies, showing that younger subjects consumed NHMs at higher frequency compared to older individuals [1638]. The proportion of married individuals was higher in the HMG compared to the NHMG, and this observation may be attributable to their choice of eating meals at home regularly with family compared with non-married individuals [139]. However, this study showed a higher proportion of high-income people in the NHMG, which is in contrast to previous studies [940]. The findings of this study may be explained by differences in marginal time and money between low-income and high-income groups. Consumption of HMs is necessarily accompanied by cooking and sometimes may be a forced option due to economic or time constraints. Compared with the HMG, the NHMG tended to have higher income and employment status. This result shows that meal preparation at home is a forced option for the low-income group due to financial constraints, whereas but eating in is limited because of time constraints for households having many working members [19].
We observed significant differences in dish consumption patterns based meal preparation location overall or based on sex and age group. The contribution of the top 5 dish items were fruits, rice with mixed grains, kimchi, white rice, and alcohol in the HMG. However, alcohol, fruits, noodles and dumplings, white rice, and kimchi were ranked by the NHMG as the most highly consumed dish items. As rice was ranked as the most consumed dish item for both HMG and NHMG, rice plays an important role in the Korean diet and is a significant source of energy and nutrient intake [2141]. The HMG consumed a wide range of vegetable dishes, including steamed and seasoned vegetables, vinegar-based vegetable salad, or kimchi, which are the most common forms of vegetable consumption in Korea [42]. Men in the HMG consumed vegetables in the form of kimchi, steamed and marinated vegetables, and raw vegetables from lettuce wraps, whereas the NHMG consumed vegetables primarily in the form of kimchi at a 60% level compared to the HMG. Both HMG and NHMG frequently consumed alcoholic beverages and grilled meat such as grilled pork belly meat, although the average amounts of alcoholic beverage and grilled meat consumption in the NHMG were 3- and 2-fold higher, respectively. These results are consistent with prior research indicating that men from the KNHANES 2007 frequently consumed soju (a Korean distilled rice liquor) and pork belly meat [17]. Men in the older adult group from the NHMG consumed large amounts of alcoholic beverages and meat, similar to trends in other groups, resulting in increased risk for cardiovascular disease [43]. Therefore, caution is needed when consuming alcoholic beverages and meat during meals.
Total daily energy intake was significantly lower in the HMG, and energy intake from protein and fat was significantly higher in the NHMG. When stratified by age, the younger adult group in the HMG consumed relatively lower amounts of meat, deep-fried dishes, and meals obtained from snack restaurants, resulting in a relatively lower proportion of energy intake from protein and fat. On the other hand, those from the NHMG highly consumed meat-based dishes. In addition, consumption of fried or grilled dishes was more common than steaming or boiling, possibly increasing the proportion of energy intake from protein and fat. Consistent with a previous work [44], diets of those aged 50-64 years in the HMG mainly consisted of rice, kimchi, and soups with a high proportion of energy intake from carbohydrates (74.2%), which was much higher compared to other groups. This result may be attributable to frequent consumption of rice and noodles. NHMG consumed a wider variety of food items, leading to balanced intake of energy from carbohydrates, protein, and fat.
Both HMG and NHMG showed significantly different relative nutrient intakes, with the exception of vitamins A and C. Both groups consumed three times more sodium daily than that recommended by KDRIs (≤ 2,000 mg), and this may be related to frequent consumption of high sodium-content kimchi and soups [45]. Sodium intake in the NHMG was 4-fold higher than recommended guidelines, similar to the results of a previous study [46]. Potassium intake may compensate for sodium overconsumption [4748], particularly in the NHMG consuming less fruits and vegetables. It is therefore important to encourage fruit and vegetable consumption in the NHMG. Consistent with previous studies [242], both groups were deficient in dietary fiber and calcium intakes. Insufficient intake of calcium often occurs in cultures and countries where grains are the staple food and fruits or dairy are quite rare [49]. Fortunately, the 50-64 year age group in the NHMG showed a similar calcium intake to recommended guidelines, possibly attributable to their greater consumption of milk and dairy products, compared to those in the HMG. Since milk and dairy products, which are major food sources of calcium intake, are more accessible when eating meals obtained outside home, individuals aged 50-64 years in the HMG should be encouraged to consume calciumrich foods such as dairy products and mushrooms.
Although we assessed meal consumption and nutritional status for the entire day according to meal preparation location, the present study has several limitations. First, the KNHANES data used in this study are cross-sectional data and cannot be sure of a causal relationship between meal preparation location and diet quality. Second, the coding system for meal preparation location in the KNHANES may be ambiguous. It is impossible to clearly identify whether or not a dish is fully cooked starting with fresh ingredients or merely warmed such as ready-to-cook or ready-to-eat in the case of HMs based on information from the KNHANES. Finally, the definitions of eating out and eating remain ambiguous. This study selected meal preparation location as a criterion for separating eating out from eating in and used the terms HM and NHM instead of eating out and eating in. However, different results may be derived based on how researchers define what eating out is.
Despite these limitations, this is the first-ever demonstration that meal preparation location contributes to diet quality using nationally representative large datasets of Korean adults. Furthermore, the KNHANES used for this study has the best data available to understand dish consumption patterns and nutritional adequacy according to Koreans' meal preparation location. This study is unique in that it examined consumed dish items according to meal preparation location for an entire day at the population level. Unlike previous studies reporting that eating out has a negative effect on nutritional status, we attempted to understand the effect of eating out on nutritional quality and observed that dietary diversity may be different according to socio-demographic factors.
Our findings may be helpful for developing basic guidelines for healthy diets for Korean adults. When preparing meals at home, understanding healthy food and ingredient selection and preparation can produce changes in dietary behaviors. Focusing on selection of cooking methods and healthy ingredients in nutrition education is an effective way to improve individual health status and have a more healthful diet. In the case of eating out, it is also important to consider how to select a healthy meal that fits an individual's nutritional needs. Furthermore, nutritional education should emphasize different strategies for meal preparation and selection of healthy ingredients depending on socio-demographic status, rather than merely evaluating advantages and disadvantages of eating out.


 XML Download