

 PDF
PDF ePub
ePub Citation
 Print
Print


Introduction
Globally, obesity has become one of the central public health concerns. The prevalence of obesity has been on the rise among children and adolescents both in developed and developing countries (Flegal, 1999 & 2000; Kromeyer-Hauschild et al., 1999; Moreno et al., 2000; Ogden et al., 2006; Reilly & Dorosty, 1999; WHO, 2006). National data also indicates alarming rates of obesity prevalence in children and adolescents, peaking at 29.3% for the age group of 10-14 years (KMHW & KCDC, 2006). This trend of early onset of obesity associated with several health conditions including cardiovascular diseases, some cancers, diabetes, high blood pressure, and dyslipidemia puts a higher order of priority on obesity prevention efforts targeting children and adolescents.
While obesity is a common health problem worldwide and generation-wide, an intervention program should be specifically designed to reflect dietary problems of a target population for its effectiveness. Several studies have examined nutrient intakes or dietary habits in normal and obese Korean children (Choi & Seo, 2003; Heo & Choi, 2006; Kim et al., 2002; Kim & Nam, 1998; Lee, 2005), in order to elicit useful information for developing effective and strategic nutrition education programs aiming at childhood obesity prevention. Previous research has reported several concerned eating habits, including eating a quick meal, preferring animal foods, disliking vegetables, and skipping a meal, in obese children (Choi & Seo, 2003; Heo & Choi, 2006; Kim et al., 2002; Kim & Nam, 1998). Looking at nutrient intake between normal and obese children, intake levels of most nutrients were higher in obese children than in normal children probably due to correlation with higher calorie intake (Choi & Seo, 2003; Lee, 2005). Relatively scarce information is, however, available about if a highly consumed dish item profile is dependent on the obesity status of children or not. Such information may hint at specific and practical behavioral points on which childhood obesity prevention programs need to focus.
Successful implementation of obesity prevention programs also requires an accurate dietary assessment to screen for subjects in need and to evaluate the effectiveness of the programs. In addition to accuracy, such a dietary assessment tool should be brief, economical, and easy to administer. A FFQ is generally acknowledged to satisfy the above necessary features among the most different dietary assessment methods since food records and 24-hour recalls are labor and time-consuming. Use of FFQ for assessing children's diets possesses extra challenges beyond those for assessing diets of adults, because children may have more limited cognitive ability and knowledge of food and food preparation. Development and evaluation of FFQ for children has been continuously conducted for various areas of diets in an effort to provide a useful dietary assessment tool during the last decade (Buzzard et al., 2001; Cullen et al., 1999; Field et al., 1999; Harnack et al., 2006; Jensen et al., 2004; Rockett et al., 1995; Vereecken & Maes, 2003; Watson et al., 2003). However, few systematic studies have been nationally done to develop and test a FFQ for Korean school-aged children.
The objective of this study was to compare intake levels of major dish items and food groups between normal and obese Korean children to better understand obesity-related eating behaviors. The 2001 KNHANES provided a basic dietary database for pursuing this study question. Furthermore, the current study also aimed to develop a brief FFQ for children's obesity-related eating behaviors based on the differences in major dish items and food group consumptions found in this study. The reliability of the developed FFQ was evaluated among a convenience sample of elementary school children.
Subjects and Methods
The current study was conducted in a three-step process as follows: 1) comparison of major dish items and food group consumptions between normal and obese children; 2) development of a brief FFQ for children's obesity-related eating behaviors; 3) testing reliability of the FFQ.
1. Comparison of major dish items and food group consumptions between normal and obese children
Subjects
Data from the 2001 KNHANES were utilized to compare profiles of major dish items and food group intakes between normal and obese children. Detailed information on study design of the KNHANES is described elsewhere (reference). In brief, the KNHANES is a nation-wide survey of the health and nutritional status of Korean citizens conducted every 3 years. The KNHANES has employed a two-stage probability sampling method to select a representative sample of Koreans. A total of 4,000 households were selected and asked for participation in the 2001 KNHANES consisting of four sections, health survey, health attitude and behavior survey, physical examination, and dietary survey. The dietary survey section was conducted in approximately a third of the selected households. Out of 9,968 individuals who supplied 24-hour recall dietary data, a total of 594 subjects were in the target age span of this study of 9-11 years. The percent value of ideal body weight (PIBW) was calculated for these subjects using data from the Korean Pediatric Association (1998) for a standard body weight for height. Then those either in the PIBW ranges of 90-100 (n=148, normal) or >115 (n=142, obese) were included in the analysis of this study. Though a PIBW range of 90-110 is generally categorized as normal weight and that of >120 as obesity, the above cutoffs were chosen in order to more clearly contrast eating behaviors, if any, between normal and obese children and to secure a balanced sample size.
Dietary database
Trained dietitians administered a 24-hour dietary recall employing a multiple-pass approach. In order to improve accuracy of portion size estimation, two-dimensional food models and food containers of various sizes were used. A booklet of weight information for popular eye-measured volume unit developed by the Korea Health Industry Development Institute was also utilized. The survey was carried out during a two-month period from November through December in 2001.
In the KNHANES 24-hour dietary recall database, each dish item reported is coded at three levels. First, a unique dish code is given to a dish item. Second, every food ingredient for a dish item is given a food code. A dish code can be, thus, related to more than one food code. Finally a dish item is assigned into one of 29 food groups (i.e., rice, noodles and dumpling, soup, pot stew, kimchi, dairy products and ices, et al.), given a food group code. This study focused on the dish code and food group code systems since they are thought to better reflect actual eating behaviors compared to food ingredient information.
Statistical analysis
General information of subjects was generated as a mean and standard deviation for continuous variables or frequency and proportion for categorical variables. Total intake amounts for each dish item reported were calculated for each subject, and then the dish items were listed by the order of mean daily intake amounts for normal and obese groups. Prior to this step of analysis, dish items with different dish codes, but with a similar conceptual and nutritional face value, were merged into a single representative dish code. Mean daily intake amounts for 20 food groups were also generated for normal and obese groups. These descriptive analyses was done using SAS software package (Version 9.1, Cary, NC, USA).
2. Development of a brief FFQ for children's obesity-related eating behaviors
Selection of FFQ item
Major dish items in terms of intake amount were compared between normal and obese subjects, and items responsible for outstanding differences between the two groups were selected as FFQ items. Specifically, those not in the top 20 dish item list by intake amounts for normal children but in that for obese children as well as those of which mean daily intake amounts of normal children were less than half that of obese children were determined to be included in the FFQ. Lastly, intake levels of 20 food groups were examined, and food groups meeting the following conditions were added to the FFQ. The conditions included mean daily intake amounts of greater than 50 g, difference in intake amounts of greater than 10%, and lack of redundancy with pre-selected items.
Frequency response section
The frequency response section in the FFQ was formatted into a seven-category option: almost never, 1-2 times per week, 3-4 times per week, 5-6 times per week, once a day, 2 times a day, and 3 times a day or more often. The last 7-day period was presented as a reference period in consideration of the children's limited capabilities of recollecting the past.
3. Testing reliability of the FFQ
Subjects & Data collection
Study subjects were recruited from a public elementary school in the southwest area of Seoul. A total of six 4th 6th grade classes (2 classes for each grade) were chosen for participation in this study. The FFQ was self-administered in the presence of the teacher in charge of each participating class. A research assistant, in advance, met with a head teacher to explain several issues about FFQ administration in an effort to collect quality data. The questionnaire was administered twice to each subject at a one-month interval. The FFQ took approximately less than 5 minutes to complete each time, and school supplies were given as incentive goods. Out of 199 students, 46 were excluded from the analysis for this study because they were either out of the age span of this study (9-11 years) (n=40) or considered outliers (n=6). When the total number of intake frequency of FFQ items was out of 2SD from the mean value in either the first or second FFQ, a respondent was considered an outlier.
Statistical analysis
Correlations for intake frequency of each FFQ item between the first and second FFQ administration were examined by Spearman rank correlation analysis. To examine reliability from another view, proportions of the subjects who checked the same and up to adjacent frequency categories for each FFQ item between the first and second FFQ were generated. In addition subjects were categorized into approximate quartiles based on the total intake frequency of FFQ items conceptually positive for obesity prevention. The process was repeated for FFQ items generally conceived negatively for obesity prevention. Subsequently, proportions of the subjects categorized into the same and up to adjacent quartiles of positive and negative FFQ item intake quartiles between two FFQ administrations were calculated.
Results
Comparison of major dish items between normal and obese children
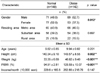
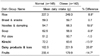
Table 1 presents general characteristics of the 2001 KNHANES participants aged 9-11 whose 24-hour recall data were used to compare major dish items between normal and obese children. Among the 594 participants of 9 to 11 year-olds, there were 148 (24.9%) normal children and 142 (23.9%) obese children. Resulted from the group definition, the obese group had significantly greater height, weight, and PIBW values than the normal group. The mean PIBW values were approximately 95 and 126 for the normal and obese group, respectively. Otherwise, the two groups were generally similar. Age difference was not found, and monthly household income values and the distribution of residing area were not differed by group. Significant difference in gender distribution was, however, observed. The obese group had a higher proportion of boys (62.7%) compared to the normal group (48.0%).
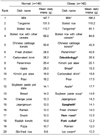
The top 20 dish items, by intake amount for each group, are listed in Table 2. Dietary data of all the subjects, not only those who reported any consumption of a dish item, were reflected to calculate the mean daily intake amount for Table 2. The same set of dish items, including milk, boiled rice, tangerine, boiled rice with other cereals, and Chinese cabbage kimchi, were in the first to fifth places for both groups. Only subtle differences in the top 5 dish items list were the position interchange between tangerine and boiled rice for the second and the third positions. That is, tangerine was listed as the second most-consumed item for normal children, while so was boiled rice for obese children. The most eaten item was milk for both groups, reflecting the elementary school's milk provision system. Appearance of boiled rice, boiled rice with other cereals, and Chinese cabbage kimchi in the top 5 list represents general adhesion to traditional Korean eating style of elementary school children.
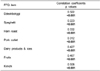
The lists of the 6th to 20th positions somewhat varied between the two groups. Though several items, including fried chicken, carbonated drink, persimmon, apple, kimchi pot stew, pear, bread, jajangmyun, and ramen, appeared in the 6th to 20th positions of the list for both groups, some high-calorie items such as ddeokbokggi, spaghetti, ham roast, pork cutlet, and ice cream only appeared on the obese children's list. Looking at absolute intake amounts, all the items except for ice cream also represented the obese children's eating behaviors distinguished from normal children's. For example, the mean daily intake amount of ddeokbokggi was about 27 g for the obese group and 3.8 g for the normal group, and that of spaghetti was about 14 g for the obese group and 0.4 g for the normal group. Orange juice, snack, radish kimchi, pizza, and stir-fried rice were present only in the normal children's list. However, differences in absolute intake amount of these items between the two groups were generally much smaller.
Table 3 shows mean daily intake amounts of the major dish groups, of which the mean daily intake amount was greater than 50 g. Dietary data of all the subjects, not only those who reported any consumption of a dish group, were utilized to generate Table 3. Differences in the mean daily intake amount between the groups were greater than 10% for four dish groups including noodles and dumpling, kimchi, dairy products and ices, and fruits. Kimchi and fruits were consumed more among the normal group, while noodles and dumplings and dairy products and ices did so among the obese group.
Development and reliability of a brief FFQ for children's obesity-related eating behaviors
According to the pre-defined criteria mentioned previously, a total of 7 items were selected to be included in the brief FFQ for children's obesity-related eating behaviors. Ddeokbokggi, spaghetti, ham roast, and pork cutlet were first selected based on the results from the comparison of major dish items consumption levels between the two groups (Table 2). Dairy products and ices, kimchi, and fruits were added to the FFQ based on intake amounts of the major food groups (Table 3). The food group category of noodles and dumplings, of which intake amount was substantially different between the groups, was not included in the FFQ due to the redundancy with the pre-selected items of ddeokbokggi and spaghetti.
To evaluate reliability of the developed FFQ, Spearman correlation coefficients between daily intake frequency of each FFQ item from the first and the second FFQ administration were examined (Table 4). The coefficients were found to be modest, ranging from 0.223 for spaghetti to 0.508 for kimchi. However, they were all statistically significant (p<0.001).
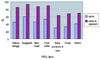
Viewing reliability from a different aspect, proportions of the subjects who checked the same, and up to adjacent categories for each FFQ item between the first and second FFQ, were examined (Fig. 1). The mean value of the proportions reporting the same frequency category was 43.6% (from 30.2% for dairy products and ices to 58.5% for spaghetti). The proportions surged substantially as a less rigid criterion of consistency was applied. The proportions of those who checked up to adjacent frequency categories ranged from 63.5% for dairy products and ices to 92.5% for spaghetti (mean: 79.1%).
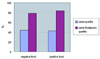
To investigate reliability in terms of ranking performance of the FFQ, the level of consistency in categorizing subjects according to the total intake frequency of FFQ items conceptually positive and negative for obesity prevention was examined. The negative FFQ items included ddeokbokggi, spaghetti, ham roast, pork cutlet, and dairy products and ices, and the positive items included kimchi and fruits. Fig. 2 presents proportions of the subjects who categorized into the same and up to adjacent quartiles of negative and positive food intakes quartile between the two administrations. The proportions of those who were assigned into the same quartile group were a little over 40% (42.5% for the positive food intake quartile and 43.8% for the negative food intake quartile), and the values substantially increased to approximately 80% by counting those assigned into up to adjacent quartiles (83.7% for the positive food intake quartile and 78.4% for the negative food intake quartile).
Discussion
The present study compared consumption levels of major dish items and food groups between normal and obese Korean children using the 2001 KNHANES dietary database to identify obesity-related eating behaviors which need nutrition educators' special attention for effective obesity prevention programs. The study also applied the study findings on the differences in the consumption patterns to develop a brief FFQ for children's obesity-related eating behaviors and examined test-retest reliability of the FFQ in a sample of 9-11 year-old children.
Previous studies have been continuously interested in identifying dietary problems specific to obese children in comparison to non-obese children. Such studies have provided useful information about important dietary habits which call for nutrition educators' focus. In a study among a 280 random sample of two elementary schools in Seongnam (Kim & Nam, 1998), skipping a meal was more frequently reported in the obese group than in the normal group. A large study by Kim et al. (2002), including 746 elementary school students, observed significantly less vegetable preference and higher meat preference among obese girls and faster eating rate among obese boys. More recent studies also reported similar findings in a comparison analysis between normal and obese elementary school children (Choi & Seo, 2003; Heo & Choi, 2006). That is, obese children had a significantly higher frequency of skipping a meal and faster eating rate compared to normal children. Nutritional imbalance possibly resulted from such concerned eating habits is another interest of nutrition educators. Studies examining nutrient intakes in obese and normal children have, however, found higher intake levels in most nutrients among obese children (Choi & Seo, 2003; Lee, 2005), but it is thought that this finding does not necessarily imply higher nutrient density in their diets considering concurrent higher energy intake levels of obese children.
While having a thread of connection with the previous investigations in terms of trying to identify obese children's dietary pitfalls, the present study has a unique feature of comparing consumption profiles of major dish items and food groups. By contrasting daily mean consumption amounts of major dish items and food groups, the study provided a couple of notable points. Despite increasing influx of western dietary culture and fast food products, it was somewhat relieving to see that Korean higher grade elementary school children seem to generally adhere to traditional dietary patterns. Specifically, for both groups of children, boiled rice, boiled rice with other cereals, and Chinese cabbage kimchi were among the top 5 dish items. On the other hand, fast or instant food items such as fried chicken, carbonated drink, ramen, and jajangmyun also seemed important constituents of children's diets regardless of body weight status. These results imply that nutrition education toward elementary school children needs to stress messages about modest consumption of fast or instant foods.
Another notable point from the study findings was that some high-calorie dish items, including ddeokbokggi, spaghetti, ham roast, and pork cutlet, only appeared on the obese children's top 20 list. Mean daily intake amount for these items was also substantially higher in the obese group. Looking at differences in mean daily intake amounts of major food groups, kimchi and fruits were consumed more among the normal group and dairy products and ices did so among the obese group. Though a causal relation between the consumption levels of these dishes or food groups and body weight status cannot be surely addressed due to an inherent limitation of a cross-sectional study design of this study; it is suggested that these study results are worth being reflected in designing nutrition education contents for childhood obesity prevention. Encouraging adequate consumption of fruits and kimchi and providing advice for modest consumption of ddeokbokggi, spaghetti, ham roast, pork cutlet, and ice cream may be effective and practical behavior-oriented messages for 9-11 year-old Korean children in relation to successful weight management.
Recognizing the necessity of reasonably accurate as well as less resource-intensive dietary assessment methods for child and adolescent populations, several researchers have recently conducted FFQ development and evaluation studies among youth populations (Buzzard et al., 2001; Cullen et al., 1999; Field et al., 1999; Harnack et al., 2006; Jensen et al., 2004; Rockett et al., 1995; Vereecken & Maes, 2003; Watson et al., 2003). Jensen et al. (2004) developed a FFQ for calcium intake assessment in multi-racial youth and evaluated its reliability and validity among a sample of 162 Asian, Hispanic, and white youth aged 10-18 years. The FFQ was shown to estimate calcium intake with reasonable levels of reliability and validity. The correlation between calcium intake estimates from the first and second FFQ administrations was 0.68 and correlation between the second FFQ and two 24-hour dietary recalls was 0.54. In another study testing a 10 item calcium FFQ among 248 11-14 year-old children (Harnack et al., 2006), reliability was also found to be good (r=0.74) and validity appeared moderate (r=0.43). Some studies have worked on FFQs aiming at a couple of categories of diets. A 24-item FFQ including fruit, juice, and vegetable items was evaluated among 40 boys aged 9 to 12 (Cullen et al., 1999). Reliability correlation coefficients ranged from 0.42 to 0.71 across dietary measurements (i.e., juice, fruit, vegetables, combined consumption of juice, fruit, and vegetables), and validity coefficients ranged from 0.24 to 0.78. Buzzard et al. (2001) developed a brief FFQ for assessing fat, fiber, and fruit and vegetable intakes of children and its reliability was examined among 539 sixth graders. Correlation coefficients for reliability were 0.58 for fat, 0.49 for fiber, and 0.51 for fruit and vegetables.
While the FFQs assessing single or a few categories of diet have been generally demonstrated to measure children's or adolescents' diets with moderate to good reliability and validity, data on performance levels of FFQs for overall diets in this age group have been a little controversial. The youth/adolescent questionnaire (YAQ) was shown to have reasonable ability to assess eating habits of older children and adolescents in a study based on a multiethnic sample of 179 youths aged 9 to 18 years (Rockett et al., 1994). However, another study evaluating a semi-quantitative FFQ for children's overall diets has reported different reliability and validity levels depending on age. Specifically, reliability coefficients were lower among the fourth and fifth graders (range: r=-0.26 to 0.40) than the sixth and seventh graders (range: r=0.18 to 0.47). Validity coefficients were also lower among the fourth and fifth graders (range: r=0.00 to 0.42) than the sixth and seventh graders (range: r=0.07 to 0.76). The authors concluded that one should assess subjects' levels of abstract thinking and familiarity with the concept of "average intake" before administering the FFQ to fourth and fifth grade children.
In light of considering that few FFQ for Korean children has been developed, this study applied the study findings on the differences in major dish items and food group consumptions to develop a brief FFQ for children's obesity-related eating behaviors. The study results on reliability of the developed FFQ based on item-to-item correlation and contingency and consistency in ranking subjects demonstrated reasonable test-retest reliability of the FFQ. These findings suggest a brief FFQ focusing on a few domains of eating habits may be utilized to reliably assess diets of Korean children aged 9 years or older. Reliable, valid, and brief FFQ would be very useful in various settings requiring assessment of children's diets including screening children in need of nutrition intervention and evaluating effectiveness of nutrition promotion programs. Considering that reliability is a necessary component of a reasonable validity level, this study first evaluated the reliability of the FFQ (Rockett et al., 1995; Zhang et al., 2005). The developed FFQ, however, still remains to be tested for its validity of screening children with relatively high risk of becoming obese.
A few constraints of this study should be noted. The KNHANES 24-hour dietary recall data on which this study was based were collected during a two-month period from November through December, so it is possible that the study findings on distinct consumption patterns between normal and obese children may not be generalized to other times of a year. A single day of 24-hour dietary recall for each participant is another concern related to the dietary database due to the lack of capability to capture one's usual diet information. This point of limitation is, however, likely not to have caused much problem in the current investigation, since the comparative analysis was conducted not on an individual mean basis, but on a group mean basis. Another important concern in regard to the use of simple group means is that if distribution of a certain dish item intake were heavily skewed in the subjects, then the selected FFQ item list may have been substantially biased.
To summarize the study results, several high-calorie dish items including ddeokbokggi, spaghetti, ham roast, pork cutlet, and dairy products and ices were observed to be consumed more by obese children than by normal children in a representative sample of 9-11 year-old Korean children. The opposite pattern was found for consumption of kimchi and fruits. It can be suggested from these results that nutrition educational efforts for children's obesity prevention may benefit from paying special attention to eating patterns of these dish items or food groups. This study also presented a brief FFQ comprised of the seven items shown distinct consumption levels between normal and obese groups, which may be useful for screening children with risky eating behaviors as well as evaluating a performance level of obesity preventive interventions. Consecutive administration of the developed FFQ at a one-month interval to a convenience sample of 9-11 year-old children showed that the FFQ can assess children's certain eating behaviors with a reasonable level of reliability. Further investigation on its validity level still needs to be carried out.
 XML Download