

 PDF
PDF ePub
ePub Citation
 Print
Print


PI3K/Akt signaling
1. Akt phosphorylation induced by the phosphatidylinositol 3-kinase (PI3K) activation
PI3K activation by certain growth factors and hormones induces the conversion of lipid phosphatidylinositol-4,5-bisphosphate [PI(4,5)P2] to phosphatidylinositol-3,4,5-triphosphate [PI(3,4,5)P3]1). The PI(3,4,5)P3 product provides the direct binding sites to effector proteins having pleckstrin-homology (PH) domains that are accumulated at the region of PI3K activation. Akt (protein kinase B (PKB)) and phosphoinositide-dependent kinase 1 (PDK1) are well-known PI(3,4,5)P3-binding proteins and are the key mediators in the PI3K signaling pathway. Interaction between PI(3,4,5)P3 and the effector proteins stimulates phosphorylation of Akt which is catalyzed by autophosphorylation of PDK12). In turn, the phosphorylation of Akt catalyzes the kinase activity of Akt, resulting in the phosphorylation of downstream effector proteins.
The kinase activity of Akt is dependent on phosphorylation at T308 and S473. While T308 phosphorylation of Akt is catalyzed by PDK1, the phosphorylation of S473 in the hydrophobic motif of the C-terminal tail is mainly regulated by the mammalian target of rapamycin (mTOR)3).
2. Expression of Akt isoforms
Three isoforms of the mammalian Akt have been found, and the Akt (PKB) gene family consists of Akt1, Akt2, and Akt3. Although they are encoded from different genes, isoforms of Akt have a similar structural homology of over 80% that is composed of an N-terminal PH domain, a central kinase catalytic domain and a C-terminal extension containing a regulatory hydrophobic motif4). Both phosphorylation sites, threonine in a kinase catalytic domain and serine in regulatory motif, are conserved in T308 and S473 of Akt1, T309 and S474 of Akt2, and T305 and S472 of Akt3.
Despite their structural similarity, the three isoforms show different expressions and functions. Akt isoforms are widely expressed in normal tissues as well as in various tumor cells5). Akt1 is localized in the nucleus and the cytoplasm and translocated to the plasma membrane (PM) by stimulation. Akt2 is colocalized with the mitochondria, while Akt3 is localized in both the nucleus and nuclear membrane6).
Trafficking of membrane protein by Akt signaling
1. Trafficking of membrane protein regulated by PI3K/Akt signaling
Akt signaling is involved in the maintenance of metabolic homeostasis through regulation of the membrane protein trafficking as well as other intracellular protein trafficking. PI3K/Akt signaling is known to maintain the lipid homeostasis by regulating the translocation of surfactant protein A (SP-A) receptor p63 to the PM7). Moreover, Sharpe et al.8) reported that Akt regulates the early secretory pathway from ER to Golgi by phosphorylation of Sec24 protein involved in cargo selection. Furthermore, Robertson et al.9) demonstrated that acute insulin-stimulated Akt signaling decreases the surface expression of the norepinephrine transporter in the mouse hippocampus.
One of the well-known functions of Akt is to regulate glucose homeostasis. In Akt1-knockout mice, deletion of Akt1 inhibits the translocation of GLUT1 to the PM, and leads to reduced glucose uptake10). In muscle and fat cells, Akt and protein kinase C (PKC) are key signaling mediators of the PI3K pathway in the insulin-regulated transport of glucose into cells via glucose transporter GLUT411, 12). It was reported that AS160 (Akt substrate of 160 kDa, originally named TBC1D4 of the TBC family, Tre-2/Bub2/cdc16) is a downstream mediator of Akt signaling during the process of GLUT4 trafficking13). AS160 contains a Rab GTPase-activating protein (GAP) domain. It is proposed that Akt-induced phosphorylation of AS160 inhibits its GAP activity, leading to an increase in the active GTP-bound form of the AS160 target Rab proteins for vesicle trafficking14). Therefore, AS160, a downstream effecter protein of Akt signaling, could contribute to the regulation of Rab proteins associated with intracellular vesicle trafficking, possibly for aquaporin-2 (AQP2) in the kidney collecting ducts.
2. Akt signaling-associated Rab proteins in membrane protein trafficking
Rab proteins have been known to be a key mediator of regulated vesicle trafficking. Previous studies demonstrated that Rab proteins are associated with Akt signaling: (1) Both Rab 5 and Akt signaling are required to regulate insulin receptor-mediated endocytosis15, 16); (2) Rab 10 is involved Na+,K+-ATPase translocation to the PM by insulin-stimulated Akt activation17); (3) Rab 11-mediated Akt signaling promotes glucose uptake via GLUT1 trafficking18); (4) Rab 4 was identified as a specific Akt2 substrate in the modulating of GLUT4 vesicle trafficking19); (5) Rab 10 also mediated the regulatory signaling of GLUT4 trafficking dependent on the Akt pathway20-22); and (6) Rab 11 activation by Akt phosphorylation induced internalization and recycling of the insulin-like growth factor type-1 receptor and GLUT4 trafficking23-25).
Akt signaling and Akt-associated Rab proteins in AQP2 membrane trafficking
1. Akt signaling for regulation of AQP2 protein expression
AQP2 is the water channel protein expressed in the renal connecting tubule and collecting duct. Cell surface expression of AQP2 is regulated by arginine vasopressin (AVP)26, 27). Binding of vasopressin to vasopressin V2 receptor (V2R) in the basolateral PM stimulates adenylyl cyclase which converts ATP to cyclic AMP (cAMP). In turn, cAMP activates the protein kinase A (PKA) signaling pathway that is the major signaling pathway for AQP2 trafficking and up-regulation of AQP2 expression.
Recently, the Akt signaling pathway has been proposed to be another significant signaling pathway for regulation of AQP228). Insulin, one of the most potent hormones for Akt activation, stimulates the PI3K/Akt pathway via insulin receptor and increased AQP2 expression in primary cultures of the inner medullary collecting duct (IMCD) cells of the rat kidney. Moreover, a recent study suggested that AVP stimulates PI3K/Akt signaling pathways29), by demonstrating that dDAVP stimulates Akt phosphorylation in rat kidney IMCD tubule suspension.
2. Akt-dependent signaling pathway for the regulation of AQP2 trafficking
Rab GTPases are important mediators for Akt-dependent intracellular vesicle trafficking. Transcripts of several Rab proteins were found in the IMCD of the rat kidney by transcriptional profiling analysis30). Morevoer, Rab proteins were identified in the AQP2-expressing vesicles from IMCD cells of the rat kidney by LC-MS/MS analysis31). Among Rab proteins identified by proteomic analysis, seven Rab proteins (Rab 4, 5, 7, 11, 18, 21 and 25), have been known to be involved in the trafficking of endosomes. In addition, Rab 5, Rab 7 and Rab 11 were detected in the AQP2-immunoisolated vesicles by immunogold staining for electron microscopy. Rab 4, Rab 5, Rab 7 and Rab 11 were also found in the AQP2-expressing vesicles by immunoblotting31). Importantly, Rab 2, Rab 10 and Rab 14 are the AQP2 vesicle-associated Rab proteins and are also reported as target substrates of AS160 in insulin-stimulated Akt singaling14).
Indeed, we examined whether AS160, a novel Akt substrate, plays a role in the regulation of AQP2 trafficking in the kidney collecting duct cells. The main strategy was to examine whether AS160 knockdown in mouse cortical collecting duct cells (M-1 cells) by small interfering RNA (siRNA)-mediated gene silencing could affect the AQP2 trafficking to the PM. The results were summarized below.
Results
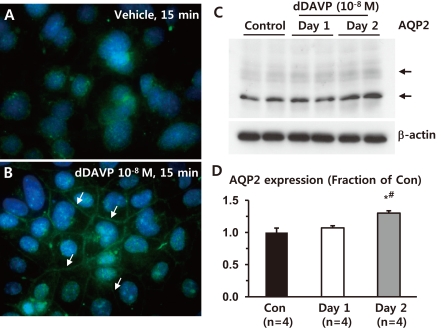
1. Regulation of AQP2 expression in M-1 cells in response to dDAVP treatment
Immunofluorescence microscopy demonstrated that short-term dDAVP treatment (10-8 M, 15 minutes) increased AQP2 labeling intensity in the PM of M-1 cells (arrows in Fig. 1B), compared with vehicle-treated M-1 cells (Fig. 1A). Moreover, AQP2 expression (both deglycosylated ~28 kDa and glycosylated ~35-50 kDa bands) was significantly increased in response to 2 day-dDAVP (10-8 M) treatment (130 ± 4% of vehicle-treated control levels, P < 0.05), compared with either vehicle (100 ± 7%) or 1 day-dDAVP (10-8 M) treatment (107 ± 4%, Fig. 1C and 1D). This indicates that AQP2 is endogenously expressed in M-1 cells, a mouse cortical collecting duct cell line, and its expression is regulated by both short-term and long-term treatment of dDAVP.
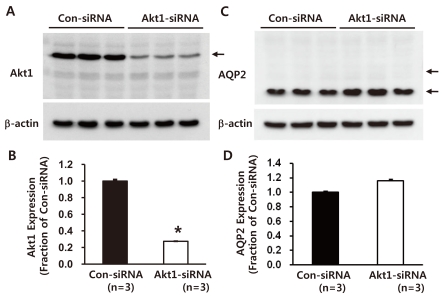
2. Decreased Akt1 but unchanged AQP2 expression in M-1 cells with Akt1 knockdown
Akt1-directed siRNA significantly decreased Akt1 protein expression (27 ± 1% of control levels, non-targeting siRNA-transfected M-1 cells, P < 0.05, Fig. 2A and 2B). Importantly, AQP2 protein expression was unchanged (116 ± 2%, not significant) in response to Akt1 knockdown (Fig. 2C and 2D). In addition, M-1 cells with Akt1 knockdown for 48 hours demonstrated no changes in morphology and cell number compared with control M-1 cells transfected with non-targeting siRNA (not shown).
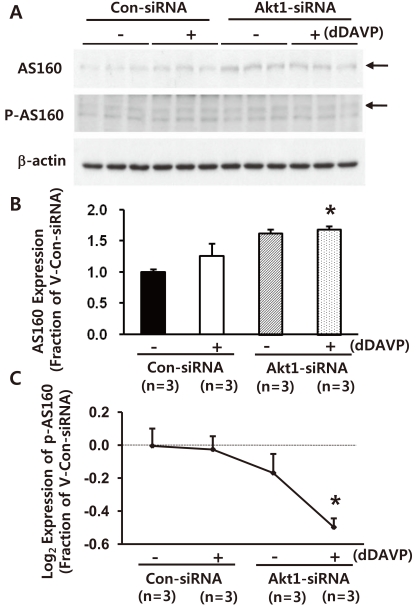
3. Decreased phospho-AS160 expression in M-1 cells with Akt1 knockdown
One more set of Akt1 knockdown [Akt1 expression: 12 ± 2% of control levels (non-targeting siRNA-transfected M-1 cells), P < 0.05, data not shown)] was made. Akt1 knockdown was associated with unchanged or marginally increased total AS160 expression (vehicle-treated group: 128 ± 7%, P = 0.054 and short-term dDAVP-treated group, 10-8 M, 10 minutes, 138 ± 9%, P < 0.05, Fig. 3A and 3B). Importantly, the expression of phospho-AS160 was unchanged indicated by an arrow in Fig. 3A, and hence, the phospho-AS160 values normalized to the total AS160 protein values were markedly decreased (Fig. 3C). For phosphoproteins, the phosphoprotein values were normalized to the total protein values (i.e., log2 [(Fep/Fcp)/(Fet/Fct)], where F = band intensity, e = experiment, c = control, p = phosphoprotein, and t = total protein, as previously demonstrated)29). The number of replicates (n) in the figures indicates the number of separate cell lysates examined. This indicates that AS160 expression and phosphorylation of AS160 are dependent on Akt.
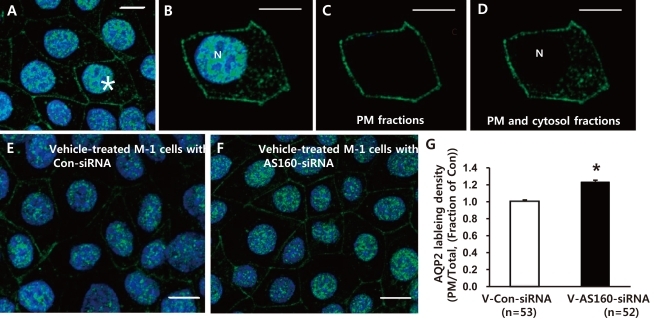
4. Increased AQP2 immunolabeling density of the PM in M-1 cells with AS160 knockdown despite the absence of dDAVP stimulation
As shown in Fig. 4, AQP2-labeled M-1 cells were randomly selected in each group (asterisk in Fig. 4A). The total pixel intensity of the PM (Fig. 4C) and the whole cell (both PM and cytosol except nucleus, Fig. 4D) were acquired, respectively. The ratio of total pixel intensity in the PM to that of the whole cell (ratio of PM/Total, Fig. 4G) from the randomly selected cells in each group was acquired. The ratio is a measure of surface AQP2 normalized for the whole cell AQP2 expression, and the changes of this ratio would demonstrate the changes of the surface-to-total AQP2 distribution. Laser scanning confocal microscopic examination of AQP2 and quantitative analysis of AQP2 immunolabeling density (i.e., changes of the surface-to-total AQP2 distribution in the M-1 cells) demonstrated that AQP2 expression in the PM in the vehicle-treated basal condition was significantly higher in the M-1 cells with AS160 knockdown (123 ± 2%, P < 0.05, number of examined cells = 52, Fig. 4F and 4G) compared with the control M-1 cells transfected with non-targeting siRNA (number of examined cells = 53, Fig. 4E and 4G). This indicates that AS160 plays a role as a negative regulator for exocytosis of AQP2.
Summary
Taken together, (1) siRNA-mediated gene silencing of Akt1 significantly decreased Akt1 and phospho-AS160 protein expression; and (2) confocal laser scanning microscopy of AQP2 in M-1 cells revealed that AS160 knockdown by siRNA increased AQP2 expression in the PM compared with control, despite the absence of dDAVP stimulation. This finding is compatible with a previous study showing increased GLUT4 trafficking in adipocytes with AS160 knockdown despite the absence of insulin stimulation. Thus, the results suggest that PI3K/Akt pathways could play a role in AQP2 trafficking via the AS160.
 XML Download