

 PDF
PDF ePub
ePub Citation
 Print
Print


INTRODUCTION
Respiratory muscle weakness is common in a wide range of neuromuscular diseases and can lead to respiratory complications such as pneumonia and respiratory failure. Detecting respiratory dysfunction early in the disease course is important for preventing complications and managing respiratory care. Various parameters can be used to evaluate respiratory function. The forced vital capacity (FVC) is a widely used parameter, but it is not sensitive for the early detection of respiratory abnormality, whereas the maximal inspiratory pressure (MIP) and maximal expiratory pressure (MEP) are early indicators of muscle weakness.1 MIP and MEP are simple and convenient indices that can be used to detect and monitor respiratory muscle weakness in neuromuscular diseases.2 The sniff nasal inspiratory pressure (SNIP) is another inspiratory muscle strength index, and it is not affected by bulbar muscle weakness.3 The normal value of FVC in the Korean population has been reported previously.4 However, reference ranges of MIP, MEP, and SNIP have not been reported for the Korean population, and these parameters may be affected by racial differences.5
We analyzed the respiratory muscle strength in healthy controls and applied the obtained reference values to amyotrophic lateral sclerosis (ALS) patients in order to evaluate their clinical usefulness.
METHODS
Study population
Sixty-seven healthy volunteers older than 20 years were recruited from November 2012 to August 2015. The exclusion criteria included a history of neuromuscular disease, cardiopulmonary disease, cerebrovascular disease, or rhinitis. The researchers applied the exclusion criteria before the study by history-taking, and this resulted in all of the volunteers being included in the study, all of whom provided written informed consent. This study was approved by the Institutional Review Board of Seoul National University Hospital (IRB No. 1209-053-425). The patient group comprised patients with clinically probable or definite ALS according to the El Escorial criteria6 who underwent MIP, MEP, and SNIP measurements from June 2013 to June 2015 for the initial screening of respiratory function.
Thirty-six patients were included, and retrospective chart reviews revealed bulbar symptoms (dysarthria or dysphagia), bulbar signs (tongue atrophy, tongue fasciculation, or increased jaw jerk), and respiratory symptoms (dyspnea or orthopnea). The ALS Functional Rating Scale-Revised (ALSFRS-R) was used to evaluate the functional status of each patient.7 The forced expiratory volume during the first second (FEV1) and FVC were measured using the TypeFlowscreen device (eResearch Technology, Enstenfeld, Germany). The degree of restriction was graded in accordance with the manufacturer's protocol.
Experimental protocol
Weight and height were obtained by interview, from which the body mass index (BMI) was calculated. Peak pressures were measured using the MicroRPM device (Micromedical, Rochester, UK). Each test was repeated three times, and the highest value was selected. MIP was measured during maximal inspiration after full expiration, at which time the residual volume is nearly minimal. MEP was measured during maximal expiration after full inspiration, at which time the lung is nearly full. When performing both tests, the subjects sealed their lips around a plastic mouthpiece to prevent air leakage. SNIP was measured like MIP but using a nasal plug instead of a mouthpiece, with the nasal plug connected to one nostril and the other nostril occluded. All of the tests were performed with the subject in a sitting position.
Statistical methods
The reference ranges were analyzed statistically using the R program (version 2.15.1, http://cran.r-project.org). The generalized additive modeling of location, scale, and shape (GAMLSS) method was applied for the modeling. The results were not normally distributed, and so the data were transformed into a normal distribution using the Box-Cox Cole and Green distribution. A model with minimized Akaike Information Criterion was selected, and a cubic smoothing spline was used to smooth the model.8 Each z-score of the subjects was derived from median µ, coefficient of variation σ, and Box-Cox power λ. The prediction equations for µ and the z-score are as follows9:

In the above equations, a3 was multiplied by 1 for female subjects and 0 for male subjects, and Y is the measured value. A probability value of p<0.05 was used as the criterion for statistical significance. The calculated value was considered abnormal if its z-score was below -1.645, which covers the lower 5th percentile of the general population. The standardized coefficients of age, sex, and BMI were calculated using multiple regression analysis to assess the relative effectiveness of the respiratory pressure.
Other statistical analyses were performed using SPSS (version 22.0, SPSS, Chicago, IL, USA). Each sex group was divided into three groups according to age. A Kruskal-Wallis test was used to compare the means of peak pressures between age groups. The validity of the assumption of a normal distribution was confirmed by the Shapiro-Wilk test, and the relation among MIP, MEP, and SNIP was examined by Pearson correlation analysis. The proportion of ALS patients with abnormal peak pressures was analyzed by Fisher's exact test. The degree of the restrictive pattern according to FEV1 and FVC was classified into normal, mildly restrictive, moderately restrictive, and severely restrictive. The association between the degree of the restrictive pattern and respiratory pressure was evaluated using a linear-by-linear association test.
RESULTS
Reference range of respiratory pressure
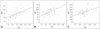
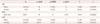
Sixty-seven healthy controls completed the testing, and no adverse events occurred during the measurements. The demographics of the study population are listed in Table 1. There were 37 female and 30 male participants. The mean MIP, MEP, and SNIP were compared among the age and sex groups (Table 2). None of the parameters differed significantly among the age groups. The mean values of MIP, MEP, and SNIP were 30%, 28%, and 25% lower in females than in males. We found that there were statistically significant correlations between MIP, MEP, and SNIP: MIP vs. MEP (r=0.597, p<0.001), MIP vs. SNIP (r=0.573, p<0.001), and MEP vs. SNIP (r=0.437, p<0.001) (Fig. 1).
The coefficients of the equations predicted by the GAMLSS analysis are summarized in Table 3. BMI was positively correlated with MIP for each sex, and age had no significant effect. Sex was the only variable to determine MEP, and so a regression model was formulated without distinguishing sex. SNIP was positively correlated with age and BMI in males, whereas it was correlated negatively with age and positively with BMI in females. The absolute value of the standardized coefficient was highest for sex (Supplementary Table 1 in the online-only Data Supplement).
Respiratory function of ALS patients
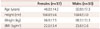
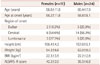
Tests were performed on 11 female and 24 male ALS patients. The male and female patients were aged 60.4±7.9 years and 58.8±11.8 years (mean±SD), respectively, and they were 167.0±5.1 cm and 156.4±4.3 cm tall, weighed 62.0±8.0 kg and 54.3±6.6 kg, and had BMIs of 22.2±2.6 kg/m2 and 22.3±3.5 kg/m2 (Table 4). The prevalence of abnormal respiratory pressure was estimated by the prediction equation. There were 20 (57.1%), 18 (51.4%), 9 (25.7%), 22 (62.9%), and 6 (17.1%) patients with abnormal MIP, abnormal MEP, abnormal SNIP, bulbar signs, and dyspnea, respectively.
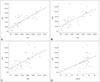
There were statistically significant correlations among MIP, MEP, and SNIP: MIP vs. MEP (r=0.758, p<0.001), MIP vs. SNIP (r=0.646, p<0.001), and MEP vs. SNIP (r=0.612, p<0.001) (Fig. 2A, B, and C). These parameters were also positively correlated with FEV1% and FVC%: MIP vs. FEV1% (r=0.688, p<0.001), MIP vs. FVC% (r=0.736, p<0.001), MEP vs. FEV1% (r=0.359, p=0.037), MEP vs. FVC% (r=0.431, p=0.011), SNIP vs. FEV1% (r=0.670, p<0.001), and SNIP vs. FVC% (r=0.720, p<0.001). The ALSFRS-R is a validated ALS clinical scale,10 and the scores on this scale were compared with respiratory pressures. SNIP was the only parameter that was significantly correlated with the ALSFRS-R score: SNIP (r=0.473, p=0.007) (Fig. 2D), MIP (r=0.336, p=0.065), MEP (r=0.229, p=0.215), FEV1% (r=0.262, p=0.161), and FVC% (r=0.333, p=0.072).
The degree of the restrictive pattern according to FEV1 and FVC was significantly associated with dyspnea (p=0.009) but not with bulbar signs (p=0.128). MIP and SNIP were significantly associated with the restriction degree (MIP, p=0.012; SNIP, p=0.024), whereas MEP was not (p=0.081).
There was no statistically significant association between respiratory pressure and bulbar signs. MIP and SNIP showed significant associations with respiratory symptoms, whereas MEP did not (Table 5).
DISCUSSION
The present study has revealed the reference ranges of MIP, MEP, and SNIP. Sex was the factor that was most strongly predictive of respiratory pressures. BMI was a positive predictor of MIP and SNIP, whereas age contributed only to SNIP. MIP, MEP, and SNIP were positively correlated with each other in ALS patients. MIP and SNIP showed significant correlations with the degree of the restrictive pattern and respiratory symptoms. The ALSFRS-R score was correlated with SNIP.
Most previous studies have found respiratory pressures to be mainly influenced by sex.5111213 The values of MIP, MEP, and SNIP are reportedly about 30% higher in males than in females, which is consistent with our results. Besides sex, age is another strong predictor, with respiratory pressure declining with age.2 The present study found that age was correlated with SNIP but not MIP and MEP when using the GAMLSS method. Multiple regression analysis and analysis of variance using the Kruskal-Wallis test revealed no correlation between SNIP and age. The GAMLSS method is more flexible and is better than classic multiple regression for analyzing the goodness of fit regarding multiple factors,914 and is supported by the correlation between SNIP and age in the present study. Some previous studies found that the decreases in MIP and MEP were not significant under a certain age,1516 with the threshold age for this difference varying between the studies.17 Therefore, the broad age range of the subjects included in the presence study may have influenced the obtained results. Racial differences may have also contributed to the results.13 BMI was positively correlated with MIP and SNIP in our study, like in previous studies,51318 which may be attributable to muscle mass being correlated with height and weight, which determine the BMI.411
Respiratory dysfunction is the main cause of death in ALS patients1920 and is an important factor in their quality of life.21 Respiratory symptoms are an insensitive marker for detecting early respiratory dysfunction.19 Therefore, objective markers are needed to screen respiratory function in the early phase of ALS, but there is no suitable test for detecting the early signs of respiratory failure and for predicting hypercapnia.19
Normal MIP and MEP values were significantly associated with survival,2223 and MIP reached the criterion for initiating noninvasive ventilation (NIV) earlier compared to FVC.24 SNIP is easy to measure, especially in patients with bulbar muscle weakness, which is reproducible in the advanced stage and is strongly correlated with the invasively measured diaphragmatic muscle strength.21 SNIP was significantly associated with nocturnal hypoxemia and mortality.3 Our study revealed that inspiratory markers such as MIP and SNIP are significantly associated with respiratory symptoms, whereas MEP—which is a marker of expiratory function and is related to the ability to cough22—did not show a significant relationship. The degree of the restrictive pattern was also only correlated with inspiratory markers.
ALSFRS-R is a validated functional measurement scale of ALS and an independent predictor of survival.25 Cedarbaum et al.10 reported that FVC% is correlated with the ALSFRS-R score but not with the respiratory subscale. The present study found that SNIP is strongly correlated with the ALSFRS-R score, whereas other parameters including FVC% were not. This discrepancy between the ALSFRS-R and respiratory subscale scores may be at least partially due to deconditioning or fatigue,10 and further study of the relationship between SNIP and the respiratory subscale is warranted.
Our study was subject to several limitations. First, the normal population sample was small due to the difficulty of recruiting sufficient volunteers in a single center. A multicenter study involving a large population may produce more reliable results. Second, exclusion criteria were confirmed only by history-taking. Subclinical cardiopulmonary dysfunction or muscle weakness might not be totally excluded. Third, smoking was not included as an exclusion criterion, which might have influenced the results. Fourth, arterial blood gas analysis was not performed routinely in the initial workup of ALS patients, and we could not analyze the association between hypercapnia and respiratory pressures. Lastly, the cooperation and cognition state of ALS patients were not evaluated, which might also have influenced the results.
To our knowledge, this is the first study of reference ranges of respiratory pressures in healthy adults. Sex was the strongest factor predictive of MIP, MEP, and SNIP. Abnormal inspiratory pressures based on the present reference ranges were significantly associated with respiratory symptoms in ALS patients. SNIP has the advantage of being independent of bulbar muscle weakness and being correlated with the functional status of ALS patients. Further analyses of long-term outcomes such as NIV and survival are warranted in future studies.

 XML Download