

 PDF
PDF ePub
ePub Citation
 Print
Print


Introduction
Decreased renal function is an independent risk factor for all-cause and cardiovascular mortality in the general population,1 as well as in various populations with comorbidities2,3 Most patients with chronic kidney disease (CKD) are particularly vulnerable to multisystem organ dysfunction. In particular, the adequate management of acute stroke patients with CKD may be disrupted by difficulties associated with fluid management, drug prescription, electrolyte disturbance, and increased susceptibility to cardiovascular events and infection. The combination of these factors may increase the risk of poor stroke outcomes in this population. However, the impact of low estimated glomerular filtration rate (eGFR) on the clinical outcomes of acute ischemic stroke remains controversial.4,5,6,7 A recent Chinese study found that a decreased eGFR is closely linked to all-cause mortality and functional disabilities.8 Other data suggest that only proteinuria-and not a reduced eGFR-is associated with adverse outcomes after ischemic stroke.9,10,11
In observational studies of the effect of renal dysfunction on stroke outcome, decreased renal function has usually been defined as an eGFR of <60 mL/min/1.73 m2 (i.e., CKD stage 3 or higher).6,10,11,12,13 However, whether stroke outcome is affected by the stage of CKD has not been well delineated. In fact, even in patients with renal dysfunction, the risk of an adverse outcome is quite markedly elevated when the eGFR falls below 45 mL/min/1.73 m2. For this reason, the Kidney Disease Improving Global Outcomes (KDIGO) Clinical Practice Guideline divided CKD stage 3 (eGFR=30-59 mL/min/1.73 m2) into stages 3a (eGFR=45-59 mL/min/1.73 m2) and 3b (eGFR=30-44 mL/min/1.73 m2).14 Moreover, the number of patients with advanced stages of renal dysfunction is increasing due to the aging population and the increase in CKD risk factors such as diabetes, hypertension, and obesity.
This study used the data from a hospital-based stroke registry to evaluate the effect of baseline eGFR on clinical outcomes at 3 months after acute ischemic stroke. In addition, the impact of CKD on neurological deterioration and mortality during hospitalization was determined.
Methods
Study population
This prospective study included 1,507 patients with acute ischemic stroke who were consecutively admitted to Hallym University Sacred Heart Hospital between July 2007 and July 2012. The inclusion criterion was patients with an acute ischemic stroke within 7 days after symptom onset. The presence of stroke was confirmed in all patients by a computed tomography scan and/or magnetic resonance imaging. Among the initially enrolled 1,507 patients, 134 were excluded for the following reasons: incomplete data at baseline (n=54), a preadmission modified Rankin Scale (mRS) score of >2 (n=76), and undergoing dialysis (n=4). Consequently, data from 1,373 patients were analyzed. This study was approved by the Institutional Review Board/Ethical Committee. Written informed consent to participate was obtained from each subject after receiving a full explanation of the purpose and nature of the study.
Data collection
The baseline assessment comprised collecting demographic data and assessing risk factors, stroke severity, and stroke subtype. The following risk factors were included: hypertension (blood pressure ≥140/90 mm Hg, or antihypertensive treatment), diabetes (fasting glucose ≥126 mg/dL, random glucose ≥200 mg/dL, or treatment with insulin or oral hypoglycemic medications), dyslipidemia (serum total cholesterol ≥240 mg/dL, low-density lipoprotein cholesterol ≥160 mg/dL, or use of a lipid-lowering agent), atrial fibrillation (Afib; confirmed by past electrocardiogram or detected during hospitalization), ischemic heart disease (myocardial infarction and unstable angina), clear history of stroke (symptoms with corresponding brain lesion confirmed by imaging), and smoking. Automated urinalysis was performed to detect proteinuria, and the results were scored as (-), (±), 1+, 2+, 3+, or 4+, whereby proteinuria was defined as 1+ or greater. However, quantification of proteinuria (e.g., urine protein-to-creatinine ratio or albumin-to-creatinine ratio) was not performed in this registry.
Stroke severity was assessed using the National Institutes of Health Stroke Scale (NIHSS) at admission and discharge. However, the NIHSS score at discharge was missing in 39 patients. Ischemic stroke subtypes were classified as large-artery atherosclerosis, small-vessel occlusion, cardiac embolism, stroke of other determined causes, or stroke of undetermined etiology, according to the Trial of Org 10172 in Acute Stroke Treatment classification. The use of intravenous tissue plasminogen activator (tPA) was also recorded. Functional disability was assessed using the mRS scores at admission, discharge, and 3 months after the stroke onset.
Serum creatinine levels were measured on admission and then checked repeatedly during hospitalization. The eGFR, calculated using CKD Epidemiology Collaboration equations, was used to assess baseline renal function. In accordance with the 2012 KDIGO Clinical Practice Guidelines, patients were classified into the following four groups based on their eGFR: ≥60 mL/min/1.73 m2, CKD stage 1 or 2; 45-59 mL/min/1.73 m2, CKD stage 3a; 30-44 mL/min/1.73 m2, CKD stage 3b; and <30 mL/min/1.73 m2, CKD stage 4 or 5.
Follow-up and endpoints
Three-month outcomes were assessed by interviewing the patients or their caregivers either in person or by telephone. The primary endpoint (i.e., poor functional outcome) was defined as 3-month death or dependency (mRS score ≥3), while the secondary endpoints were neurological deterioration during hospitalization or in-hospital mortality. Neurological deterioration was defined as an increase in NIHSS score of ≥4 points between admission and discharge.
Statistical analysis
The Kolmogorov-Smirnov test was used to analyze the normality of the distribution of the parameters. Variables with normal distributions are expressed as mean±SD values. The statistical significance of observations was assessed using Student's t-test or one-way ANOVA. Nonparametric variables are expressed as median and interquartile range (IQR) values and were compared using the Mann-Whitney or Kruskal-Wallis test. Categorical variables are expressed as percentages and were compared using the chi-square test.
Event-free survival rates after a 3-month follow-up in the four baseline eGFR groups were derived using the Kaplan-Meier method. Intergroup differences in risk were assessed using the log-rank test. Patients with an eGFR of ≥60 mL/min/1.73 m2 served as the reference group. Independent factors that were significant related to a poor functional outcome were identified using a multivariate model, with adjustments being made for variables with p<0.05 in univariate analysis. The threshold for statistical significance was set at p<0.05, and all statistical analyses were performed using SPSS (version 18.0, SPSS Inc., Chicago, IL, USA).
Results
Baseline characteristics of patients
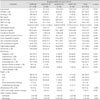
In total, 1,373 patients with acute ischemic stroke were analyzed in this prospective cohort study. Their demographic and clinical characteristics, stroke subtypes, and severity are summarized in Table 1. The age of the entire cohort was 66.7±13.1 years, and 597 (43.5%) of the subjects were female. The eGFR was 84.5±20.8 mL/min/1.73 m2 (range, 10.0-152.0 mL/min/1.73 m2). The distribution of baseline renal dysfunction was as follows: 1,218, 82, 40, and 33 patients had eGFRs of ≥60, 45-59, 30-44, and <30 mL/min/1.73 m2, respectively. Compared to patients with an eGFR of ≥60 mL/min/1.73 m2, those with a low eGFR were older and had higher prevalence of proteinuria and several stroke risk factors such as smoking, diabetes, hypertension, and Afib.
Clinical outcomes and the prognostic value of baseline renal function
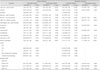
In this study, 476 (34.7%) patients had a poor functional outcome at 3 months after a stroke, and the median length of hospital stay was 8 days (IQR, 6-14). The primary endpoint occurred more frequently at more advanced stages of CKD (rates of 31.9%, 53.7%, 55.0% and 63.6% for CKD stages 1/2, 3a, 3b, and 4/5, respectively; p<0.001). The secondary endpoint of neurological deterioration during hospitalization and in-hospital mortality also occurred more frequently at more advanced stages of CKD. Neurological deterioration was observed in 103 patients (7.7%), and the median increase in the NIHSS score was 6 (IQR, 4-8). In-hospital mortality was 3.9% (Table 2).
The clinical and biochemical predictors of stroke outcome are presented in Table 3. On univariate analysis, the odds ratio for the primary endpoint was 2.47 [95% confidence interval (CI), 1.57-3.87] for the eGFR=45-59 mL/min/1.73 m2 group, 2.61 (95% CI, 1.38-4.91) for the eGFR=30-44 mL/min/1.73 m2 group, and 3.73 (95% CI, 1.82-7.66) for the eGFR <30 mL/min/1.73 m2 group. On multivariate analysis, significant predictors of the primary endpoint were being older, female gender, presence of diabetes, dyslipidemia, Afib, use of tPA, higher NIHSS score on admission, and an eGFR of <30 mL/min/1.73 m2. In addition, increased systolic blood pressure, white blood cell count, higher baseline NIHSS score, and an eGFR of <30 mL/min/1.73 m2 were strongly predictive of neurological deterioration and mortality during hospitalization.
Discussion
Improvements in the management of acute ischemic stroke have highlighted the role of nonneurological comorbidities in determining stroke outcomes. Not surprisingly, nonneurological organ dysfunction is correlated with the severity of neurological impairment, and contributes to increased risks of morbidity and mortality from acute stroke. The findings of this study show that a low baseline eGFR was strongly predictive of both poor functional outcome at 3 months after an acute ischemic stroke and neurological deterioration/mortality during hospitalization. In particular, we found that risks varied depending upon the degree of baseline renal dysfunction. Severely decreased renal function (and particularly eGFR <30 mL/min/1.73 m2) is prognostic of a poor outcome even in models adjusted for other stroke risk factors.
Decreased renal function is a well-known risk factor for all-cause and cardiovascular mortality in the general population, and in various populations with comorbidities. However, the impact of a low eGFR on stroke-related outcomes remains controversial. In a 7-year follow-up study, MacWalter et al.4 found that patients with reduced creatinine clearance and elevated serum creatinine and urea concentrations had a higher mortality risk. Yahalom et al.6 reported that CKD could be a strong and independent predictor of 1-year stroke mortality and poor outcome. However, Hao et al.7 found that the relationship between a reduced eGFR and poor stroke outcome was only relevant in the case of hemorrhagic stroke, and not for ischemic stroke. Similarly, a recently published Chinese study revealed that low eGFR has no appreciable effects on death or disability.14 In the present study, lower levels of baseline eGFR were closely associated with composite events as well as functional disabilities at 3 months after ischemic stroke.
When the patients in this study were divided into four groups according to the severity of their disease based on the KDIGO guidelines (i.e., CKD stages 1/2, 3a, 3b, and 4/5), the risk of adverse events was shown to be highly dependent on the severity of renal impairment. In fact, it has been well documented that the overall risk increases quite markedly when the eGFR falls below 45 mL/min/1.73 m2. Our data further demonstrate that aggravation of CKD stage is closely associated with a significant increase in the risk of in-hospital mortality and poor functional outcomes. Univariate analysis revealed that patients with eGFRs of 45-59, 30-44, and <30 mL/min/1.73 m2 had 2.47-, 2.61-, and 3.73-fold higher risks of a poor outcome, respectively, compared to those with an eGFR of ≥60 mL/min/1.73 m2. When adjustments were made, the link between eGFR and stroke outcomes was significant only in patients with severely reduced renal function (i.e., eGFR <30 mL/min/1.73 m2). We believe that this finding may explain the inconsistencies in conclusions drawn in previous studies about the relationship between eGFR and stroke outcomes.
However, several conclusions that can be drawn from the unadjusted model should not be underestimated. In fact, it may be more relevant to recognize the effect of a reduced eGFR on stroke outcomes without adjustments for other risk factors, since the adjusted analysis may inappropriately underestimate the relationship between levels of eGFR and outcomes.15,16 For example, a reduced eGFR generally results in more severe hypertension and dyslipidemia. Therefore, if included in statistical adjustments, one may overcorrect for the effects of these factors, resulting in a less definite association between decreased eGFR and outcomes. A valid interpretation of our finding may thus be that the presence of CKD, in and of itself, could be an important independent risk factor affecting cardiovascular disease outcomes. This study therefore adds to a growing body of evidence suggesting that kidney disease is an important independent risk factor for adverse stroke outcomes.
Another interesting finding of this study is that proteinuria was not a significant predictor for stroke outcome. Although the presence of proteinuria was associated with poor stroke outcomes in univariate analysis, it was not a significant factor in multivariate analysis. This finding contrast several previous reports that have emphasized the predictive importance of proteinuria.17 Many longitudinal studies have concluded that proteinuria, and even microalbuminuria, is an adverse prognostic indicator for clinical cardiovascular outcomes and all-cause mortality.18,19,20 The Heart Outcomes Prevention Evaluation study found that the risk of a composite outcome of myocardial infarction, stroke, or cardiovascular mortality, as well as all-cause mortality was 1.97-fold higher in patients with microalbuminuria than in subjects without microalbuminuria.18 The negative finding of the present study in this regard may be attributable to our inability to distinguish CKD-associated proteinuria from acute illness-associate transient proteinuria. Proteinuria is a common problem in patients admitted to hospital and is caused by a wide variety of conditions, ranging from benign to lethal. In particular, the probability of transient proteinuria is very high in patients with an acute illness due to ischemic stroke. Repeated urinalysis is necessary to confirm the presence of persistent and pathologic proteinuria; however, urine tests were only performed once in the present cohort, and moreover, urine quantification was not performed. This situation made it impossible to identify and select patients with pathologic proteinuria associated with a low eGFR.
This study was subject to several limitations. First, it was performed in a single center and the analyzed data were harvested from a hospital-based case series; the findings may therefore not be generalizable to the entire Korean population. Furthermore, among the 1,373 cases analyzed in this study, the absolute number of patients with an eGFR of ≥60 mL/min/1.73 m2 was much larger than that of patients with an eGFR of <60 mL/min/1.73 m2, which may have resulted in a low statistical power. Since this study was based on a prospective hospital-based stroke registry, it was not possible to regulate the number of patients in each category of eGFR. Large-scale prospective studies of patients with CKD (eGFR <60 mL/min/1.73 m2) are mandatory to evaluate the effect of advanced-stage eGFR (<30 mL/min/1.73 m2) on clinical outcomes. Finally, since the assessment of urine protein was based on a single measurement, misclassification of urinary protein was possible.
In summary, within the limitations of this study it can be concluded that clinical outcomes after an ischemic stroke are closely associated with the baseline eGFR at the time of admission. In particular, severely impaired renal function is strongly predictive of 3-month all-cause mortality and poor functional outcomes.

 XML Download