

 PDF
PDF ePub
ePub Citation
 Print
Print


Introduction
Prevention is the most effective way of reducing the effects of stroke for both individuals and society. There is considerable knowledge about stroke risk factors, including the lifestyle factors of unhealthy diet, obesity, physical inactivity, smoking, and excessive alcohol consumption, and psychological distress factors that can lead to elevated blood pressure and glucose, and dyslipidemia.1 Knowledge of the biological profile will guide the decision-making in clinical management. However, improving the health of a population requires individuals to be engaged in reducing their own personal risk. Thus, knowledge of risk factors directly under the control of the person is highly relevant; nevertheless, current studies indicate that the majority of the population does not have this knowledge.2 Communicating risk to the general population requires simple tools, with relevance to the typical individual who is likely to have more than one risk factor or be engaged in risky behavior.3 The guidelines of the American Heart Association regarding primary prevention in stroke concur with this, and state that risk assessment is important for the general public.4
A structured search of the literature using PubMed was performed to evaluate current risk-factor profiles using the following keywords: probability, risk stroke, and behavioral. None of the identified risk profiles included physical activity, alcohol consumption, smoking, or psychological distress.3,5-9 The best model is from the Framingham Study and is based on sex, age, systolic blood pressure, diabetes mellitus, cigarette smoking, prior cardiovascular disease, atrial fibrillation (AF), left ventricular hypertrophy, and use of antihypertensive medication.7 Understanding these factors is not within the grasp of most people, and waiting until these conditions appear is not the optimal public health strategy. A useful stroke-risk profile based on lifestyle-related factors indicates approaches, such as increasing physical activity, that are within the patient's own control and would modify risk at an earlier stage.5,6,10
The aim of this study was to develop a prototype for a personalized stroke-risk assessment tool (called the MyRisk_Stroke Calculator) based on risk estimates derived from the general population in Quebec, Canada. The specific objective of this research was to estimate the risk of stroke for specific combinations of health- and lifestyle-related variables, including age, sex, cardiovascular comorbidities, physical activity, alcohol consumption, smoking status, and psychological distress factors.
Methods
Participants and study design
This was a population-based, prospective, cohort study that used historical survey data from the 1992 and 1998 Santé Québec Health Surveys or "Enquête Sociale et de Santé",11 which were linked to the hospital discharge database (MedEcho), the medical services databases maintained by the Régie de l'Assurance Maladie du Québec (RAMQ), and the death registry. The surveys were interviewer-assisted, and covered sociodemographics and lifestyle behaviors related to health and certain aspects of mental health.11 Persons with an indicationon the survey of previous stroke, a hospitalization record, or two or more stroke-related physician billings during the year prior to cohort entry were excluded. The remaining individuals were followed from the date of the survey (either 1992 or 1998) up to and including 2007.
The study received ethical approval from the McGill Faculty of Medicine Institutional Review Board (IRB Review Number A10-M76-03B), following approval from Quebec's Access to Information Bureau (Commission d'Accès à l'Information du Québec). Access to data was obtained only from persons who provided written consent to Santé Québec to link the survey data to health administration records.
Measurement of stroke status
All persons with a hospitalization (in the MedEcho database) or death record indicating acute stroke based on International Classification of Disease version 9 (ICD-9) codes 431, 434, 436, and 362.3 were included.12,13 These codes have been shown to accurately detect stroke in Quebec.12 The corresponding ICD-10 codes are I61, I63, I66, I64, I67.6, and H34. Self-reports and data from RAMQ and MedEcho were used to identify people with an indication of past cerebrovascular disease using ICD-9 codes 430-438.
Measurement of stroke risk factors
Information on health conditions present at the time of survey and during the previous year was available from three sources: questions from the survey, record of a physician billing (RAMQ), and hospitalization data (MedEcho). The following prevalent vascular conditions known to lead to an increased stroke risk were included4: AF, congestive heart failure, diabetes, hypertension, ischemic heart disease, peripheral arterial disease, and renal disease.
Body mass index (BMI) was available. Alcohol consumption was categorized into never, past, and amount consumed per week (1-6, 7-13, and 14 or more standard drinks). The frequency of weekly physical activity was counted as the number of sessions of 20-30 minutes of nonstop physical activity.11 Subjects were categorized as smokers, which included regular (every day) and occasional (less than once a day) smoking, former smokers, and never smokers.11
Also included was the short version of Illfeld's Psychiatric Symptom Index,14 validated in French,15 which measures the presence of depressive or anger-related symptoms indicating the need for referral to a mental-health professional. Items were combined into a total score. However, since total scores are not useable for the purpose of risk assessment, single binary indicator variables were created for each question using the endorsement of "often" or "always" as a cutoff criterion.
Statistical analyses
SAS version 9.2 software (SAS Institute, 100 SAS Campus Dr, Cary, NC, USA) was used for all statistical analyses. Each risk factor was dichotomized into two levels corresponding to whether or not the risk factor was present at cohort entry. Cluster analysis, using the proc FASTCLUS, was employed to identify the distribution of the number of risk factors per person and to identify common risk-factor profiles.
Cox proportional-hazards regression, using Proc PHREG, was utilized to model the time to stroke during the follow-up period, which was up to and including 2007. The first approach was to fit a "development" model to the 1992 data and a "validation" model to the 1998 data, thereby taking advantage of the two waves of the survey. To test the similarity between the two cohorts, a final model was constructed with survey wave as a dummy variable. The overall performance of the model was tested using the Hosmer-Lemeshow method.16 Risk was categorized into 10 bins, and the following parameters were calculated for each of those bins: average predicted risk, observed and predicted number of strokes, and observed and predicted number of individuals without a stroke.
The fit was also assessed by calculating the likelihood displacement (LD) statistic,17 which is the amount by which minus twice the log (-2 log) likelihood, under a fitted model, changes when each subject is left out in turn. A critical value outside ±1.68 suggests an influential subject.
All except three of the available variables were included in the primary model. The a priori excluded variables were AF, because the rarity of this diagnosis was such that no men in the present sample with AF had stroke; BMI, as the only significant association was if BMI was missing; and self-reported health, as there would be no public health action on this variable. The final model included those variables that, in the presence of all other variables, had a significant effect on stroke occurrence. Two other criteria were also used to avoid the bias of variable selection being sample-driven: 1) variables where the lower limit of the 95% confidence interval (CI) around the point estimate exceeded 0.90, or 2) the presence of strong literature evidence that the variable increases the risk of stroke.
For the calculation of individual risk, the regression parameters (β) from the fully adjusted Cox model were used to derive weights for each risk factor according to the formula β×10, and rounded to the nearest whole digit, where hazard ratio (HR)=eβ. The weights were then summed to calculate the total risk score.
Results
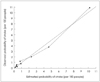
There were no significant differences in the risk estimates from the "development" (1992) and "validation" (1998) cohorts for any risk factor, indicating the reliability of the risk estimates. Hence, both cohorts were combined to create a total cohort for the final model. The calculated probability and observed probability of stroke were compared (Fig. 1). The overall chi-square value (df=7) from the Lemeshow and Hosmer16 test was 12.57, which was associated with a p value of 0.08 and hence provided no significant evidence that the model does not fit. The mean of the LD statistic17 in the data set was 0.0014, with 99% of the subjects having an LD value of <0.05. Five people had an LD value between 0.24 and 0.35. These results do not indicate that there were any overly influential individuals affecting the model parameters.
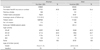
Table 1 provides information on the total cohort. The estimated rates of stroke are compatible with rates for Quebec, as reported previously.18 The proportions of the total population with more than one vascular comorbidity, more than one lifestyle factor, and more than one psychological distress indicator were 18%, 66%, and 20%, respectively (data not shown). Nearly 50% of those who developed stroke had no vascular comorbidity at the time of cohort entry.
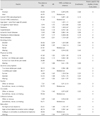
Table 2 presents for each risk factor the prevalence, HR (fully adjusted models) and 95% CI, the parameter estimate, and the points allocated to each factor. For example, 45.9% of the population was male, and their stroke risk compared to women (adjusted for all variables in the model) was 1.33. The β used to derive the HR was 0.28, and multiplication by 10 and rounding indicated that the number of points to be used in the MyRisk_Stroke Calculator was 3. The HR and β are presented for each year of age (after age 20 years); 1 point is assigned for every year older than 20.
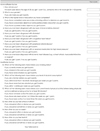
Table 3 presents the format for entering risk information into the MyRisk_Stroke Calculator, enabling a person to calculate their personal 10-year risk of stroke.
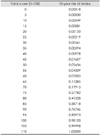
Table 4 is a look-up table relating cumulated points on the MyRisk_Stroke Calculator to risk of stroke. The 10-year risk of stroke was calculated based on the Breslow baseline survival function, as recommended by Hanley,19,20 which was found to be 0.99982. This corresponds to the probability that a 20-year old healthy woman (with no vascular comorbidities, no lifestyle or psychological risk indicators, and with a university degree) would survive without a stroke for 10 years. The risk of stroke was calculated using the following formula:
Discussion
The described process linking survey data to health records for a 10- to 14-year period has identified the risk factors for the occurrence of stroke and allowed the creation of a tool for an individual to quantify his or her stroke risk over the next 10 years based on a personal risk profile. A unique feature of the MyRisk_Stroke Calculator is the inclusion of lifestyle factors, such as smoking, physical activity, and alcohol consumption, and psychosocial variables such as mood, anger, and anxiety, on top of well-established vascular comorbidities.
The risk predictions for the MyRisk_Stroke Calculator were similar to those from the published literature for the effects of congestive heart failure, diabetes, hypertension, ischemic heart disease, peripheral arterial disease, and chronic kidney disorder.3,7,21-25 Lifestyle risks were also similar to those reported in the literature.26-28
Indicator questions related to the constructs of depression, anger, and anxiety were used to measure the effects of psychosocial variables. An individual is able to answer a directly posed question about a symptom or sign, but may have more difficulty providing a rating of the degree to which they have the latent constructs. Risk estimates for clinically diagnosed major depression from the literature are roughly 3.629 among individuals under the age of 65 years, and 3.2 among men.30 The HR for the indicator variable "cry easily" was 1.44 (95% CI=0.98-2.09) in the present study. Similarly, the reported (adjusted) relative HR for anger expression and stroke is 2.0.31 Furthermore, the estimate for the indicator variable "critical of others" was 1.45 (95% CI=0.95-2.22).
While some studies have found that obesity (as measured by BMI) increases the risk of stroke,5,6 other studies have failed to show an association,32,33 particularly after adjustment for factors such as the history of cardiovascular disease, diabetes mellitus, and hypertension.43 The only category of BMI that was a significant predictor of stroke in the present study was "missing" (which may reflect a high BMI), and hence BMI was not included.
It is noteworthy that 50% of strokes occurred in individuals who had none of the vascular comorbidities in the MyRisk_Stroke Calculator. This is similar to the results of Whisnant, who found that the combination of hypertension, transient ischemic attack, smoking status, ischemic heart disease, AF, diabetes, and mitral valve disease accounted for only 57% of ischemic strokes.34 However, lifestyle factors are rarely included in risk profiles. Ezzati et al.35 found that 70-76% of strokes could be attributed to the joint effects of hypertension, hypercholesterolemia, obesity, low fruit and vegetable consumption, physical inactivity, and smoking. The INTERSTROKE study found that lifestyle, vascular conditions, psychosocial stress, depression, and the ratio of apolipoproteins B to A1 had a combined population attributable risk of 90.3%.36 That study did not include education or other measures of socioeconomic status. Although education is not necessarily a modifiable risk factor, excluding it could negatively affect the accuracy of prediction by underestimating the risk among the disadvantaged, potentially exacerbating health inequalities.37 The predictions obtained in the present study, which included comorbidities, lifestyle, and stress-related factors in addition to education, was even stronger since when all factors were included in the MyRisk_Stroke Calculator, only 1.7% of stroke cases were not explained.
The following scenario illustrates the application of the MyRisk_Stroke Calculator to an individual. John is a 62-year-old man who is thinking forward to retirement. He did not finish postsecondary education, is a current smoker, regular drinker (corresponding to a heavy weekly alcohol consumption), and inactive. In addition, John has some anger issues. John was told that he was prediabetic during his annual physical assessment with his family doctor.38 John's physician warned him that if he continues his present lifestyle choices he will develop full-fledged diabetes and his risk of heart disease or stroke will be high. John completes the MyRisk_Stroke Calculator and receives 42 points due to age, 3 points for being male, 3 points due to his level of education, 8 points because of smoking, 3 points due to heavy alcohol consumption, 2 points due to inactivity, and 4 points because he expresses anger. Thus, John receives a total score of 65, which translates to an estimated 10-year risk of stroke of approximately 11.3% (Table 4). John wants to see what would happen to him if he becomes diabetic at the age of his retirement (65 years). In this future scenario, John's total score would be 75 (+7 for diabetes and +3 for a projected age of 65 years), which gives him an estimated 10-year risk of stroke of 27.8%. With diabetes, his stroke risk at age 65 years is 2.5 times that without diabetes. John decides to follow the advice of his physician to reduce his risk of developing diabetes.
In order to motivate himself further, John looks to see how his risk of stroke would be lowered if, over the next 5 years until retirement, he became active (-2 points), reduced his drinking to four drinks per week (-3 points), and quit smoking (-3 points). With this new healthy lifestyle, his projected score at age 65 years is now 60 points, and his risk of stroke is reduced to 7.0%, which represents a substantial risk reduction from his projected course without any lifestyle change (27.8% with no changes to 7% with changes).
Using the Framingham Stroke Calculator7 (assigning untreated systolic blood pressure as 126-135 mm Hg), the risks for these scenarios would be 8% for the status quo, 11% for developing diabetes by age 65 years, and 5% with a modified lifestyle and without diabetes. The risks predicted from the Framingham calculator are somewhat lower than those predicted using the MyRisk_Stroke Calculator because of differences in the weights for smoking and diabetes, which possibly reflect inherent differences in the studied populations. In the Framingham stroke-risk calculator, diabetes and smoking are assigned 2 and 3 points, respectively; for the MyRisk_Stroke Calculator, the corresponding values are 7 and 8 points, respectively. The MyRisk_Stroke Calculator also includes alcohol consumption, inactivity, education, and psychological distress factors in the risk burden.
The above scenario illustrates several important novel features of the MyRisk_Stroke Calculator, including the importance of considering both vascular comorbidities and lifestyle risk factors in the same calculator. Most individuals do not know their exact blood pressure or cholesterol levels, which are required for other stroke-risk calculators but not for the MyRisk_Stroke Calculator, making it much more user-friendly. Importantly, by the time the individual presents with abnormalities in these factors, the damage has already been done to the cardiovascular system and may not be easily reversible.39 In fact, in their guidelines for healthcare professionals from the American Heart Association and the American College of Cardiology, Grundy et al. recommend that "appropriate intervention, guided by risk assessment that is performed periodically in early adulthood and early middle age, has the potential to bring about a significant reduction in long-term risk."39 As younger individuals are unlikely to already have significant abnormalities on clinical markers of atherosclerotic disease, the MyRisk_Stroke Calculator provides a relevant tool for them to assess future stroke risk and take preemptive action. Approaches including lifestyle factors were based on fixed risk profiles,6,9 and did not permit isolation of the contribution of each risk factor. In the aforementioned scenario, smoking contributes much more to John's increased risk of stroke than does his physical inactivity, which may help him prioritize lifestyle changes.
An important caveat for any risk calculator is that the risk of any condition is not necessarily elastic, and so causal inferences should not be made solely on the basis of the MyRisk_Stroke Calculator.8 This means that individuals who successfully modify several risk factors do not necessarily attain the risk of an individual who never had that condition or risk indicator.
Data on several established risk factors for cardiovascular disease, such as cholesterol, glucose, and blood pressure values and diet were not available in this study. However, Gaziano10 demonstrated that the inclusion of cholesterol level in a prediction model for risk of stroke did not significantly affect the fit of that model among either men or women. Vascular comorbidities were identified using records from hospitalizations, physician visits, and self-reports in the survey at cohort entry, which may have resulted in some measurement error. The development of comorbidities over the follow-up period were also not included, since it was felt that these ensued from the baseline risk profile, and hence formed part of the causal pathway. They were also treated as binary variables, and the effect of severity was not taken into account. The low-risk weight assigned to some vascular comorbidities likely reflects treatment effectiveness. Occurrences of stroke were identified using records from the hospitalization database. Several previous studies, including some in Quebec, have validated the use of ICD-9 codes to identify strokes in many different populations, and found high positive predictive values, negative predictive values, and sensitivity.12,40-43
The measurement of stroke status was particularly important in this study, since all risk estimates are based on the number of strokes identified. If the number of strokes that occurred in the sample were substantially underestimated, then all of the risk estimates provided by the MyRisk_Stroke Calculator would be underestimated. However, use of the hospital discharge and death-certificate databases allowed us to follow this large sample and ensured a very low dropout rate during the follow-up. The MyRisk_Stroke Calculator met 13 of the 17 criteria of a clinical prediction rule defined by Laupacis et al.44 Although the Lemeshow and Hosmer16 method was used to evaluate how well the model was able to discriminate between individuals at a high and low risk of stroke, further studies are needed to prospectively validate the MyRisk_ Stroke Calculator in different populations. The cohort in the present study was relatively young and there were few events, thus possibly limiting the ability to include interaction effects in this model due to an insufficient statistical power, which may limit the generalizability of the MyRisk_Stroke Calculator to older individuals. Therefore, the MyRisk_Stroke Calculator is not necessarily appropriate for use in individuals older than 75 years; a 5-year stroke risk may be more appropriate for that population. Although a split-sample approach involving "development" and "validation" cohorts was used to develop and validate the estimates for the MyRisk_Stroke Calculator, this reduces the power and introduces instability into the estimates. Therefore, the estimates from the model were reported with both surveys combined. Before this prototype is ready for application for personal use or in clinical practice, it would need to be further validated, preferably in an independent sample.
The MyRisk_Stroke Calculator is a simple-to-use method of disseminating risk information to the general population and may serve as an additional strategy for primary prevention. Physicians could use the calculator to open a dialogue with their patients and engage them actively in risk reduction. While prospective studies are needed to test the validity of the MyRisk_Stroke Calculator, the engagement of people in reducing their own risk of stroke is an ongoing challenge and needs to be the focus of research into knowledge translation.
 XML Download