

 PDF
PDF ePub
ePub Citation
 Print
Print


Introduction
Septic shock remains a leading cause of death, despite advances in critical care management [1]. Septicemia is currently ranked as the 11th leading cause of death in the United States [1]. In 2001, Rivers et al. [2] showed that early goal-directed therapy (EGDT) could decrease mortality in patients with severe sepsis and septic shock. Since that initial report, multiple studies have provided evidence that EGDT reduces morbidity and mortality in patients with septic shock [345]. Because of the surprising benefit of the Surviving Sepsis Campaign (SSC) resuscitation bundle in decreasing mortality, our institute implemented EGDT and SSC resuscitation bundles using a multidisciplinary team model [6].
However, there were several findings about mortality of EGDT-based bundle therapy than usual care [789]. Yearly et al. performed a randomized multicenter trial for 1,341 patients. And they found that there were no significant differences in 60-day mortality among protocol-based EGDT, protocol-based standard therapy and usual care [7].
Because there is controversy about benefits of implementation of SSC bundles clearly helps to decrease mortality, further improvement of the survival of patients with septic shock requires the identification of subgroups with risks of mortality. Thus, we aimed to identify risk factors for mortality in patients with septic shock who were treated with SSC bundles.
Materials and Methods
1. Surviving sepsis campaign bundle implementation and study population
This retrospective cohort study was conducted at a tertiary care teaching hospital in Seoul, South Korea. We reviewed the medical records and laboratory data of all patients with septic shock who received treatment following SSC bundles between November 2007 and November 2011. The data were retrospectively collected using standardized forms.
Since November 2007, SSC bundles have been implemented in the intensive care units (ICUs) and emergency department (ED) of our institute as part of a quality improvement initiative. Our hospital is a 2,000-bed academic hospital, with a total of 105 ICU beds (53 medical/surgical, 22 dedicated to cardiothoracic surgery and cardiology, and 30 for neuroscience).
The process of screening a patient for SSC bundle began with the ED physician. Eligibility for SSC bundle was assessed in patients with two or more systemic inflammatory response syndrome criteria and suspected infection in emergency department. Initiation of our SSC protocol was triggered by (a) initial systolic blood pressure <90 mmHg, despite a 20mL/kg intravenous crystalloid fluid challenge; and/or (b) initial serum lactate level ≥4 mmol/L. The exclusion criteria were: (a) age <15 years, (b) contraindication to central venous catheterization, and (c) do-not-resuscitate (DNR) status. When appropriate, collaborative teams were notified via mobile telephone that a patient met all criteria. The patient was transferred to the ICU as soon as possible, and an infectious disease physician selected an appropriate empiric antibiotic. This process included the initiation of an aggressive, evidence-based care protocol focused on achieving a mean arterial pressure (MAP) ≥65 mmHg, central venous pressure (CVP) ≥8 mmHg, and central venous oxygen saturation ≥70% within 6 h.
Based on the best practices at the time, our SSC protocol also included recommendations for the use of stress-dose steroids for patients with refractory shock, low-tidal-volume ventilation for acute lung injury or acute respiratory distress syndrome (ARDS), and intravenous insulin to control hyperglycemia with a validated protocol for dose adjustment. However, we did not use activated protein C because it was not available in Korea.
2. Variables and definitions
Data on patients’ demographic characteristics, clinical variables, and hospital resources used were collected, including the duration(in days) of hospitalization, age, sex, body mass index, vital signs, underlying disease, site of infection, severity of illness (classified using Acute Physiology and Chronic Health Evaluation II (APACHE II) [10] and Sequential Organ Failure Assessment (SOFA) [11] scores at the time of ER presentation), laboratory results, antimicrobial therapy regimen, in vitro effectiveness of empirical antimicrobial agents, isolated pathogens, and antimicrobial susceptibility of bacteria. In addition, we assessed data related to the sepsis-specific therapies that were applied, such as transfusion, ventilator care, hemodialysis, and corticosteroid, insulin, and antithrombin use. Severe sepsis was defined as sepsis associated with organ dysfunction, hypoperfusion, or hypotension [12]. Hypoperfusion and hypotension abnormalities included, but were not limited to, lactic acidosis, oliguria, and acute alteration of mental status. Septic shock was defined as sepsis-induced hypotension despite adequate fluid resuscitation in the presence of perfusion abnormalities [12]. Patients who were receiving vasopressor agents were considered to have hypotension, regardless of hypotensive status at the time of perfusion abnormality measurement. Neutropenia was defined as an absolute neutrophil count <500 cells/mm3 [13]. Standard Centers for Disease Control nosocomial infection definitions were used to define the sites of infection [14].
ARDS was defined according to the classification of the American European Consensus Conference [15]. Initial antimicrobial therapy was considered to have been appropriate when all causative microorganisms were susceptible at least one administered antimicrobial agent within 24 h of culture sample acquisition [16]. Inappropriate therapy referred to the administration of an antimicrobial agent to which at least one causative microorganism was resistant, or to the lack of antimicrobial therapy for the known causative pathogen. Therapy was also considered inappropriate when the antimicrobial agent was not administered within 24 h of primary microbial isolation from blood or a remote site of infection. The administration of aminoglycoside monotherapy for non-fermenting gram-negative bacilli was considered inappropriate [17].
3. Data analyses
The primary and secondary endpoints were all-cause 7-and 28-day mortality.
Continuous variables are presented as means [standard deviation (SD)] or medians [inter-quartile range (IQR)], and categorical variables are presented as numbers and percentages. For continuous variables, Student’s t test or the Mann-Whitney U test was used depending on the validity of the normality assumption. The chi-square test or Fisher’s exact test was used to assess categorical variables. Potential risk factors for mortality were evaluated by univariate analysis, and factors with P-values <0.05 were included in a multivariate model. To identify independent risk factors for mortality, Cox regression analysis was used to control for the effects of confounding factors. Statistical analysis was performed using SPSS software (version 20.0; SPSS Korea, Seoul, Korea), and P <0.05 was considered to indicate statistical significance.
Results
1. Demographic characteristics and vital signs
Between November 2007 and November 2011, a total of 602 adult patients (aged >15 years) visited the ED due to septic shock. Among these, 115 patients who did not fit our inclusion criteria were excluded. Sixteen patients were transferred to another hospital and four patients were discharged because they did not want to be hospitalized. Thirty-one patients were excluded because they or their families had established DNR status. Thus, a total of 436 patients who received SSC bundles were included in these analyses.
Patients’ demographic characteristics and initial vital signs are shown in Table 1. The mean age was 64.75 ± 14.5 years and 52.75% (230/436) patients were male. The vital signs of surviving patients and those who died were compared. For 7-day mortality, body temperature was significantly higher in survivors than in patients who died (37.99 ± 1.37 vs. 37.25 ± 1.44, P = 0.004). Central venous pressure was significantly lower in surviving patients (7.64 ± 4.2 vs. 9.56 ± 4.57, P = 0.004). For 28-day mortality, MAP was higher in survivors than in patients who died (60.56 ± 11.19vs. 56.49 ± 12.54, P=0.01). Body temperature was higher in patients who survived (38 ± 1.37 vs. 37.51 ± 1.46, P = 0.011), and CVP was lower in those who survived (7.52 ± 4.12 vs. 9.38 ± 4.75, P = 0.002) for 28-day mortality.
Table 1
Demographic and clinical characteristics of the 436 patients at the time of surviving sepsis campaign bundle initiation
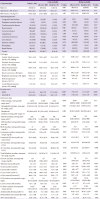
Data are frequencies and percentages in parentheses, unless otherwise indicated.
BMI, body mass index; SOFA, sequential organ failure assessment; APACHE, acute physiology and chronic health evaluation; WBC, white blood cell; ESR, erythrocyte sedimentation rate; BUN, blood urea nitrogen; GFR, glomerular filtration rate; AST, aspartate aminotransferase; ALT, alanine transaminase; CRP, C-reactive protein; INR, international normalized ratio; aPTT, activated partial thromboplastin time.
2. Site of infection and causative pathogen
Pneumonia was the most common infection (28.21%, 123/436), followed by urinary tract infection (25.92%, 113/436; Table 2). Causative organisms were identified in 240 patients (Table 2). Extended-spectrum β-lactamase (ESBL) non-producing Escherichia coli was the most common organism (35.7%, 99/277). The second most common causative organism was ESBL non-producing Klebsiella pneumoniae (16.6%, 46/277).
Table 2
Suspected site of infection and causative pathogen in patients treated with surviving sepsis campaign bundles
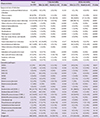
Data are frequencies and percentages in parentheses.
MSSA, methicillin-sensitive Staphylococcus aureus; MRSA, methicillin-resistant Staphylococcus aureus; MSCNS, methicillin-sensitive coagulase-negative staphylococci; MRCNS, methicillin-resistant coagulase-negative staphylococci; MSSE, methicillin-sensitive Staphylococcus epidermidis; MRSE, methicillin-resistant Staphylococcus epidermidis; VRE, vancomycin-resistant enterococci; ESBL, extended-spectrum β-lactamase.
3. Treatment process and clinical outcomes
Several modalities were used to treat septic shock (Table 3). Vasopressors were used in 428 (98.4%) patients. A total of 220 (50.5%) patients received packed red blood cell (RBC) transfusion, and 176 (40.4%) patients received insulin therapy. Corticosteroids and antithrombin III were used in 158 (36.2%) and 44 (10.1%) patients, respectively. Ventilator care and hemodialysis treatment were conducted in 118 (27.1%) and 59 (13.5%) patients, respectively. Initial antibiotic treatments were considered to be appropriate in 200/436 (46%) patients. EGDT endpoints were achieved successfully within 6 h in 344/436 (78.9%) cases.
Table 3
Treatment process and clinical outcomes
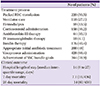
The mean duration of hospitalization was 14 (9 to 27) days. The 7- and 28-day mortality rates were 7.1% (31/436) and 14% (61/436), respectively.
4. Mortality risk factors
In the univariate analysis, 7-day mortality was found to be related to CVP (P = 0.017), Sequential organ failure assessment (SOFA) score (P <0.001), APACHE II score (P <0.001), low white blood cell count (P = 0.046), low platelet count (P = 0.001), low erythrocyte sedimentation rate (P = 0.018), low estimated glomerular filtration rate (eGFR; P <0.001), high aspartate aminotransferase (AST) concentration (P = 0.011), low albumin concentration (P = 0.005), high lactate level (P <0.001), low antithrombin III level (P = 0.001), hemodialysis (P <0.001), ventilator care (P <0.001), and transfusion (P <0.001). In multivariate analysis, high lactate level (odds ratio [OR], 1.286; 95% confidence interval [CI], 1.016–1.627; P = 0.036) and low eGFR (OR, 0.953; 95% CI, 0.913–0.996; P = 0.032) were found to be independently related to 7-day mortality (Table 4).
Table 4
Independent risk factors for mortality of patients with severe sepsis or septic shock treated with surviving sepsis campaign bundles by Cox’s regression analysis
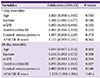
In univariate analysis, 28-day mortality was found to be related to systolic blood pressure (P = 0.023), diastolic blood pressure (P = 0.014), MAP (P = 0.01), CVP (P = 0.002), body temperature (P = 0.011), SOFA score (P <0.001), APACHE II score (P <0.001), low platelet count (P <0.001), high blood urea nitrogen level (P = 0.008), low eGFR (P <0.001), high AST concentration (P = 0.003), low albumin level (P <0.001), high potassium level (P = 0.003), low total carbon dioxide level (P = 0.001), high C-reactive protein level (P = 0.004), high lactate level (P <0.001), low antithrombin III level (P = 0.001), prolonged activated partial thromboplastin time (P = 0.035), transfusion (P <0.001), ventilator care (P <0.001) and hemodialysis (P <0.001). In multivariate analysis, high lactate level (OR, 1.346; 95% CI, 1.083–1.673; P = 0.008) and high APACHE II score (OR, 1.153; 95% CI, 1.029–1.293; P = 0.014) were found to be independently related to 28-day mortality (Table 4).
Discussion
The growing number of patients with septic shock and increased mortality requires changes in ED processes. In 2001, Rivers et al. [2] reported that the use of EGDT as a resuscitation strategy reduced absolute in-hospital mortality by 16%. In 2002, the European Society of Intensive Care Medicine, the International Sepsis Forum, and the Society of Critical Care Medicine launched the SSC. After 3 years, they published the initial guidelines in 2004; revised versions were published in 2008 [18] and 2012 [19]. SSC is a performance improvement process that emphasizes the early detection of infection and institution of antibiotic therapy. Although the SSC resuscitation bundle has been proven to successfully reduce mortality, it could not be used widely in many developing countries because of a lack of resources. Our institute participated in a multi-national, multi-organ study that implemented SSC resuscitation bundles, and education [6]. Our hospital adopted a multidisciplinary sepsis team model of implementation. The resuscitation bundle was initiated in the ED and completed in the ICU. We examined short-term mortality and risk factors of septic shock in this hospital under implementation of the team model of resuscitation.
In our multivariate analysis, high lactate level was independently associated with 7- and 28-day mortality. Blood lactate levels are considered to reflect the magnitude of anaerobic metabolism, and their use is recommended in guidelines and included in resuscitation bundles as an indicator of organ hypoperfusion and shock, although the etiology of lactate elevation is open to dispute. Lactate is known to be a target endpoint, an indicator of severity, and a predictor of short- and long-term mortality. Elevation of lactate is thought to be associated with poor outcomes, such as increased mortality [20]. Nguyen et al. [21] suggested that resuscitation bundles including lactate clearance are more effective than those that do not include this component. Although high lactate level was significantly associated with mortality in the present study, this finding is limited in that only initial lactate levels were measured and no data on lactate clearance were obtained. Low eGFR was independently associated with 7-day mortality in this study, as in several other studies [2223]. We could not figure out the possible explanation on the association between lower ESR and mortality. The APACHE II scoring system is a good tool for the prediction of sepsis severity in critically ill patients [10]. In our study, higher APACHE II scores were associated with higher 28-day mortality (P = 0.014). Radical calculation of the APACHE II score is derived from the worst values in the first 24 h after ICU admission [24]. However, in this study, we met our patients in the ED first, facilitating the collection of physiological data on admission. A retrospective cohort study by Ho et al. [24] suggested that the admission APACHE II model is a potential alternative to the worst 24 h APACHE II model in patients in critical condition but without trauma. Park et al., in their prospective, multi-center, observational study, investigated about risk factors for mortality in patients with community-acquired severe sepsis and septic shock. In the multivariate analysis, cancer, APACHE II score, SOFA score and metabolic dysfunction were independent clinical factors for gender-related in-hospital mortality in their study [25]. APACHE II score was also independent risk factor for mortality in our study, but other factors were different. Because of differences in study methods and design including only community-acquired, maybe such different results have occured. Drumheller et al., in their retrospective, single-center observational cohort study of severe sepsis and septic shock patient in ED, identified that age, active cancer, diabetes, DNR status on ED arrival, temperature never >38°C, glucose <60 mg/dL, intubation, and lactate clearance were independently associated with in-hospital mortality [25]. However, their study also has differences with our study in patient characteristics.
Puskarichet et al. [4] reported a 1-year mortality rate of 37% (77/206) in patients with severe sepsis and septic shock who were treated at the Carolinas Medical Center. A 2009 study showed that mortality decreased from 27% to 19% after EGDT implementation in the pre-intervention phase [3]. The 7- and 28-day mortality rates in our study (7.11% and 14%) were lower than in previous studies. The lower mortality in our cohort groups might indicate that they were less critically ill than groups evaluated in other studies. Otherwise, the low mortality rate observed in our hospital may be due to the Korean health care system or the practices of our institution. The Korean health care system offers easy access to medical care to all patients, irrespective of health insurance status. Moreover, our hospital is located in an urban area with a high socioeconomic level. These differences emphasize the need for each institution to assess its own population. The mortality rate in our study was lower than other study from South Korea [26]. The reasons for this difference might be caused by differences in the focus of infection and causative pathogens. For example, in this study, ESBL-negative E. coli which can be treated easily was much frequently isentified as a causative pathogen than other study [26].
The most common focus of infection in our study cohort was pneumonia. Urinary tract infection was also a common focus of infection in patients who survived, but was not a main cause of death. The most common causative microbiologic organism in the group who survived was ESBL-negative E. coli. Few microbiologic sources were identified in pneumonia cases, but many were identified in urinary tract infection cases. E. coli seemed to be the most common causative organism in survivors who received SSC bundles.
Park et al., in their large observational study, found that patients who received RBC transfusion had higher 28-day and in-hospital mortality rates than those who did not. But they found that after adjusting for possible confounding factors and severity of illness, RBC transfusion was associated with lower risk of 7-day, 28-day, and in-hospital mortality [27]. In our study, transfusion was risk factor of 7-day and 28-day mortality. Probably, the different results came out from not adjusting such confounding factors.
Our study has several limitations, such as its retrospective design and the use of a single medical center as the source of data. Our retrospective evaluation prevented the examination of risk factors in a randomized situation. Usually, the APACHE II score is determined using the worst 24-h score after admission, but we first met our patients in the ED and collected physiological data on admission. Thus, we applied the APACHE II score obtained at the time of admission. And recently there is emerging on suspicion on the need for the protocol-based bundle therapy. But our sepsis team model of implementation make treatment faster and might reduce mortality of patients. In this study, we did not evaluate the differences of outcomes and risk factors according to the achievement of EGDT goal, and we did not measure the adherence on SSC bundles. In addition, we used the previous definition of septic shock, and further study based on the revised definition of septic shock should be performed. In conclusion, the risk of mortality of septic shock patients remains high in patients with high lactate levels and acute kidney injury.
 XML Download