

 PDF
PDF ePub
ePub Citation
 Print
Print


INTRODUCTION
N-myc downstream regulated gene 2 (NDRG2), a member of a new family of genes involved in cell differentiation, is normally expressed in the brain, heart, and muscle (1). It has also been reported that NDRG2 is expressed specifically in dendritic cells (DCs) differentiated from monocytes or CD34+ progenitor cells (2). NDRG2 expression in breast cancer cells has been shown to inhibit activation of signal transducer and activator of transcription 3 (STAT3) via induction of suppressor of cytokine signaling 1 (SOCS1) (3). NDRG2 has several roles in cell growth, differentiation and apoptosis, but its function remains to be clarified (2,4).
In a previous report, we found a possible role for NDRG2 in regulating the cytokine, interleukin-10 (IL-10). IL-10 is an important anti-inflammatory cytokine with a crucial role in preventing inflammatory and autoimmune pathologies (5). IL-10 functions as an immune suppressor and can also promote the growth of lymphocytes in vivo (6). As IL-10 limits the immune response to pathogens, this cytokine thus prevents damage to the host. IL-10 is produced by T cells, B cells, dendritic cells, and monocytes/macrophages, and its immunosuppressive activity has been documented in IL-10 knockout mice, which have increased autoimmune disease and increased resistance to infection (7-9). Because of its production by many immune cells, IL-10 clearly plays a crucial role as a feedback regulator of diverse immune responses. IL-10 mediates its effect by binding to the heterodimeric IL-10 receptor (IL-10R); Jak1 and Tyk2 are then transphosphorylated and activated, and these molecules subsequently activate the downstream transcription factor, STAT3, and in some cases, STAT1 and STAT5 (10-12). There are several mechanisms of regulation of IL-10 expression, and this regulation is different depending on the type of cell or location. Currently, studies investigating immunosuppressive processes of diverse cells or formation and maintenance of regulatory T cells by IL-10 are being performed (13).
p38 mitogen-activated protein kinase (p38-MAPK), nuclear factor-κB (NF-κB) and JAK/STAT pathways are the known signaling pathways for innate IL-10 production (14,15). In particular, activation of STAT3 is essential for the effects of IL-10 (16). Macrophages increase their production of IL-10 by activating STAT3 in an autocrine fashion, and the activated STAT3 then plays an important role in inhibiting the activation of macrophages and neutrophils (7). In mouse T cells, the induction of IL-10 by IL-27 depends on both STAT1 and STAT3, and STAT3 is also involved in IL-6-mediated IL-10 expression (17-19). By contrast, a recent study in human monocytes describes an inhibitory role for IL-27 on IL-10 production through STAT1 (20). Another study suggests that IL-10 induces its own expression by human monocyte-derived macrophages in an autocrine manner through the activation of STAT3 (7).
Activated STATs dimerize and migrate to the nucleus where they activate the transcription of specific genes among; some of these genes are members of the suppressors of cytokine signaling (SOCS) family (21). SOCS proteins (SOCS1-7 and cytokine-inducible SH2-containing protein (CIS)) negatively regulate cytokine signaling pathways (22). The inducible SOCS3 protein inhibits the JAK/STAT pathway in a negative feedback loop using a variety of mechanisms (23). In addition, it is known that SOCS3 plays an important role in the negative regulation of inflammatory responses via the induction of IL-10. Among SOCS family members, SOCS1, SOCS3 and SOCS5 are mainly involved in the regulation of IL-4 and IL-10 pathways. Both SOCS1 and SOCS3 inhibit JAK tyrosine kinase activity via their N-terminal kinase inhibitory region. SOCS1 directly binds to the activation loop of JAK molecules through its Src-homology 2 domain, whereas SOCS3 inhibits the action of JAK molecules only in the presence of a receptor that it binds (24). However, both SOCS1 and SOCS3 are activated by IL-4 or IL-10 and function as potent inhibitors of IL-4/STAT6 or IL-10/STAT3 activation (25). It has been reported that targeted deletion of SOCS3 in macrophages results in markedly enhanced IL-6-induced STAT3 activation (26).
Monocytes are known to be one of the major sources of IL-10. In this study, we used the human monocytic cell line, U937, which was derived from malignant cells obtained from the pleural effusion of a patient with histiocytic lymphoma in 1974. U937 cells display many characteristics of monocytes and have thus served as a model for the differentiation of monocytes and macrophages in vitro. This cell line matures and differentiates in response to a number of soluble stimuli and adopts the morphology and characteristic features of mature macrophages. Herein, we generated NDRG2-overexpressing U937 cells and treated them with a stimulus to investigate the role of NDRG2 in IL-10 production. We also investigated whether the IL-10 signaling pathway was modulated via SOCS3 and STAT3.
MATERIALS AND METHODS
Cell culture and treatment
U937 cells were grown in RPMI (Gibco/Invitrogen, Carlsbad, CA) supplemented with 10% heat-inactivated fetal bovine serum (Gibco). Cells were maintained in an atmosphere of 5% CO2 in a 37℃ humidified incubator. Phorbol 12-myristate 13-acetate (PMA) was purchased from Sigma-Aldrich (St. Louis, MO) and cucurbitacin I, a selective inhibitor of JAK/STAT3, and AG490, an inhibitor of constitutive STAT3-DNA binding, were purchased from Calbiochem (Merck KGaA, Darmstadt, Germany).
Transfection
The NDRG2 gene was cloned into the pcDNA3.1 vector (Invitrogen, Carsbad, CA) and the resulting pcDNA3.1-NDRG2 plasmid was introduced into U937 cells by electroporation with a Gene Pulser (Bio-Rad, Hercules, CA) at 960µF and 300 V. Transfectants resistant to 1 mg/ml G418 (Sigma) were screened for NDRG2 expression. NDRG2 expression was confirmed by RT-PCR and western blotting. NDRG2-expressing cells were expanded in culture for further study.
RNA interference
The SMARTpool siRNA specific for human SOCS3 was purchased from Dharmacon (Lafayette, CO), and NDRG2-specific siRNA and control non-targeting siRNA were purchased from Santa Cruz Biotechnology (Santa Cruz, CA). U937-mock and NDRG2-overexpressing cells were transfected with 100 nM of control, SOCS3- or NDRG2-specific siRNAs using an Amaxa Nucleofector™ (program V-001, Amaxa, Cologne, Germany). After transfection, cells were immediately placed in a 37℃ humidified incubator.
Reverse transcription (RT)
Total RNA from harvested cells was isolated using TRI reagent (Molecular Research Center, Cincinnati, OH) and 5µg of total RNA was reverse transcribed (RT) into cDNA. For the RT reaction, RNA was first incubated with an oligo-(dT) primer at 70℃ to denature the RNA secondary structure and then incubated at room temperature for 10 min to allow the primer to anneal to the RNA. Other components of the RT assay, including dNTPs (Bioneer, Daejeon, Korea), M-MLB reverse transcriptase, and RT buffer (Promega, Madison, WI), were then added to the reaction. The RT reaction was performed at 37℃ for 1 h and then at 100℃ for 5 min. The RT product was then used as a template for a 20µl PCR reaction.
Polymerase chain reaction (PCR)
Oligonucleotide primers for PCR were designed according to the published sequences (GenBank). PCR primers were purchased from Bioneer, or GENOTECH (Daejeon, Korea). The following primer sequences were used: β-actin: 5'-cca cac ctt cta caa tga gc-3' (sense), 5'-tga ggt agt cag tca ggt cc-3' (antisense); NDRG2: 5'-gga ttc atg gcg gag ctg cag gag g-3' (sense), 5'-gaa ttc tca aca gga gac ctc cat ggt-3' (antisense); IL-10: 5'-gat gcc ttc agc aga gtg aag a-3' (sense), 5'-cat ggc ttt gta gat gcc ttt c-3' (antisense); SOCS1: 5'-aga ccc ctt ctc acc tct tg-3' (sense), 5'-ctg cac agc aga aaa taa agc-3' (antisense); SOCS2: 5'-gga tgg tac tgg gga agt atg act-3' (sense), 5'-agt gga tca gat gaa cca cac tct-3' (antisense); SOCS3: 5'-cac atg gca caa gca caa ga-3' (sense), 5'-aag tgt ccc ctg ttt gga gg-3' (antisense); SOCS4: 5'-aga gaa ggt cct atg act gg-3' (sense), 5'-ggg cat cga tgc cat cat aa-3' (antisense); SOCS5: 5'-cag ttc tgc aat tcc aca ag-3 (sense), 5'-gac tgg ttc tcg ttc caa cc-3 (antisense). PCR products were electrophoresed on a 1% agarose gel and visualized by ethidium bromide staining.
Western blot analysis
U937 cells were treated with the indicated concentration (50 ng/ml) of PMA for 0~24 h. The treated cells and untreated control cells were washed with PBS (WelGENE, Daegu, Korea) and immediately resuspended in ice-cold lysis buffer (M-PER® Mammalian protein extraction reagent, Pierce, Rockford, IL) for 20 min. Supernatant fractions were recovered by centrifugation at 12,000 rpm for 15 min. For immunoblotting, cell lysates containing equivalent amounts of total protein were mixed with 5X sample buffer and resolved on a SDS-polyacrylamide gel. Separated proteins were transferred to a Hybond-P (Amersham Biosciences, Burkes, UK) membrane. Membranes were incubated in 5% skim milk (BD Biosciences, San Jose, CA) in TBS-T (20 mM Tris-HCL, pH 7.5, 137 mM NaCl, 0.05% tween-20) for 1 h at room temperature, washed with TBS-T and incubated with primary antibody overnight at 4℃. The membranes were washed with TBS-T and incubated with secondary antibody for 2 h at room temperature. Protein bands were visualized by enhanced chemiluminescence (SuperSignal West Pico Chemiluminescent Substrate, Pierce, Rockford, IL) using a LAS 3000 imaging system (FUJIFILM Corporation, Tokyo, Japan).
Antibodies for western blotting
Antibodies against the following proteins were used in this study: STAT3 and phospho-STAT3 (Tyr705) (Cell Signaling, Danvers, MA); SOCS1, SOCS2, SOCS3, and actin (Santa Cruz, CA); NDRG2 (produced by our laboratory). Peroxidase-conjugated AffiniPure goat anti-rabbit IgG (Jackson Immuno-Research Laboratories, West Grove, PA), bovine anti-goat IgG HRP(Santa Cruz), and goat anti-mouse IgG (Sigma-Aldrich) were also used.
Cell proliferation using MTT assay and hemocytometer
Cells (2×10⁴ cells/well) were cultured in 96-well culture plates for 24 h and treated with MTT (3-(4,5-dimethylthiazol-2-yl)-2,5-diphenyltetrazolium bromide) for 2 h. Cells were harvested and centrifuged at 1,200 rpm for 5 min. The pellets were dissolved in 200µl DMSO. Absorbance was measured at 540 nm using an ELISA reader (Victor 3™, PerkinElmer, Waltham, MA). For cell counting by microscope, cells (1×10⁴ cells/well) in 6-well culture plates were cultured for 1 to 4 days and centrifuged at 1,200 rpm for 5 min. Viable cells, which are visible by light microscopy, were enumerated using a hemocytometer.
Cytokine detection by ELISA
IL-10 production was assessed after 24 h in culture by collecting the supernatants from U937 cells (3×10⁵ cells/ml) that had undergone PMA treatment. IL-10 levels were measured using the human IL-10 ELISA kit (Peprotech, Rocky Hill, NJ) according to the manufacturer's instructions. Each sample was tested in duplicate and quantified using the Multi Detection Microplate SpectraMax M5 (Molecular Devices, Sunnyvale, CA) at 405 nm and 650 nm absorbance.
RESULTS
NDRG2 inhibits IL-10 production in U937 cells
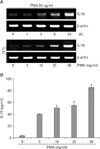
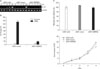
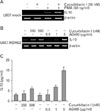
To examine IL-10 production in U937 cells, cells were stimulated with 50 ng/ml of PMA, and IL-10 mRNA was measured by RT-PCR. IL-10 expression increased in a time-dependent manner upon PMA stimulation in U937 cells (Fig. 1A). After 12 h of stimulation with PMA, IL-10 transcripts increased in a dose-dependent manner. Similarly, PMA treatment induced IL-10 protein production in U937 cells when measured by ELISA (Fig. 1B). We hypothesized that NDRG2 gene expression might inhibit IL-10 production. To determine the relationship between NDRG2 and IL-10 expression, U937-mock cells and U937 cells overexpressing NDRG2 (U937-NDRG2) were treated with PMA, and IL-10 mRNA levels were determined by RT-PCR. As shown in Fig. 2A, IL-10 mRNA in U937-NDRG2 cells was suppressed compared to wild type or mock-transfected cells. The measurement of IL-10 by ELISA showed that whereas IL-10 production was remarkably increased in U937-mock cells upon PMA stimulation, it was strongly reduced in U937-NDRG2 cells (Fig. 2B). Although overexpression of the gene itself did not affect cell proliferation (Fig. 2C), IL-10 production was corrected based on cell numbers because U937-NDRG2 cells showed growth rate faster than wild-type cells upon PMA stimulation (data not shown). These data indicate the negative effect of NDRG2 expression on both IL-10 protein production and IL-10 expression levels.
Expression of IL-10 and SOCS genes upon PMA stimulation
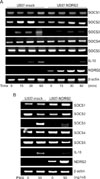
Based on our previous report (3), we hypothesized that NDRG2 might inhibit IL-10 production through SOCS and STAT signaling. SOCS genes (SOCS1-5) have emerged as key physiological regulators of cytokine responses, including those that regulate the immune system (27). To test this hypothesis, U937-mock and U937-NDRG2 cells were treated with PMA (50 ng/ml) for 0, 15, 30, and 60 min and SOCS gene expression was detected by RT-PCR. Interestingly, SOCS3 expression was significantly upregulated upon PMA stimulation in U937 cells but was only slightly increased in U937-NDRG2 cells. In contrast, there was no significant difference in the levels of other SOCS family members (SOCS1, 2, 4, 5) between U937-mock and U937-NDRG2 cells (Fig. 3A). These expression patterns were maintained at 24 h after PMA treatment (Fig. 3B). Although PMA treatment appeared to slightly increase NDRG2 transcript levels as a result of the vector used for the transfection, its effect on protein level was negligible (see below). These results indicate that NDRG2 expression inhibits IL-10 induction in U937 cells when cells are simulated with PMA, and the expression pattern of SOCS3 mirrors that of IL-10.
Effect of NDRG2 expression on SOCS3 and STAT3 expression after PMA stimulation
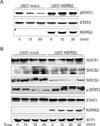
IL-10 production has effects on many immune cells, affirming its crucial role as a feedback regulator of diverse immune responses (15). As mentioned above, p38-MAPK, NF-κB and JAK/STAT pathways are known signaling pathways for innate IL-10 production. In particular, STAT3 has an important role in IL-10 production and is associated with several cellular signals. In addition, it has been reported that targeted deletion of SOCS3 in macrophages results in markedly enhanced STAT3 activation (28). When we measured activation of STAT3, we found that phosphorylated STAT3 levels significantly decreased in U937-mock cells after PMA stimulation, whereas these levels were largely unchanged in U937-NDRG2 cells (Fig. 4A). Because we observed decreased levels of SOCS3 mRNA when NDRG2 was overexpressed, SOCS3 expression and STAT3 phosphorylation were examined together. After PMA stimulation, protein levels of SOCS1, 2, and 3 and phoshporylated STAT3 were assessed by western blot at various time points. The data showed that phosphorylated STAT3 decreased in a time-dependent manner in U937-mock cells, but not in U937-NDRG2 cells (Fig. 4B). In contrast, SOCS3 levels were decreased in cells overexpressing NDRG2 but maintained at high levels in U937-mock cells. As SOCS1 and SOCS2 proteins remained at basal levels during the experimental times, it appeared that the inhibitory effect of NDRG2 is SOCS3-specific. Therefore, NDRG2 inhibits SOCS3 expression and maintains STAT3 phosphorylation under conditions of PMA stimulation.
Increased IL-10 production upon STAT3 inhibition
To determine whether STAT3 inhibition affected IL-10 production induced by PMA, cells were pretreated with the STAT3 inhibitor, cucurbitacin I, for 2 h and further incubated with PMA for 48 h. As shown in Fig. 5A, IL-10 expression in U937-mock cells was enhanced upon PMA treatment, but it was markedly increased by pretreatment with cucurbitacin I, indicating a role for STAT3 in inhibiting IL-10 production. In line with these data, IL-10 expression in U937-NDRG2 cells after PMA stimulation was also significantly upregulated by pretreatment with cucurbitacin I or AG490 (Fig. 5B). Although the level of IL-10 transcripts was relatively low, increased levels of IL-10 protein in U937-NDRG2 cells was also observed after pretreatment with STAT3 inhibitors followed by PMA stimulation (Fig. 5C). Together, these data suggest that high levels of phosphorylated STAT3 in NDRG2-transfected U937 cells may play a role in the inhibition of IL-10 upon stimulation with PMA.
Effect of SOCS3- or NDRG2-specific siRNAs on U937 proliferation
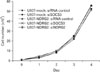
Next, to test whether inhibition of SOCS3 affected IL-10 production, U937-mock and U937-NDRG2 cells were transfected with specific small interfering RNAs (siRNAs; siRNA control, siSOCS3, siNDRG2). We first examined the proliferation capacity of siRNA-transfected cells by plating the cells in 60 mm dishes and counting the cells daily for 4 days using a hemocytometer. The data showed that there were no differences in cell proliferation between the five cell types (Fig. 6).
IL-10 is down-regulated upon SOCS3 inhibition and recovered upon NDRG2 inhibition
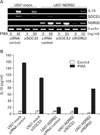
To determine the effects of SOCS3 inhibition on IL-10 mRNA levels, siRNA-transfected U937-mock and U937-NDRG2 cells were stimulated with PMA, and gene expression was assessed by RT-PCR. First, we measured the level of SOCS3 and NDRG2 expression in siRNA-transfected cells to confirm the knockdown of the genes. As shown in Fig. 7A, SOCS3 expression was attenuated upon transfection with siSOCS3 in both U937-mock and U937-NDRG2 cells, and NDRG2 expression was attenuated upon transfection with siNDRG2 in U937-NDRG2 cells. Interestingly, reduced levels of SOCS3 elicited the down-regulation of IL-10 mRNA in U937-mock cells, and IL-10 mRNA levels were recovered in U937-NDRG2 cells upon knockdown of NDRG2. These results suggest that SOCS3 could be involved in IL-10 induction in U937 cells. Because the induction of IL-10 mRNA appeared to be associated with SOCS3 expression in U937-mock and U937-NDRG2 cells, we investigated whether IL-10 protein levels were also being decreased by SOCS3 inhibition. U937-mock and U937-NDRG2 cells were cultured for 24 h with PMA, and IL-10 production was measured by ELISA. As shown in Fig. 7B, IL-10 levels in U937-mock cells transfected with siSOCS3 were significantly reduced, whereas IL-10 levels in U937-NDRG2 cells remained unchanged in both control siRNA- and siSOCS3-transfected cells. The latter result indicates that SOCS3 expression was already down-regulated by NDRG2-overexpression in U937-NDRG2 cells. As with the mRNA expression data in Fig. 7A, IL-10 protein production was restored by knockdown of NDRG2. Thus, NDRG2 expression exerts a negative effect on IL-10 production through the modulation of SOCS3 and STAT3.
DISCUSSION
NDRG2, a member of the N-myc downstream-regulated gene family that includs NDRG1-4, is highly expressed in many normal cells and tissues but it is expressed at low levels or not at all in various tumors and tumor cell lines (29). NDRG2 is generally not expressed in monocytes or macrophages but is specifically expressed in dendritic cells (DCs) differentiated from monocytes, CD34+ progenitor cells, and the myelomonocytic leukemic cell lines. In addition, it has been reported that NDRG2 expression in DCs modulates the T-cell stimulating capabilities of DCs via co-stimulatory factor expression (30). Therefore, NDRG2 may regulate immune responses via
secretion of cytokine such as IL-10 or IL-12.
Phorbol 13-myristate 12-acetate (PMA) is a known activator of protein kinase C (PKC) and the Raf/MEK/Erk pathway (31,32). It has been reported that preincubation of cells with PMA inhibits the IL-6-induced STAT3 and STAT1 activation (33,34). This negative effect was found to be dependent on the activation of MAP kinases and transcription and protein synthesis. Because PMA leads to a rapid upregulation of SOCS3, a negative regulator of the JAK/STAT pathway, it is conceivable that the inhibitory effect of PMA on the JAK/STAT pathway is mediated by SOCS3 (35). In the present study, we chose PMA as a stimulator for IL-10 induction to investigate SOCS3 and STAT3 signaling.
We used the NDRG2-transfected human monocytic cell line, U937, to determine whether the overexpression of NDRG2 in U937 cells affected the ability of cells to produce IL-10. Our results showed that whereas IL-10 mRNA after PMA stimulation increased in U937-mock cells, it was significantly suppressed upon NDRG2 expression. As we were interested in SOCS3 signaling for IL-10 induction, mRNA levels of SOCS genes (SOCS1-5) were investigated. Interestingly, SOCS3 expression increased upon PMA stimulation in U937-mock cells but was not significantly changed in U937-NDRG2 cells, whereas the levels of other SOCS genes (SOCS1, 2, 4, 5) showed no significant difference between U937-mock and U937-NDRG2 cells. Based on these data, it is reasonable to assume that IL-10 production is affected by SOCS3 expression.
STAT3, one of signaling molecules that controls IL-10 production, is unphosphorylated and resides in the cytoplasm in normal resting cells. However, in response to various stimuli, STAT3 is activated through phosphorylation of tyrosine 705 or serine 727, which promotes its homodimerization and subsequent entry into the nucleus where the homodimers activate transcription (36). In particular, activation of STAT3 via phosphorylation of the tyrosine 705 residue induces the transcription of genes involved in inflammatory responses and cell proliferation and differentiation. STAT3 in immune cells can also induce genes involved in the inhibition of innate and adaptive immune responses that render resistance to tumors, and so it is expected that STAT3 negatively regulates immuneresponses against tumors (37).
SOCS proteins are controlled in a STAT-dependent manner and inhibit the JAK/STAT pathway by a negative feedback loop. It has been reported that activation of ERK is essential for SOCS3 induction by either cyclic AMP or PKC (38). In recent years, the SOCS proteins, which were first identified as rapidly inducible negative regulators of cytokine signaling, have emerged as key modulators of the cellular response to numerous biological stimuli. The SOCS proteins regulate the duration of the cytokine signaling response by both specific and non-specific regulatory mechanisms (39). Overexpression of SOCS3 in cell lines has shown that SOCS proteins can inhibit many cytokine-induced responses (23). For example, it has been reported that SOCS3 overexpression in human periodontal ligament (PDL) cells reduces the phosphorylation in downstream signaling molecules including STAT (40). Furthermore, enhanced SOCS3 gene expression has been found to promote IL-10 production, suggesting that STAT3 and SOCS3 may play an important role in regulation of cytokine-induced anti-inflammatory responses (41).
We examined protein levels of STAT3 and SOCS3 by western blot after PMA stimulation to determine the relationship between IL-10 production and STAT3, SOCS3, and NDRG2 expression. We found that phosphorylated STAT3 was decreased in a time-dependent manner in U937-mock cells, but it was unchanged in U937-NDRG2 cells. By contrast, SOCS3 was suppressed in cells overexpressing NDRG2 but maintained at high levels in U937-mock cells. Increased SOCS3 expression after PMA stimulation might promote IL-10 production. The fact that SOCS3 levels were reduced by NDRG2 overexpression but STAT3 levels were maintained suggests that the negative feedback of SOCS3 was blocked. Blocking of STAT3 by specific inhibitors, such as cucurbitacin I, resulted in increased IL-10 production in both U937-mock and U937-NDRG2 cells, indicating a critical role for STAT3 in signaling for IL-10 production.
To investigate the role of SOCS3 in IL-10 production in the context of NDRG2 expression, U937-mock and U937-NDRG2 cells were transfected with specific siRNAs (siRNA control, siSOCS3, siNDRG2). Upon stimulation with PMA, IL-10 mRNA was decreased in U937-mock cells after siRNA-mediated knockdown of SOCS3. Although there is a great deal of evidence showing that SOCS3 can interfere with cytokine-induced phosphorylation of STAT3 in immune cells (42,43), it is presently unclear whether STAT3 recovery is directly responsible for the reduction of IL-10 in SOCS3-specific siRNA-transfected cells. Nonetheless, together with enhanced IL-10 gene and protein expression upon treatment with STAT3 inhibitors, our data clearly indicate that PMA-induced SOCS3 expression negatively regulates STAT3, leading to increased production of IL-10. In this context, our data support the hypothesis that SOCS3 induced by IL-10 can participate in the inhibition of STAT3 that results in reduced expression of proinflammatory molecules.
In this study, we report that SOCS3 expression was reduced by NDRG2-overexpression in U937-NDRG2 cells, and the decreased IL-10 production was restored by NDRG2 inhibition. These results indicate that NDRG2 inhibits IL-10 production through the inhibition of SOCS3 upon PMA stimulation. Taken together, our data suggest that NDRG2 expression modulates SOCS3 and STAT3 activity, leading to the inhibition of IL-10 production. Further study is required to identify the detailed mechanism of NDRG2 effects associated with MAPK or other possible signaling pathways on IL-10 production.
 XML Download