Abstract
Background
Obtaining a venous blood sample from infants and children can be a painful and traumatic procedure. It has been suggested that capillary blood samples can serve as substitutes for venous blood samples to diagnose anemia. However, few data exist about the correlation between the laboratory results obtained using capillary and venous blood samples. This study was performed to determine if the results from the LC-178CRPTM are the same as the results from a conventional hematology analyzer using venous blood.
Methods
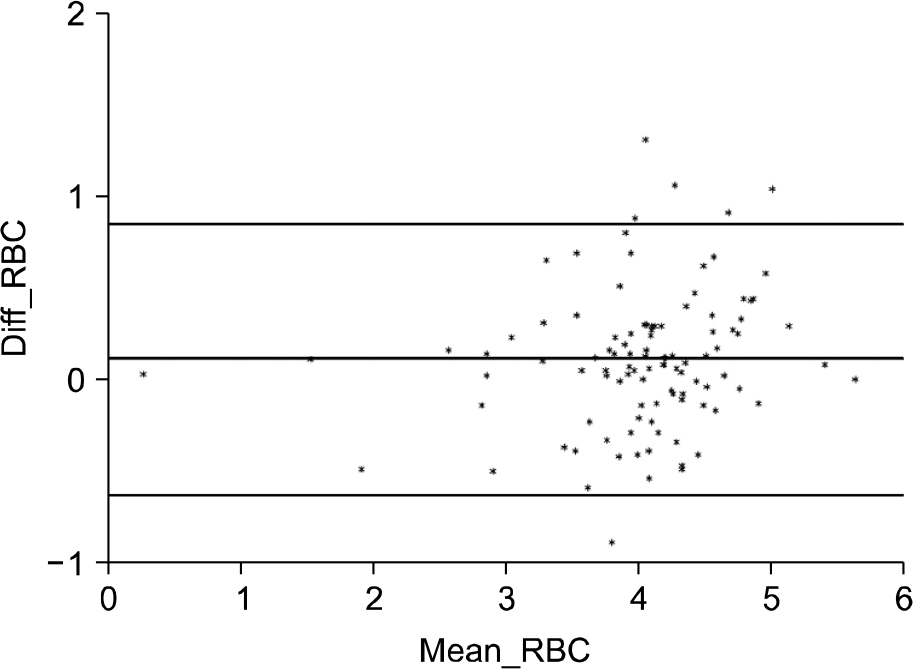
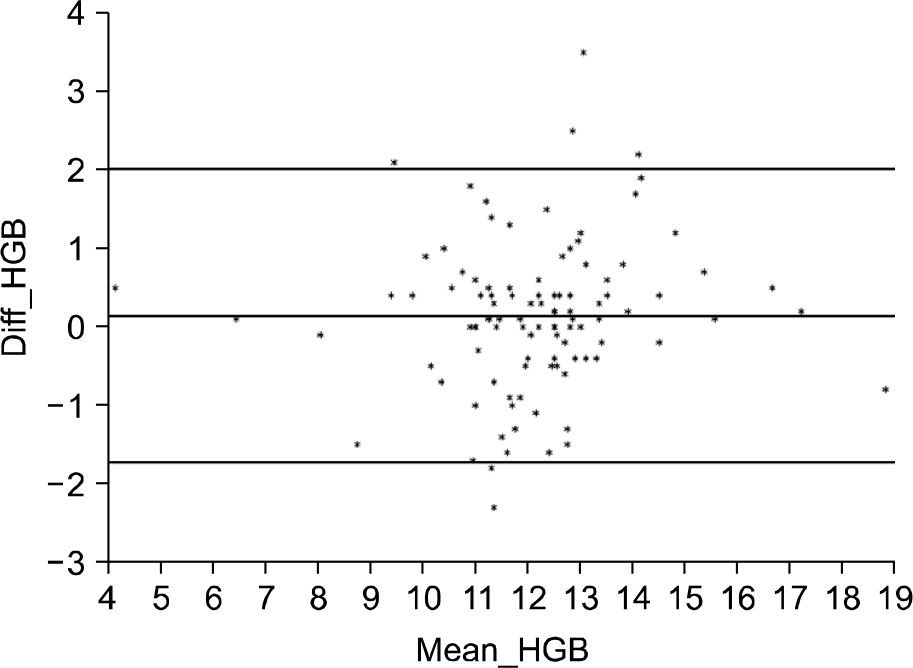
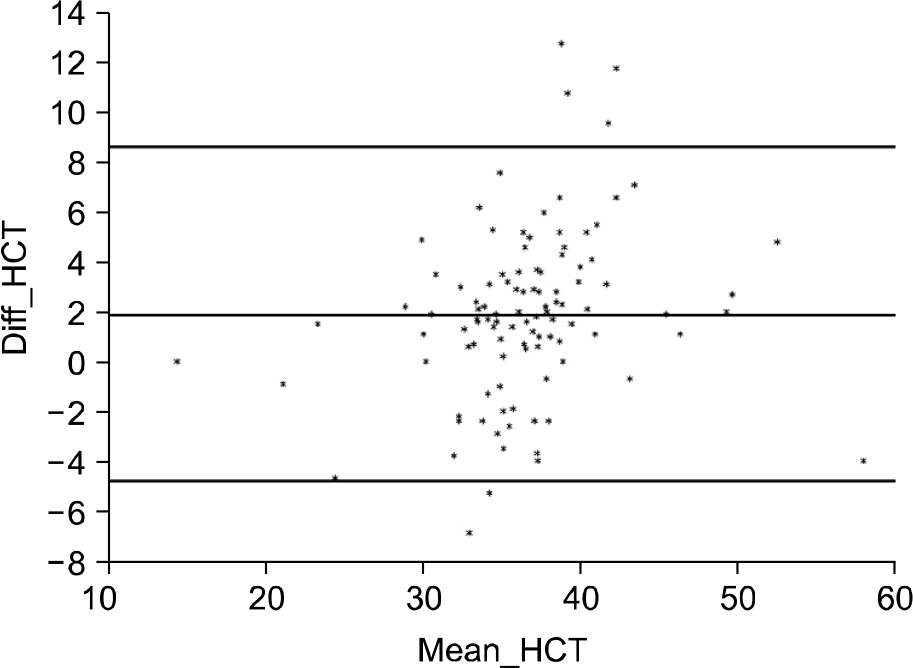
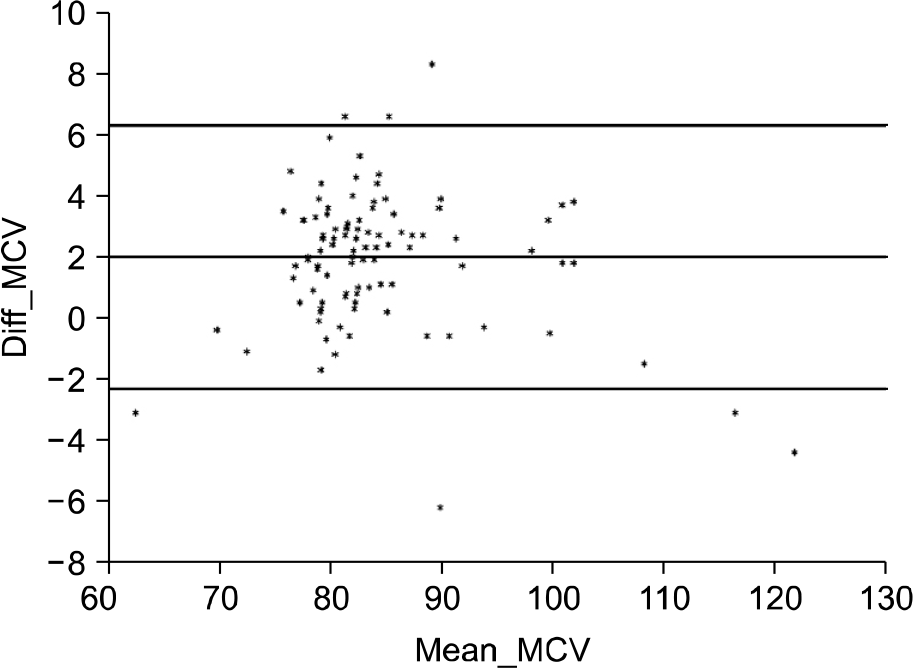
After informed consent was obtained, paired venous and capillary blood sample were collected simultaneously from 104 children (M:F=50:54). The capillary blood was analyzed using the LC-178CRPTM, and venous blood was analyzed using an automatic hematology analyzer. The following were compared from capillary and venous samples: CBC, mean corpuscular volume (MCV), mean corpuscular hemoglobin (MCH), red cell distribution width (RDW), and platelet count. The results were analyzed by Pearson's correlation and the Bland Altman Plot method.
Result
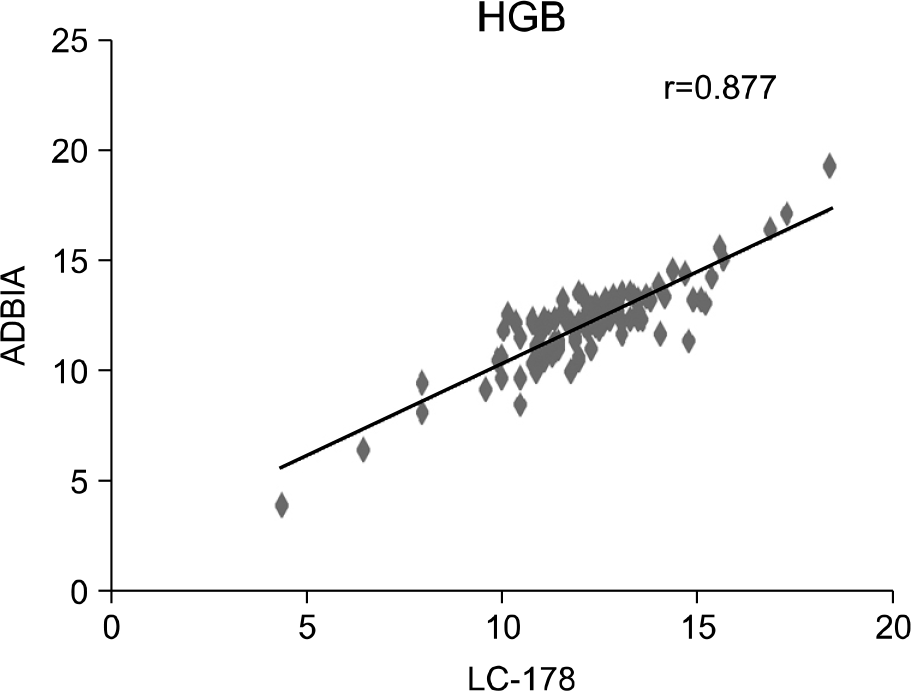
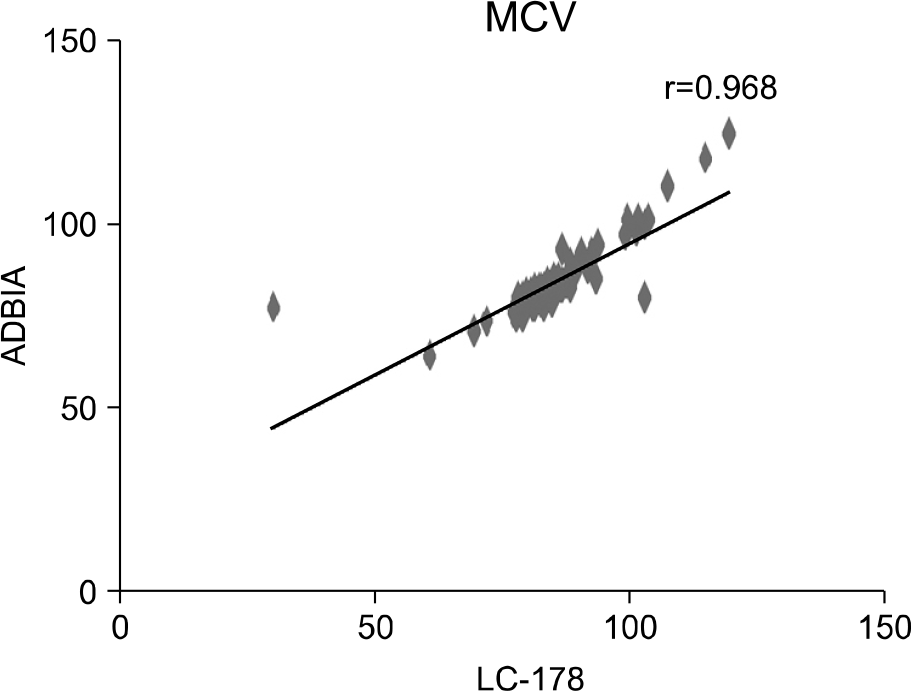
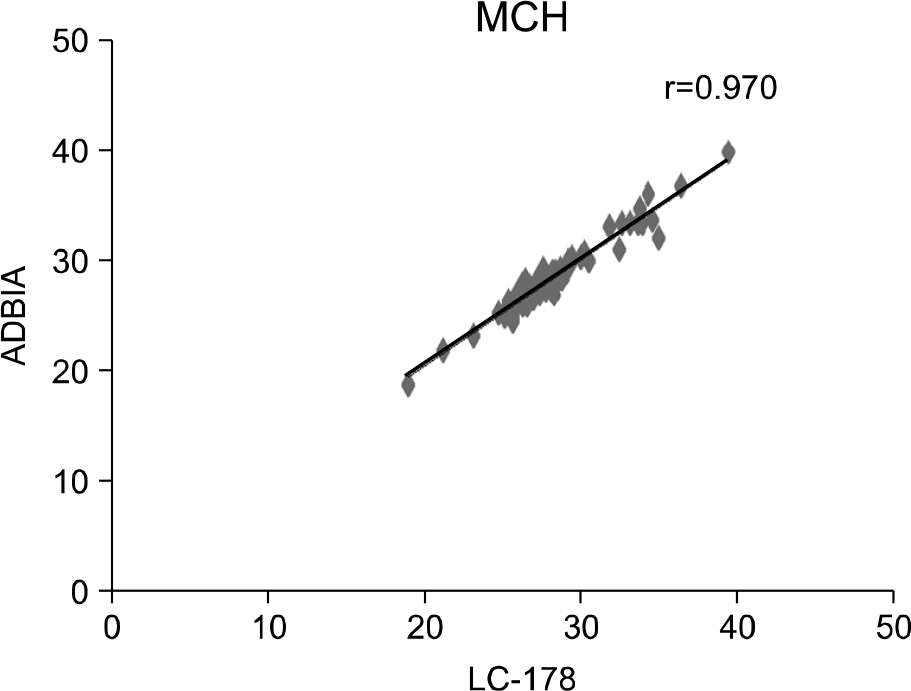
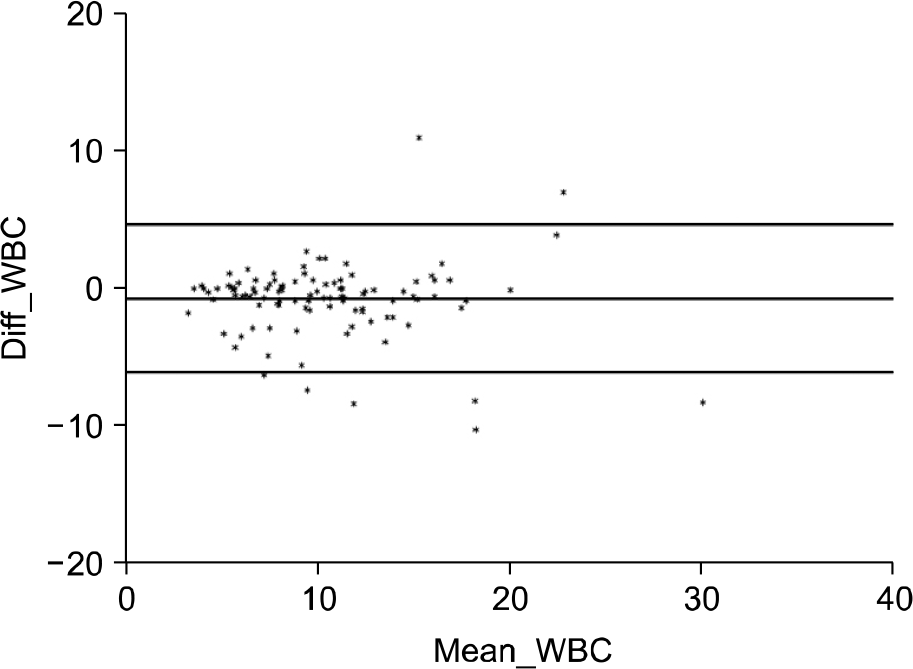
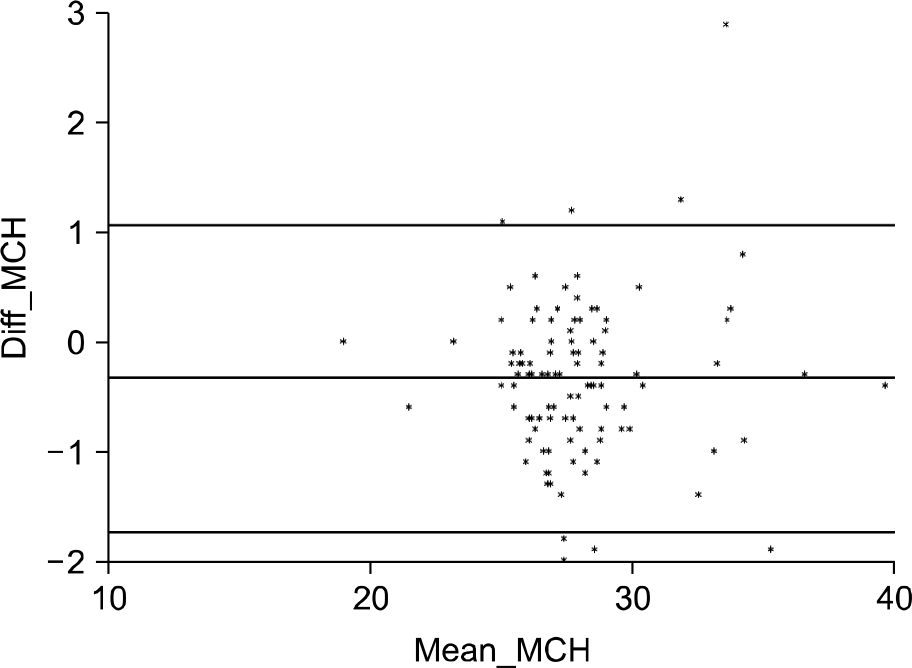
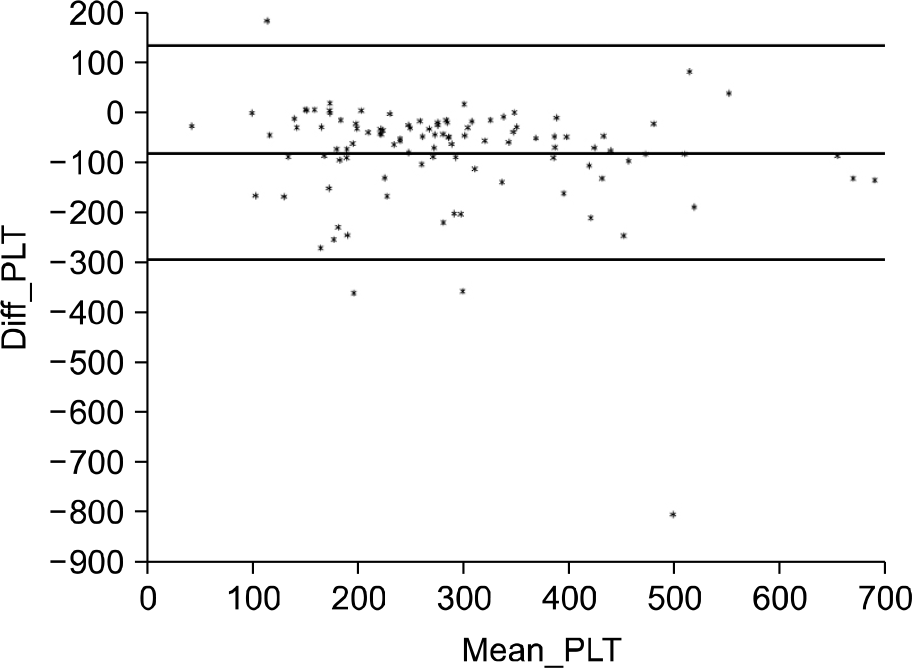
The hemoglobin values were similar between the two groups of samples and had a high coefficient correlation (r=0.877). White blood cells, hematocrit, MCV, and MCH also had a significant correlation between capillary and venous blood samples. Based on the Bland-Altman method, the agreement between the two methods was considered good.
Conclusion
The hematologic results from the capillary blood had a close correlation with the conventional venous method, including white blood cell count, and hemoglobin, MCV, and MCH levels. The LC-178CRPTM should be considered as an alternative for venous blood sampling for the tested parameters in children.
References
2. Yip R, Bikini NJ, Fleshood L, Trowbridge FL. Declining prevalence of anemia among low-income children in the United States. JAMA. 1987; 258:1619–23.

3. De Mayer E, Adiels-Tegman M. The prevalence of anemia in the world. World Health Stat Q. 1985; 38:302–16.
4. Looker AC, Dallman PR, Carroll MD, Gunter EW, Johnson CL. Prevalence of iron deficiency in the United States. JAMA. 1997; 277:973–6.

5. Oski FA, Honig AS, Helu B, Howanitz P. Effect of iron therapy on behavior performance in nonanemic iron-deficiency infants. Pediatrics. 1983; 71:877–80.
6. Idjradinata P, Pollitt E. Reversal of developmental delays in iron-deficient anemic infants treated with Iron. Lancet. 1993; 341:1–4.
7. Walter T, Kovalskys J, Stekel A. Effect of mild iron deficiency on infant mental developmental scores. J Pediatr. 1983; 102:519–22.
8. Lozoff B, Brittenham GM, Wolf AW, et al. Iron deficiency anemia and iron therapy effects on infant developmental test performance. Pediatrics. 1987; 79:981–95.

9. von Schenck H, Falkensson M, Lundberg B. Evaluation of ‘‘HemoCue,''a new device for determining hemoglobin. Clin Chem. 1986; 32:526–9.
10. Muñoz M, Romero A, Gómez JF, Manteca A, Na-veira E, Ramírez G. Utility of point-of-care haemoglobin measurement in the HemoCue-B haemoglobin for the initial diagnosis of anaemia. Clin Lab Haem. 2005; 27:99–104.
11. Yang ZW, Yang SH, Chen L, QU J, Xhu J, Tang Z. Comparison of blood counts in venous, fingertip and arterial blood and their measurement variation. Clin Lab Haem. 2001; 23:155–9.

12. Daae LN, Halvorsen S, Mathisen PM, Mironska K. Comparison between haematological parameters in capillary and venous blood from healthy adults. Scand J Clin Labo Invest. 1988; 48:723–6.
13. Daae LN, Hallerud M, Halvorsen S. A comparison between haematological parameters in ‘capillary' and venous blood samples from hospitalized children aged 3 months to 14 years. Scand J Clin Lab Invest. 1991; 51:651–4.

14. Yuan Q, Xu YR, Wang F. Comparison of multi-parameters between finger and venous blood with Coulter JT haematology analyser. Information of Henan Medicine (China). 1999; 7:42.
15. Sari M, de Pee S, Martini E, et al. Estimating the re-valence of anaemia: a comparison of three methods. Bull World Health Organ. 2001; 79:506–11.
16. Kayiran SM, Oezbek N, Turan M, Güerakan B. Significant differences between capillary and venous complete blood counts in the neonatal period. Clin Lab Haematol. 2003; 25:9–16.

17. Gómez-Simón A, Navarro-Núῇez L, Pérez-Ceballos E, et al. Evaluation of four rapid methods for hemoglobin screening of whole blood donors in mobile collection settings. Transfus Apher Sci. 2007; 36:235–42.

18. Woo HY, Park HS. C-reactive protein Simultaneous Analyzer LC-178CRPTM evaluation. Journal of Laboratory. 2005; 25:1–25.
19. Bland JM, Altman DG. Measuring agreement in method comparison studies. Stat Methods Med Res. 1999; 8:135–60.

20. Moe PJ. Hemoglobin, hematocrit, and red blood cell counts in “capillary” (skin-prick) blood compared to venous blood in children. Acta Paediatr Scand. 1970; 59:49–51.
21. Dacie JW, Lewis SM. Practical Haematology. 6th ed.London: Churchill Livingstone;2006. p. 1–6.
22. Leppänen EA. Experimental basis of standardized specimen collection: the effect of the site of venipuncture on the blood picture, the white blood cell differential count, and the serum albumin concentration. Eur J Haematol. 1988; 41:445–8.

23. Cho KH, Cho SH. Hemoglobin, hematocrit and total neutrophile in capillary blood compared to venous blood in children. Catholic Medical College. 1983; 36:713–9.
24. Park IK. Comparison of hemoglobin, hematocrit, WBC, RBC and platelets counts between capillary and venous blood in children. Korea University Graduate School Master's Thesis. 1987.
Table 1.
Hematologic values∗of capillary and venous blood in 104 children
∗ Hematologic values are indicated as the mean±standard deviation. Abbreviations: WBC, white blood cell; RBC, red blood cell HGB, hemoglobin; HCT, hematocrit; MCV, mean corpuscula volume; MCH, mean corpuscular hemoglobin; MCHC mean corpuscular hemoglobin concentration; RDW, red cell distribution width; PLT, platelet.
Table 2.
Hematologic values of capillary and venous blood according to the age distribution


 PDF
PDF ePub
ePub Citation
 Print
Print


 XML Download