

 PDF
PDF ePub
ePub Citation
 Print
Print


INTRODUCTION
Liver fibrosis is caused by an imbalance between the synthesis and degradation of extracellular matrix (ECM, especially type I and type III collagens) in response to chronic liver injury regardless of the etiology.12 The hepatic stellate cell (HSC) is now widely recognized as the principal effector of hepatic fibrogenesis.34 In addition to expressing matrix proteins, particularly type I collagen, activated HSC also expresses matrix-degrading metalloproteinases (MMPs) and the potent metalloproteinase inhibitors, tissue inhibitor of metalloproteinase 1 and 2 (TIMP-1 and TIMP-2).5
Interstitial MMPs, such as MMPs 1, 8, and 13 can degrade native type I collagen, and therefore, play a role in the resolution of liver fibrosis.6 In humans, the principal interstitial MMP is MMP-1, but it is MMP-13 in rat liver.789 TIMP-1 is the most important member of the TIMP family. It interacts with MMP-1 and MMP-13 at a ratio of 1:1 to inhibit their activity.10 The expression and the ratio of TIMP-1/MMP-1 or TIMP-1/MMP-13 involved in ECM degradation may be an important contributing factor in the pathogenesis of hepatic fibrosis.
Transforming growth factor-β1 (TGF-β1), the main cytokine involved in liver fibrogenesis, may play a key role in activation of HSC and extracellular matrix remodeling.1112 It has been reported that TNF-α and TGF-β1 may be involved in modulation of the expression of several MMPs and TIMPs.13141516 For example, Knittel, et al.13 reported that TNF-α stimulated both MMP and TIMP expression of HSCs, but TGF-β1 induced only TIMP expression. TGF-β1 may play a key role in the remodeling of the ECM by regulating TIMPs and the ratio of MMPs to TIMPs.
Thalidomide was withdrawn from the world market in the early 1960s due to its well-known tragic teratogenic effects. Thalidomide has since undergone a revival because of its anti-inflammatory effects, ability to regulate immunological reaction, and anti-oncogenic properties, which have been demonstrated in many clinical and basic trials.171819 Recently, thalidomide has been used to prevent the progression of the experimental liver fibrosis, and its curative effects have shown promise. Its mechanism was thought to be associated with the suppression of cytokines such as TNF-α.2021 However, little work has been performed on the mechanisms by which thalidomide may affect matrix degradation in liver fibrosis.
The aim of this study was to investigate the effect of thalidomide on the degradation of extracellular matrix in the carbontetrachloride-induced hepatic cirrhosis in rats and to analyze its mechanism of action.
MATERIALS AND METHODS
Animals
Sixty Wistar male rats (85-95 g) were obtained from the experimental animal center of the Hubei Academy of Medical Sciences. All animals were kept in a temperature- and humidity-controlled environment, and they received humane care with free access to standard chow and water throughout the study period.
Ethical approval
All aspects of animal research were approved by the ethics committee of the Jining First People's Hospital in compliance with the current guidelines regarding the care and use of animals in research.
Experimental design
Model and experimental rats were intraperitoneally injected with 0.2 mL/100 g sterile carbon tetrachloride (CCl4) and peanut oil at a ratio of 1:6 three times weekly for 8 weeks to induce hepatic cirrhosis. Thalidomide (Changzhou Pharmaceutical Company, Changzhou, China) was dissolved in normal saline (final concentration: 1%). The rats were randomly divided into four groups as follows (n=15): normal control, model, spontaneous recovery, and thalidomide-treated groups. The animals in the normal control group received peanut oil by intraperitoneal injection for 8 weeks, and then peanut oil was discontinued and the vehicle (normal saline) was administered daily by gavage for 6 weeks. The rats in the model group received CCl4 only for 8 weeks. The rats in the spontaneous recovery group received CCl4 for 8 weeks, and then CCl4 was discontinued and the vehicle was administered daily by gavage for 6 weeks. Thalidomide-treated rats received CCl4 for 8 weeks, and then CCl4 was discontinued and thalidomide (100 mg/kg) was administered daily by gavage for 6 weeks. Rats were killed at the end of study period and blood was obtained from the right ventricle of heart under ether anesthesia. Blood was collected in heparinized tubes without ethylene diamine tetraacetic acid (EDTA). It was then centrifuged at 1500 rpm/min for 15 min and serum was frozen at -20℃ until testing. Liver tissue from the right lobe was fixed in 40 g/L formaldehyde, embedded in paraffin, and continual sections were made. Unused liver tissue was preserved at -80℃.
Histopathological examination
Two pathologists performed the histopathological examination independently after staining the sections of the liver with hematoxylin and eosin (H&E). One slide per rat was selected and ten random fields were evaluated per slide. The Scheuer standard was used to grade the severity of the inflammation activity and fibrosis in liver.22
Serum assay
Serum hyaluronic acid (HA), laminin (LN), procollagen type III (PC III), and collagen type IV (C IV) were detected using a radioimmunoassay.
Immunohistochemistry
The expression of markers was detected in liver tissue of each surviving rat using the three-step streptavidin-biotin immunoperoxidase method. Briefly, sections were de-paraffinized and re-hydrated. They were then heated in a microwave for 10 min at 100℃ to improve antigen retrieval. Sections were then incubated in 3% hydrogen peroxide for 10 min to block endogenous peroxidase. Then, the samples were incubated for 2 h in the presence of the primary antibody (1:150) [MMP-13 (rabbit anti-rat), TIMP-1 (rabbit anti-rat), and α-smooth muscle actin (α-SMA) (mouse anti-rat), Bosider, Wuhan, China], followed by incubation for 30 min with a peroxidase-conjugated goat anti-mouse (or rabbit) secondary antibody (Bosider, Wuhan, China). The color was then developed by incubation for 3 min with diaminobenzidine (DAB kit; Bosider).
For positive cells, the cytoplasm was stained brown and the membrane was stained yellow. The sections were independently observed by two pathologists. No fewer than 5 highpower fields (400×) and no fewer than 1000 cells were counted. Then the relative number of positive cells was recorded.
Western blot analysis
The liver tissue of each surviving rat per group was analyzed using Western blot analysis. Frozen tissue (100 mg) was homogenized in 1 mL of ice-cold lysis buffer (10 mM Tris-HCl pH 7.5, 10 mM NaCl, 0.1 mM EDTA, 0.5% Triton-X, 0.02% NaN3, 0.2 mM phenylmethylsulfonyl fluoride, and 1 µg/mL each of aprotinin, leupeptin, and pepstatin). After incubation for 30 min on ice, the homogenate was centrifuged at 16000 g/min for 30 min at 4℃, and the supernatant was transferred to a new tube and stored at -80℃. Protein concentration was determined using the Bradford method with bull serum albumin as standard.23 Proteins (30 µg) from each samples were loaded on a 12% sodium dodecyl sulfonate-polyacrylamide gel and transferred to a nitrocellulose membrane at 80 mA for 2 h in a water-cooled transfer apparatus. The membrane was pre-incubated in blocking buffer [Tris-buffered saline (TBS) containing Tween and 5% non-fat dried milk] for 2 h at room temperature and then probed with a primary antibody (1:200 diluted in blocking buffer) overnight at 4℃. The membrane was washed three times with 0.1% Tween-TBS and then incubated with goat anti-rabbit or mouse IgG conjugated with horseradish peroxidase-coupled secondary antibody (Santa Cruz, Dallas, TX, USA) at a dilution of 1:2000 in the blocking buffer for 2 h at room temperature. The bands were detected using enhanced chemiluminescence. Anti-actin IgG was used at a dilution of 1:1000 to detect the expression level of β-actin in the liver tissues as a house-keeping internal control. Primary antibodies used were as follows: anti-rat TGF-β1 polyclonal antibody (Santa Cruz, CA, USA), anti-mouse β-actin monoclonal antibody (Sigma, St. Louis, MO, USA). Images were captured and the signals were quantified in arbitrary units as optical density×band area using a Vilber Lourmat image analysis system (Vilber Lourmat, Marne-la-Vallee Cedex 1, France). Data are expressed by density ratios to β-actin.
Reverse transcriptase polymerase chain reaction
Liver tissue from each surviving rat was analyzed using reverse transcriptase polymerase chain reaction (RT-PCR). Total RNA was extracted from the liver tissue using Trizol reagent (Invitrogen, Carlsbad, CA, USA) according to the manufacturer's protocol. Total RNA was dissolved in RNase-free H2O and quantified in duplicate by measuring the OD at 260 nm. Superscript II RNase Reverse transcriptase (Invitrogen) was used to reverse transcribe 1 µg of RNA, and MMP-13, TIMP-1, and TGF-β1 cDNAs were amplified on a programmed gene cycler (Biometra, Goettingen, Germany). The primer pairs used for the amplification were as follows: MMP-13 (33 cycles of 95℃ for 3 min, 95℃ for 35 s, 53℃ for 35 s, 72℃ for 40 s, 72℃ for 7 min); TIMP-1 (33 cycles of 95℃ for 3 min, 95℃ for 35 s, 51℃ for 30 s, 72℃ for 40 s, 72℃ for 7 min); TGF-β1 (35 cycles of 95℃ for 3 min, 94℃ for 35 s, 53℃ for 30 s, 72℃ for 45 s, 72℃ for 7 min); glyceraldehyde-3-phosphate dehydrogenase (GAPDH) (35 cycles of 95℃ for 3 min, 94℃ for 30 s, 53℃ for 35 s, 72℃ for 40 s, 72℃ for 7 min). The primer pairs were designed from sequences published in GenBank. The primer pairs were as follows: MMP-13 (359 bp): sense: 5'-CCC TCG AAC ACT CAA ATG GTC CCA AAC-3'; anti-sense: 5'-AGT GGC CAA GCT CAT GGG CAG CAA CAA-3'; TIMP-1 (335 bp): sense: 5'-ACA GCT TTC TGC AAC TCG-3'; anti-sense: 5'-CTA TAG GTC TTT ACG AAG GCC-3'; TGF-β1 (350 bp): sense: 5'-TGA GTG GCT GTC TTT TGA CG-3'; anti-sense: 5'-ACT TCC AAC CCA GGT CCT TC-3'; GAPDH (308 bp) sense: 5'-TCCCTCAAGATTGTCAGCAA-3'; anti-sense: 5'-AGATCCACAACGGATACATT-3'. All samples were normalized to GAPDH as an endogenous housekeeping gene. The cDNAs from all liver samples were amplified simultaneously using aliquots from the same PCR mixture. After the PCR amplification, 5 µL of each reaction was electrophoresed on 1.5% agarose gels, and stained with ethidium bromide. Images were captured, and the signals were quantified in arbitrary units as OD×band area using a Vilber Lourmat image analysis system (Vilber Lourmat). Data are expressed as density ratios to GAPDH.
Statistical analysis
Data are presented as mean±standard error of the mean (SEM). Statistical analysis was performed using one-way analysis of variance (ANOVA) followed by Student-Newman-Keuls post hoc test. In this study, the figures shown are representative of at least three experiments performed on different experimental days. Differences were considered significant at p<0.05.
RESULTS
Rat health and liver observation
At the end of experimental period 14 rats survived in the normal control group; 11 in the model group; 12 in the spontaneous recovery group; and 14 in the thalidomide-treated group.
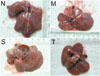
Rats in the normal control group had normal livers. In the model group, the survivors appeared anorexic, lost body weight, and their coats became dull. There were many granulo-nodules distributed on the surface of the liver. They felt tough and their edges were obtuse. In the spontaneous recovery group, the general health and livers of the surviving rats were as same as those in the model group. The rats in the thalidomide-treated group had better health than those in the model group, as indicated by good appetite, body weight, and glossy coats. There were few granulo-nodules distributed on the surface of the liver, but they became smoother than those of cirrhotic rats. Their livers felt soft and their edges were not so obtuse (Fig. 1).
Histopathology
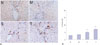
Fig. 2A shows the histopathology of the liver after H&E staining. The architecture of hepatic lobules of the normal control rats was intact, and no fibroplasia or inflammatory cell infiltration was observed. However, in the rats in the model group, the lobules of the liver were separated and surrounded by collagen fibers, producing visible pseudo-lobules. Severe necrosis and fatty degeneration of hepatocytes were widespread in the pseudo-lobules of cirrhotic livers, and inflammatory cells infiltrated the stroma extensively. The fibroplasia of the rat liver in the spontaneous recovery group was slightly less severe than in the model group, and hepatocellular necrosis was slightly less severe and slightly less widely distributed. Inflammatory cell infiltration was also slightly less pronounced in this group than in the model group. Hepatocellular necrosis and fibroplasias were significantly less severe in the livers of thalidomide-treated rats than in the model group. There were fewer fibrosepta and they were thin. There was less inflammatory cell infiltration, which improved the architecture of the hepatic lobule considerably.
The total Scheuer score was significantly higher in the model group than in the normal control group or in the spontaneous recovery group (3.80±0.33 vs. 0.30±0.16, p<0.01; 3.80±0.33 vs. 2.92±0.32, p<0.05), and the total Scheuer score in thalidomide-treated group was significantly lower than in the spontaneous recovery group (1.43±0.21 vs. 2.92±0.32, p<0.01) (Fig. 2B).
Analysis of serum markers
Serum HA, LN, PC III, and C IV in the model group was significantly higher than in the normal control group or in the spontaneous recovery group (p<0.01) and significantly lower in thalidomide-treated group than in the spontaneous recovery group (p<0.01) (Table 1).
Immunohistochemical analysis of MMP-13, TIMP-1, and α-SMA
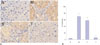
There was little expression of MMP-13 protein in normal rat livers and cirrhotic livers, and it was mainly along the sinusoid. Whereas, there was increased expression of MMP-13, distributed at the fibro-septa band, necrotic areas, and inflammatory cell infiltration in hepatic lobules in the spontaneous recovery group and livers of rats that had undergone thalidomide therapy (Fig. 3A). The ratio of the positive cells to the total cells in the model group was significantly lower than in the thalidomidetreated group or spontaneous recovery group (3.39±1.52% vs. 7.11±2.18%, p<0.01; 3.39±1.52% vs. 5.10±1.42%, p<0.01). The ratio was significantly higher in the thalidomide-treated group than in the spontaneous recovery group (7.11±2.18% vs. 5.10±1.42%, p<0.01) (Fig. 3B).
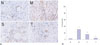
What little expression of TIMP-1 and α-SMA protein there was in normal rat livers was distributed in the hepatic sinusoid. In the cirrhotic livers, these two positive cells were mainly distributed at the fibro-septa band, area of necrosis and inflammatory cell infiltration in hepatic lobules. They were also distributed at the periantral HSC (Figs. 4A and 5A). The ratios of these two positive cells to the total cells in the model group were significantly higher than in the normal control group or in the spontaneous recovery group [TIMP-1: 70.33±5.51% vs. 3.47±1.42% (p<0.01), 70.33±5.51% vs. 57.82±4.32% (p<0.01); α-SMA: 30.23±6.25% vs. 3.02±2.18% (p<0.01), 30.23±6.25% vs. 15.23±3.29% (p<0.01)]. Thalidomide decreased those ratios significantly [TIMP-1: 4.96±1.01% vs. 57.82±4.32% (p<0.01); α-SMA: 4.08±1.43% vs. 15.23±3.29% (p<0.01)] (Figs. 4B and 5B).
Western blot analysis of TGF-β1 protein
The expression levels of TGF-β1 protein was significantly higher in the model group than in the normal control group or in the spontaneous recovery group (0.53±0.05 vs. 0.23±0.03, p<0.01; 0.53±0.05 vs. 0.46±0.04, p<0.05). There was significantly less expression of TGF-β1 in the thalidomide-treated group than in the spontaneous recovery group (0.33±0.03 vs. 0.46±0.04, p<0.01) (Fig. 6).
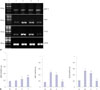
RT-PCR analysis of MMP-13, TIMP-1, and TGF-β1 mRNA
There was no significant difference in the expression of MMP-13 mRNA between the model group and the normal control group. There was significantly less expression of MMP-13 mRNA in the model group than in the spontaneous recovery group (0.18±0.02 vs. 0.23±0.03, p<0.05). There was significantly more expression of MMP-13 mRNA in the thalidomide-treated group than in the spontaneous recovery group (0.32±0.03 vs. 0.23±0.03, p<0.01) (Fig. 7).
There was significantly more expression of TIMP-1 and TGF-β1 mRNA in the model group than in the normal control group or in the spontaneous recovery group [TIMP-1: 0.48±0.06 vs. 0.16±0.03 (p<0.01), 0.48±0.06 vs. 0.40±0.05 (p<0.05); TGF-β1: 0.53±0.04 vs. 0.21±0.03 (p<0.01), 0.53±0.05 vs. 0.45±0.03 (p<0.05)]. The expression levels of TIMP-1 and TGF-β1 mRNA were significantly lower in the thalidomide-treated group than in the spontaneous recovery group [TIMP-1: 0.18±0.03 vs. 0.40±0.05 (p<0.01); TGF-β1: 0.20±0.02 vs. 0.45±0.03 (p<0.01)] (Fig. 7).
DISCUSSION
Liver fibrosis is characterized by increased hepatic deposition of ECM, which is caused by imbalance between the synthesis and degradation of ECM.24 Reversion of liver fibrosis needs to eliminate the injurious agent and redress the above imbalance.2526 Early fibrosis of the liver may be reversed after discontinuation of the injurious agent, but at its end stage liver cirrhosis, which may cause liver failure, portal hypertension and hepatocarcinoma, cannot be reversed easily. More attention should be paid to the reversal of liver cirrhosis than that of liver fibrosis. In addition to discontinuation of the injurious agent, an encouraging antifibrotic strategy might be targeted towards either reducing the rate of ECM synthesis or increasing the rate of ECM degradation.
Some trials have confirmed that thalidomide and its analogues
may inhibit acute liver injury which is the frequent trigger factor of liver fibrosis.2728 It has been reported that thalidomide may be used to prevent liver cirrhosis in animal trials.2021 Muriel, et al.20 reported that thalidomide significantly reduced the increase of aminotransferase (ALT), γ-glutamyl transpeptidase (γ-GTP), and alkaline phosphatase (ALP) prevented lipid peroxidation, prevented decreases in glycogen levels, and improved the histopathology in rat liver cirrhosis induced by CCl4. Its mechanism may be related to the anti-inflammatory, anti-TNF-α, and anti-fibrotic properties of thalidomide. It has also been reported that thalidomide can decrease portal venous pressure and increase intrahepatic resistance by reducing levels of hepatic thromboxane A2 (TXA2) and reducing the severity of hepatic microvascular disruption in rats with biliary cirrhosis.21 However, few studies have been performed on the effects of thalidomide on the matrix degradation of established liver cirrhosis.
In the present study, to confirm the effects of thalidomide on metabolism of ECM in the regression of hepatic cirrhosis, hepatic cirrhosis was induced in rats by intraperitoneal injection of CCl4. The histopathology of the liver tissue of rats treated with thalidomide showed significant improvement over untreated livers, as indicated by the lower rates of hepatocellular necrosis, inflammatory infiltration, and fibroplasias and the resolution of fibro-septa. The significant difference in the Scheuer score demonstrated that the activity of inflammation and degree of fibrosis were markedly reduced by thalidomide. The significant difference in levels of fibrotic markers such as serum HA, LN, PC III, and C IV also indicated that thalidomide had an effect. All these results indicated that thalidomide may accelerate the regression of rat liver cirrhosis by decreasing the rate of deposition of matrix. Although inter-species differences in the pharmacokinetics of thalidomide may affect the biological effects that take place in rats and humans, its curative effects on rat liver cirrhosis are encouraging and may help illuminate the mechanisms underlying thalidomide's effect on improving human liver cirrhosis in the future.
The expression of MMP-13 and TIMP-1 was assessed to study possible underlying mechanisms. These proteins may directly regulate collagen levels via matrix degradation and turnover in liver.2930 Immunochemical staining and RT-PCR analysis were used to assess the expression of MMP-13 and TIMP-1 at protein and mRNA levels. Far less expression of MMP-13 was observed in normal livers and cirrhotic livers, whereas more expression was observed in the livers of rats that had undergone thalidomide therapy than in untreated model livers, indicating that thalidomide can effectively elevate the activity of MMP-13 in liver cirrhosis. The activities of MMPs are regulated at three levels, transcription, zymogen activation, and inhibitory proteins called tissue inhibitors of metalloproteinases (TIMPs).31 TIMP-1 can inhibit most MMPs by integrating them at a ratio 1:1 to form a complex. Down-regulation of TIMP-1 activates MMPs.32 In the current study, there were few positive expressions of TIMP-1 protein distributed along hepatic sinusoid in the normal rat liver as indicated by immunochemical staining, while it was mainly distributed at the fibro-septa band, area of necrosis, and area of inflammatory cell infiltration in hepatic lobules of the cirrhotic liver. They were also distributed at the periantral HSC. There was significantly more expression of TIMP-1 mRNA and protein in cirrhotic livers than in normal livers. There was significantly less expression of TIMP-1 mRNA and protein in the livers of rats treated with thalidomide than in those of untreated cirrhotic rats. It has been reported that TIMP-1 plays a much more important role in the pathogenesis of liver fibrosis than MMP-13 does.33 It has been found that the inhibition of the expression of TIMP-1 is an effective and novel approach to the treatment of liver fibrosis.3435 The current results are consistent with previous studies which showed marked alterations in the expression of the TIMP-1 and demonstrated that the effective step in the thalidomide-induced reversal of cirrhosis might involve blockage of the expression of TIMP-1. Thalidomide may exert its effects by down-regulating deposition of ECM via discontinuation of the inhibition of TIMP-1 on MMP-13.
Some TIMP-1 is produced in Kupffer cells, HSCs, and myofibroblasts in liver, but most are produced by activated HSCs.10 TGF-β1 is an important mediator of stimulation and activation of HSCs.36 It alters the balance of collagen synthesis and degradation by increasing the rate of expression of type I collagen genes and inhibiting collagen degradation via the induction of TIMP-1.37 In order to further explore the possibility that the observed effects of thalidomide on TIMP-1 may be due to down-regulation of TGF-β1 in the current study, the expression of TGF-β1 and its relationship with TIMP-1 were examined, and we found significantly more expression of TGF-β1 mRNA and protein levels in cirrhotic livers than in normal livers, and those expression levels were markedly reduced by thalidomide. To further explore thalidomide's effect on TGF-β1 signaling pathway in liver cirrhosis, the expression of α-SMA was examined immunochemically, since the concentration of α-SMA can represent the number of activated HSCs in liver fibrosis.38 Results showed that thalidomide significantly decreased the expression of α-SMA in rat liver cirrhosis. These results indicated that the expression of TIMP-1 was strongly regulated by TGF-β1 in cirrhotic livers when treated with thalidomide, and that the changes in the expression of TIMP-1 may be attributable to thalidomide-induced changes in TGF-β1.
In conclusion, thalidomide may exert effects on the regulation of TIMP-1 and MMP-13 via inhibition of TGF-β1 signaling pathway, thereby decreasing the deposition of ECM and accelerating the regression of hepatic cirrhosis. A better understanding of the molecular events involved in this modulation could facilitate the development of novel targets for anti-fibrogenic therapy.


 XML Download