

 PDF
PDF ePub
ePub Citation
 Print
Print


INTRODUCTION
Hemophilia A (HA) and B (HB) are the most common x-linked inherited bleeding disorders, resulting from clotting factor VIII (FVIII) and factor IX (FIX) deficiency, respectively. The disease is classified as mild, moderate, or severe based on the degree of deficiency of the coagulation factor.1 Because of the hereditary pattern of hemophilia, patients are almost always male, while females can be disease carriers. The introduction of replacement therapy with plasma-derived clotting factor concentrates in the early 1970s has substantially reduced bleeding episodes, prevented musculoskeletal damage, and improved orthopedic outcomes and quality of life in patients with hemophilia.2 Even though patients with severe hemophilia entail a decreased life expectancy, the overall life expectancy of patients with hemophilia is approaching that of the general male population.3-5 Following recommended prophylactic treatment, home therapy, and comprehensive care enables hemophiliacs to enjoy a better general state of health and engage in daily activities, social events, work, and earning an education.6-8
In March 1995, Taiwan launched a mandatory National Health Insurance (NHI) program that integrated three existing health-insurance programs: labor, government employee, and farmer insurance. By the end of its first year in effect, the NHI extended coverage to 92% of the total population. By the end of 2004, the coverage had reached approximately 99% of the population, as nearly 23 million beneficiaries were enrolled with NHI.9
The NHI is a single-payer compulsory social health insurance program organized by the government and is operated by the Bureau of National Health Insurance (BNHI). The system is primarily funded by premiums collectively paid by the insured, employers, and central and local governments. In its beginnings, fee-for-service was predominantly accepted by both public and private health-care providers. The NHI program extends to patients the freedom of choice when seeking medical care and utilizes cost-sharing strategies to reduce potentially unnecessary services. Facing spiraling growth in medical costs, the payment system for the NHI changed from a fee-for-service to a global budget in 2002 in order to keep health-care costs under control without impeding the quality of care. To better manage medical expenditures and enhance the professional autonomy of medical providers, other payment methods have since been introduced, such as pay-for-performance, diagnosis-related groups, and a resource-based relative value scale system, in recent years.10
Hemophilia has been classified as a catastrophic illness by the NHI since the program was first implemented, exempting patients from a co-payment and assuring that patients are able to obtain treatment with factor concentrates. However, no studies have been published regarding the epidemiologic characteristics of hemophiliacs in Taiwan. Furthermore, examination of trends in factor concentrate use is critical to planning a reasonable budget and to improving care offered to patients with hemophilia by the BNHI.
The primary aim of this research was to determine the prevalence, incidence, and mortality rate of patients with hemophilia in Taiwan. The second aim was to assess trends in the use of FVIII and FIX in international units (IUs) per capita and IUs per person in HA or HB.
MATERIALS AND METHODS
Since implementing the NHI, the BNHI has cooperated with the National Health Research Institute, a non-profit research organization founded and sponsored by the Department of Health, to establish National Health Insurance Research Databases (NHIRDs). The national claim data first became available in 1997. A retrospective study was conducted using data from the NHIRDs for the period between January 1997 and December 2007.
Epidemiologic study
The study subjects were identified from the 1997-2007 Registries for Catastrophic Illness patient files, which included the following data: scrambled identifier, gender, diagnosis, date of birth, date of hospital application, disease severity, and date of death, etc. Each patient was identified by a single, unique code that was retained even if the patient left and later re-enrolled in the system, assuring that no patient was evaluated more than once in the study.
Prevalence (per 100000 males per year) was defined as the total number of identified male hemophiliacs in the general male population divided by the total number of the general male population in the relevant year. Incidence (per 100000 live male births per year) was defined as the number of males with hemophilia among general male newborns divided by the total number of general male newborns in the relevant year.
The crude mortality rate was expressed as the number of deaths among males with hemophilia in the cohort per 100000 person-years at risk. The age-standardized mortality rate (per 100000 males) was based on the World Health Organization (WHO) standardization weight factors.11
Standardized mortality ratio (SMR) was computed to compare the mortality rate to that of the entire Taiwan male population using the ratio of the observed-to-expected mortality. The number of expected deaths was calculated for the cohort by multiplying the number of person-years of follow-up for 5-year age categories (0-4, 5-9...80-84, 85-89, and >89 years) by the corresponding age-specific mortality rates in the general Taiwan male population and summing the results over the age groups. Age-specific mortality rates for the general Taiwan male population in 2002 were used to calculate the SMR for the study population followed between 1997 and 2007. The general male population statistics and mortality rate data were obtained from the Taiwan Ministry of Interior and Department of Health, respectively.12,13
Factor usage trend study
To analyze trends in factor concentrate usage, data were derived from the following original claim data: ambulatory care expenditures by visits (CD); inpatient expenditures by admissions (DD); details of ambulatory care orders (OO); details of inpatient orders (DO); and registry for drug prescriptions (DRUG). Insurance claims data consisted of the date of visits or hospitalization, patient demographics (scrambled identifier, gender, and date of birth), medical facility visited, ICD-9-CM diagnosis codes, procedure codes, special procedures, and details for prescription drug use. DRUGs detailed the drug code, drug name, content name, content unit, and dosage form.
FVIII or FIX usage (IUs per capita) was defined as the total number of IUs consumed divided by the total population for the relevant year. FVIII or FIX usage per patient [IUs per person with hemophilia A (PWHA) or person with hemophilia B (PWHB)] was defined as the total number of IUs consumed divided by the HA or HB subjects for the relevant year, which was similar to that reported by Stonebraker, et al.14
Statistical analysis
Descriptive statistics were reported as the mean and standard deviation to describe the distribution of data for prevalence, incidence, and factor usage. Regression analyses were performed on a yearly basis to determine the association of factor usage; the strength of the association was assessed by the correlation coefficient (R), and the slope of the regression line (S) over time was provided by a measure of annual trend. Ninety-five percent confidence intervals were calculated for mortality rate, based on Poisson's distribution. All statistical analyses were conducted using STATA software version 11.0 (StataCorp LP, Lakeway, TX, USA).15
RESULTS
General population characteristics
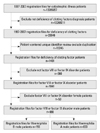
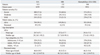
Fig. 1 is a flow chart of the enrollment of subjects included in this study. There were 988 patients with hemophilia, among which 833 patients were identified with HA and 155 patients with HB. Table 1 shows the characteristics of patients and comprises a total of 9951 person-years of observation. In this population, the ratio of HA : HB was 5.4 : 1. Hemophilia was characterized as severe in 574 patients (58.1%), moderate in 138 patients (14.0%), and mild in 276 (27.9%) individuals. Fifty-five patients died prior to the conclusion of this study in 2007, and 933 patients were still living. Of the surviving patients, 279 (29.9%) were 18 years of age or younger, while 654 (70.1%) were older than 18 years. For the surviving patients with HA, the mean age was 29.7±17.1 years, and that for surviving patients with HB was 27.2±17.7 years.
Consecutive data for the male hemophiliacs (newborns and deceased patients) are shown in Table 2. The number of hemophiliacs increased from 858 to 935 at the end of 2007. Also, 148 male newborn patients were diagnosed with HA (n=121) or HB (n=27) during the study period. The number of deceased patients [HA (n=49) and HB (n=6)] included two deceased patients in the 1997-2007 birth cohort.
Epidemiologic profile
The annual prevalence of HA (per 100000 males) increased from 6.5 in 1997 to 6.8 in 2007. The annual prevalence of HB (per 100000 males) increased from 1.2 in 1997 to 1.3 in 2007. The annual prevalence of HA+HB (per 100000 males) increased from 7.7 in 1997 to 8.1 in 2007. The mean annual prevalence (per 100000 males) was 6.7±0.1 for HA, 1.2±0.1 for HB, and 7.9±0.1 for HA+HB.
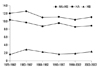
Fig. 2 shows the mean incidence of hemophilia (per 100000 live male births per year) at 5-year intervals (1978-1982, 1983-1987, 1988-1992, 1993-1997, 1998-2002, and 2003-2007) between 1978 and 2007. The mean incidence for the six consecutive periods ranged between 8.6 and 10.3 (9.3±0.7) for HA, 1.7 and 2.9 (2.1±0.5) for HB, and 10.4 and 12.6 (11.4±0.8) for HA+HB. The estimated average incidence of live male births per year was 1 in 10752 for HA, 1 in 47619 for HB, and 1 in 8772 for HA+HB.
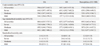
The mortality rate per 100000 person-years and SMR based on disease type of hemophilia are shown in Table 3. The overall crude mortality rate and age-standardized mortality rate for all individuals with hemophilia were 574.0 (95% CI, 528.0-622.9) and 693.3 (95% CI, 642.4-746.6), respectively. As expected, the crude mortality rate and age-standardized mortality rates were somewhat higher for patients with severe hemophilia. Among the general male population of Taiwan, the overall SMR was 1.4 for individuals with HA, and 1.3 for all individuals with hemophilia. For patients with severe hemophilia, the SMR was two times higher than that for the general male population.
Factor usage
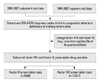
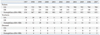
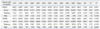
Fig. 3 summarizes factor usage data inclusion. The time-series results for FVIII and FIX usage (IUs per capita) during the period of 1997-2007 are presented in Table 4. FVIII usage (IUs per capita) increased over time, from 0.9583 in 1997 to 2.2793 in 2007 (a 2.4-fold increase). Additionally, FVIII usage (IUs per capita) of plasma-derived concentrates showed an 82% reduction to 0.1686 in 2007 beginning in 1997. At the same time, FVIII recombinant concentrate use increased to 2.1104 in 2007, a 9.2-fold increase from 1999 to 2007. FIX usage (IUs per capita) increased over time (0.2306 in 1997 to 0.4644 in 2007; a 2-fold increase). Furthermore, FIX usage (IUs per capita) of plasma-derived concentrates decreased by 40% to 0.1374 in 2007. FIX recombinant concentrate use was 0.3270 in 2007 (a 5.2-fold increase from 2002 to 2007). The mean FVIII usage was 1.5003±0.4029 and showed an annual growth of 0.1177 (IUs per capita per year), while the mean FIX usage was 0.3126±0.0904 (IUs per capita) and showed an annual growth of 0.0251 (IUs per capita per year).
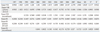
The time-series results for FVIII and FIX usage per patient (IUs per PWHA or PWHB) are presented in Table 5. FVIII usage per patient (IUs per PWHA) showed a 2.3-fold increase from 1997 (28622) to 2007 (66747). Similarly, FIX usage per patient (IUs per PWHB) increased 1.8 fold between 1999 (23684) and 2007 (70603). Moreover, additional severities analysis revealed a 2.2 increase in FVIII usage per patient (IUs per PWHA) between 1997 (47992) and 2007 (106222) for patients with severe HA; a 2.6-fold increase for those with moderate HA, from 11161 in 1997 to 28651 in 2007; and a 1.5-fold increase for those with mild HA, from 1117 in 1997 to 1696 in 2007. The mean FVIII usage per patient among those with severe HA was 72341±17298, with an annual growth of 5042 IUs per PWHA.
For patients with severe HB, FIX usage per patient (IUs per PWHB) increased 2.8 fold from 1999 (37658) to 2007 (104078). The mean FIX usage per patient for those with severe HB was 74369±18411, with an annual growth of 4923 IUs per PWHB. In those with moderate HB, FIX usage per patient (IUs per PWHB) showed a dramatic 5.1-fold increase, from 5996 in 1999 to 30741 in 2007. Notably, in those with mild HB, FIX usage per patient (IUs per PWHB) showed no difference between the years of 1997 and 2007, although usage did drop during this period.
DISCUSSION
This is the first study to report population-based data for hemophilia in Taiwan. The objectives of this study were to determine baseline epidemiologic profiles and factor concentrate usage trends for hemophiliacs in Taiwan.
Epidemiologic profile
The mean prevalence of HA (all severities) for our research database was 6.7±0.1 (per 100000 males). Similar results were obtained in Japan (5.9±0.5), Korea (5.3±0.4),16 and Hong Kong (6.4),17 all of which were slightly lower than that reported in Singapore (7.8±0.2).16 Our results demonstrated a lower prevalence that those reported in the Netherlands (11.7),18 Italy (10.0),19 United Kingdom (21.4),20 Canada (14.3),21 and the United States (10.5).22 The mean prevalence of HB (all severities) was 1.2±0.1 (per 100000 males). Similar results were also obtained in Japan (1.3±0.1)23 and Singapore (1.1±0.1),23 which were slightly higher than the results reported for Korea (1.0±0.2),23 all of which were lower than the results for Italy (2.0),19 the United Kingdom (4.5),20 and Canada (3.3).24
Recently, Stonebraker, et al.16 reported on the prevalences of hemophilia for 106 countries between 1998 and 2006. The prevalence of HA (per 100000 males), according to the World Bank classification of high income (USD 11116) or more, for the Organization for Economic Co-operation and Development (OECD) and non-OECD countries was 12.8±6.0 and 8.4±4.0, respectively. Second, the prevalence of HA was 12.9±1.5 for Canada, 9.8±2.2 for the Netherlands, and 16.8±2.9 for the United Kingdom. Third, the prevalences of HA for Asian OECD and non-OECD counties, such as Japan, Korea, and Singapore, were lower than the average prevalence, which was also obviously lower than that frequently reported in the literature pertaining to Caucasians.
Few studies22,25,26 have reported on race/ethnicity differences in hemophiliac epidemiology. The incidence of hemophilia among Chinese has been reported to be slightly lower than that in Caucasians.25 Soucie, et al.22 reported the age-adjusted prevalence of hemophiliacs to be 13.2 (per 100000 males) among white Americans, 11.0 among African-Americans, 11.5 among Hispanic males, and 4.3 among Asian/Pacific Islanders in the United States. However, the results from Soucie, et al.22 should be interpreted with caution based on the small number of cases and the variation in rates (0-15.3 per 100000 males) of Asian/Pacific Islanders in different states. Additionally, Chen, et al.26 reported that the prevalence of an intron 22 inversion in Chinese patients with severe HA was less than that reported in previous studies in Caucasian populations based on a genetic analysis. The forgoing literature has revealed interesting differences in hemophilia due to race/ethnicity, demonstrating a need for further concern for such variations.
Compared to the general male population in Taiwan, the SMR for all individuals with hemophilia and those with severe hemophilia was 1.3- and 2-fold higher than that in the general male population. Similar results were obtained in previous studies5,27 that reported on the mortality rate and causes of death in hemophiliacs after a period that posed the greatest risk of blood-borne virus transmission. Plug, et al.5 reported that among all individuals with hemophilia in the Netherlands between 1992 and 2001, the SMRs for human immunodeficiency virus (HIV)-positive and -negative individuals were 2.3 and 1.7 fold higher than that for the general male population, respectively, and these rates increased for those with severe hemophilia 5.1 and 2.8-fold, respectively. In a study of hemophilia in Italy, Tagliaferri, et al.27 reported that the SMR among all hemophiliacs decreased from 2.0 over the years of 1990 to 1999 to an SMR of 1.1 over the years of 2000 to 2007, compared to the general male population. A similar shift in SMR was seen among individuals with severe hemophilia, decreasing from 4.1 (1990 to 1999) to 3.3 (2000 to 2007).
Acquired immunodeficiency syndrome (AIDS), resulting from HIV, and liver failure, caused by hepatitis C virus (HCV), contaminated concentrates produced before 1985. The most important cause of death during the 1970s and early 1980s was indeed replaced by AIDS as the leading cause of death during the late 1980s and early 1990s in hemophiliacs.28 During the last 10 years, the effect of HCV-related end-stage liver disease on mortality has become dominant.5 Unfortunately, in this study, NHIRD did not provide access to databases on mortality data, which would have been required to study causes of death, severity, and age differences, and to conduct other outcome assessments. According to the data retrievable from Taiwan's Centers for Disease Control, 53 HIV-positive hemophilia cases have been reported to date. All of these HIV-positive individuals were diagnosed between 1984 and 1997, and 45 cases were diagnosed before 1990.29 This may be related to the use of contaminated blood concentrates in hemophiliacs before 1985 in Taiwan. The available data showed that 31 and five affected hemophiliacs died between 1984 and 200230 and 2003-2007.31 It is difficult to elucidate how many HIV-positive hemophiliacs contributed to our mortality rate results. Thus, further studies should address specific causes of death and other relevant issues.
Factor usage
Another objective of this study was to assess FVIII and FIX usage trends in Taiwan. The results of this study indicated an increasing trend in FVIII and FIX concentrate use in Taiwan.
Results for FVIII usage (1.5003±0.4029 IUs per capita) and FVIII usage per patient (44027±11532 IUs per PWHA), as an annual increase therein, were consistent with a previous report that FVIII usage (IUs per capita and IUs per PWHA) increased over time in most countries.14 Additionally, FVIII usage (IUs per capita) and FVIII usage per patient (IUs per PWHA) were similar to the mean results reported for high income non-OECD countries (1.4000±1.2381 and 47105±60130). Compared to Asian OECD and non-OECD counties, the results for mean FVIII usage (IUs per capita) was similar to those reported for Korea (1.2864±0.4170) and Hong Kong (1.4658±0.7319), slightly lower than that for Japan (1.9511±0.2272), and considerably higher than that for Singapore (0.6128±0.2129). The mean FVIII usage per patient (IUs per PWHA) results were similar to those reported in Korea (47048±14899), slightly lower than those reported in Japan (66797±6421), and considerably higher than those reported in Singapore (14940±6322).14
In general, the goals of factor replacement therapy are to prevent joint and non-joint bleeding, and, thereby, retard the onset and/or delay the progression of disease. Factor consumption and drug utilization patterns are influenced by multiple variables, such as replacement therapy patterns, dose regimen protocol, reimbursement policy, and healthcare service type. Briefly, prophylaxis is recommended as the optimal therapy for patients with hemophilia by the World Federation of Hemophilia and the WHO.32 Prophylactic therapies have been widely adopted across Europe, North America, and Japan,33,34 but has only recently been initiated in Taiwan. In this context, treatment strategies and healthcare policies vary widely between countries, which greatly impact factor usage trends and direct cross-national comparisons.
In Taiwan, prior to the implementation of the NHI program, hemophiliacs only obtained a few factor concentrates for the relief of disease progression (arthropathies, disability, and other complications). After its implementation in 1995, the NHI program guaranteed that hemophiliacs would obtain better treatment. Numerous studies have shown that factor concentrates are the single greatest source of costs for hemophilia care.35-37 Liou, et al.38 reported that factor concentrates accounted for >96.5% of the expenditures in Taiwan. Increasing the availability and use of factor concentrates has improved the quality of care for people with hemophilia in Taiwan. Unfortunately, treatment guidelines for patients with hemophilia have not been established. Moreover, further analysis showed that number of hospitals providing hemophilia care services increased from 32 hospitals in 2003 to 44 hospitals in 2007. Contrary to our expectation, the earliest hemophilia treatment center (HTC) was established in 1984 in Taiwan, and the number of HTCs and hospitals providing comprehensive care services for hemophiliacs remains small.
In addition, the mandatory NHI registry lacks data for essential clinical information, including viral infection status (HIV and HCV), immunization, treatment strategy, dose regimen, significant complications (inhibitors, liver disease, and joint disease), cause of death, and maternal carrier status. An accurate, simple, and complete registry system that ensures the quality of patient information for continued improvement of hemophilia treatment is needed.
To improve the registry, we suggest the establishment of a revised registry committee, with representatives from all key groups-patients, healthcare providers, and government representatives-who can offer different perspectives on how to achieve accuracy, simplicity, and completeness in the mandatory registry database. A user-friendly internet-based patient registry should be created to simplify data collection in the future. This could be modeled on existing successful internet-based registries, such as those for cancer or organ transplantation by the Department of Health (DOH) in Taiwan. The registry could be operated by the DOH, who could also organize an advisory board to standardize terminology, coding, and the internet platform. In addition, there should be an effort to increase the participation of hospitals, physicians, and specialized nurses who provide care and services for persons with hemophilia in providing data on newly diagnosed individuals to the registry. The Bureau of Health Promotion has promoted nationwide newborn screening services since 1985, and from 1997 to the end of 2007, the screening rates were reported to be higher than 99.5%. Newborns diagnosed with hemophilia should be referred for treatment and genetic counseling to prevent serious sequelae.
A national registry can be a dynamic tool for hemophilia care, and must be continually updated in order to remain accurate and useful. There should be policies in place to ensure that new data find their way into the registry after the set-up work is completed. The registry is also critical in the planning and evaluation of healthcare programs. Data should appear each year in a special bulletin and in an annual registry report published by the Ministry of Health. Analyses and observed trends need to be published in annual reports or in medical journals. The registry also provides a database regarding various future hemophilia research efforts.
Our study demonstrated ratios of 12.5 : 1 and 2.4 : 1 for the use of FVIII and FIX (IUs per capita) recombinant concentrates-to-plasma-derived concentrates, respectively, in 2007. Accordingly, differences in the clinical and economic impact of recombinant concentrates compared to plasma-derived concentrates, in particular, regarding the risk of inhibitor development, pharmacokinetic differences, dosage regimens, and the duration of factor support, should be the focus of more attention in the future.39-45
The main limitation of this retrospective study was the passive nature of the NHI healthcare registry for catastrophic illness data obtained for catastrophic illnesses. This study was performed based on the most recent available claim data from the NHIRD. However, as the mandatory NHI program insures >99% of the Taiwanese population, as well as all geographic regions and populations in Taiwan, the author is confident that all baseline epidemiologic profiles and factor concentrate usage trends in Taiwan were represented.
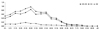
Unfortunately, further assessment of the age distribution prevalence of hemophiliacs has shown (Fig. 4) that the prevalence amongst the relatively lower age group (0-10 years and 11-20 years) likely reflected that milder cases may not have been included, although similar prevalences have been obtained in Asia countries including Japan, Korea, and Singapore. However, previous studies have shown a median age of 4 years at diagnosis for moderate patients and 14 years for patients with mild HA in the Italian registry,19 and the European/US proportions of Caucasian patients with severe hemophilia were lower than other regions, in a globe survey.46 The actual effect of this limitation on our results is unknown.
In summary, this is the first population-based study of hemophilia to date in Taiwan. This retrospective study fulfills the gap in epidemiology and factor usage trend information on hemophilia in Taiwan, and provides useful data for cross-national comparison. The mandatory NHI healthcare registry for hemophilia deserves continuous improvement. A better designed and patient-centered registry system could empower more detailed information collection and subsequent analysis.
 XML Download