

 PDF
PDF ePub
ePub Citation
 Print
Print


INTRODUCTION
The autonomic nervous system (ANS) is an important regulator of both energy balance and the cardiovascular system, and it is thought to contribute to the pathophysiology of obesity.1 Increased adiposity has been linked to decreased sympathetic responsiveness,2,3 the alteration of both sympathetic and parasympathetic activities,1,4,5 and decreased isolated parasympathetic activity.6 Decreased adiposity after weight reduction has also been associated with improved ANS function.7-12 However, differential relationships between adiposity measures reflecting overall adiposity or abdominal fat with ANS activity remain inconclusive. Considerably varied results have been reported in the studies which compared overall adiposity and abdominal adiposity with a risk of cardiovascular disease and mortality.13,14 Although the mechanisms underlying these associations are still unclear, it is thought that differences in metabolic activity between adipose tissues in visceral fat and subcutaneous fat play an important role.15 It would follow, therefore, that the relationship between adiposity and ANS activity would not be consistent for different measures of adiposity that consider abdominal versus overall adiposity.
In addition, as these relationships have been examined in a small number of case-control or cross-sectional studies,7-12 knowledge about these relationships in a large number of samples across wide range of weights and conventional cardiovascular (CV) risk factors is limited.16
The heart rate variability (HRV) has been applied to evaluate ANS function using time-domain and frequency-domain measures, and decreased HRV has been considered a risk factor of CV mortality and morbidity.5,17 As the HRV is a non-invasive and reliable method, it has been used in a variety of clinical situations including obesity. In the present study, our goal was to compare the relationships between cardiac ANS function, measured by the HRV, and three adiposity measures that reflect overall or abdominal adiposity in apparently healthy Korean adults, and to evaluate these relationships according to weight subgroup.
MATERIALS AND METHODS
Study population
A total of 1409 Korean adults (811 males, 598 females) were recruited from the Center of Health Promotion at a university hospital from January 2004 to March 2005. None of the subjects were current smokers or had a self-reported medical history of any diseases that have potential of disturbingaffect autonomic cardiac function. Informed consent was obtained from each participant. The study protocol was approved by the Institutional Review Board of the Yeungnam University Hospital.
To regulate the physiologic and environmental variations, raw ECG signals were recorded for 10 minutes in the morning and in the overnight fasting state while each subject lays quietly. They were asked to breathe normally in a quiet environment. Subjects took medical examination before the HRV assessment. ECG signals were digitized by using an analog-to-digital converter with a sampling rate of 1 KHz and were stored on a hard disk for off-line analysis (MP 150 and AcqKnowledge ver 3.5, Biopac Systems, Santa Barbara, CA, USA).
Using the method of R-peak detection algorithm from different ECG signals and preprocessing procedures, HRV was extracted and the ECG recordings including noise and non-sinus beats that were more than 1% of the total number of beats were not used for HRV extraction. Premature beats and artifacts were carefully eliminated manually by a visual inspection of all RR intervals. Stationary HRV signals of 5 minutes duration were finally adopted from each subject for a reliable analysis of HRV.18
The time domain analysis of HRV included the standard deviation of all R-R intervals (SDNN), the square root of the mean squared differences of successive normal sinus intervals (RMSSD), and the percentage of successive RR interval differences whose absolute value exceeds 50 ms (pNN50).19,20 The frequency domain analysis included the low frequency (LF) spectral power component and the high frequency (HF) spectral component. The LF was defined as the power between 0.04 and 0.15 Hz, and HF was defined as the power between 0.15 and 0.4 Hz bands under the power spectral density curve. LF to HF ratio (LF/HF) was computed.18,21,22 The SDNN presents parasympathetic activity as well as the sympathetic activity of heart function, while RMSSD reflects predominantly vagal function. The LF and HF components are considered asan index of sympathetic and parasympathetic modulation, respectively and then, the LF to HF ratio reflectsthe global sympatho-vagal balance.18,21
The body mass index (BMI) was calculated using measured body weight (kg) divided by measured height (m) in squared. The percentage of body fat mass (PBF) and waist-to-hip ratio (WHR) were measured by segmental bioelectrical impedance using eight tactile electrodes, according to the manufacturer's instructions (In Body 2.0; Biospace, Seoul, Korea).23 For metabolic CV risk factors, blood pressure (BP) and biochemical factors were assessed. To measure biochemical factors, venous blood was drawn after an overnight fast. Plasma glucose was assayed using a hexokinase enzymatic method. Serum low-density lipoprotein cholesterol, high-density lipoprotein cholesterol, and triglycerides were assayed using homogeneous and enzymatic methods. High sensitivity C-reactive protein (hs-CRP) was assayed using latex immune complex turbidimetry. BP measurements were obtained twice with a manual sphygmomanometer with the participants in the sitting position, and the average of two measurements was used for analysis.
Statistical analyses
A natural logarithmic transformation was applied to normalize the distribution of SDNN, RMSSD, LF, and HF values. We applied linear regression analyses to evaluate a linear trend in the relationships of gender-specific tertiles of SDNN with adiposity measures and metabolic CV risk factors. We computed Spearman correlations between the adiposity measures and HRV indices, and compared statistical significance of the difference between two correlation coefficients. We also compared three adiposity measures in predicting low HRV (<15 percentile vs. ≥15 percentile of each HRV measure) using receiver operating characteristics (ROC) curve analysis. We used multiple linear regression models to find associations between each HRV index and z-score of each adiposity measure after adjusting for age and gender or adjusting for age, gender, and CV risk factors. The multiple linear regression models were also used to find a linear trend of HRV index according to gender-specific WHR tertiles in weight subgroups (BMI <25 kg/m2 vs. BMI ≥25 kg/m2) after adjusting for age, gender, and CV risk factors. These analyses were performed using PASW, Statistics18 [Release 18.0.0 (30 July. 2009); SPSS Inc., Chicago, IL, USA] and MedCalc Version 11.5.1.0 (MedCalc Software, Mariakerke, Belgium).
RESULTS
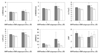
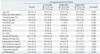
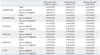
Of the 1409 subjects, 476 (33.4%) and 26 (1.8%) had BMI ≥25 kg/m2 and BMI ≥30 kg/m2, respectively. When the associations of SDNN tertile with adiposity measures and CV risk factors were evaluated, three adiposity measures and values of CV risk factors significantly decreased with increasing tertiles of SDNN (Table 1). As shown in Table 2, the inverse correlations between each adiposity measure and each HRV index were all significant. When the magnitudes of two correlation coefficients were compared, the correlations between WHR and HRV measures were generally stronger than the correlations for BMI or PBF (p<0.05). The correlations between PBF and HRV measures (SDNN, LF, and LF/HF) were even stronger than the correlations for BMI (p<0.05). The difference between adiposity measures in the relations with HRV indices was also found when ROC curves analysis was conducted to compare the three adiposity measures for predicting lower HRV (i.e., <15 percentiles vs. ≥15 percentiles of each HRV measure). WHR was more likely to predict lower SDNN, RMSSD, LF, HF, and pNN50 than BMI and PBF (p<0.05) (Table 3). In the multivariable adjusted models, the difference in the associations between the three adiposity measures and HRV measures remained. Table 4 summarizes the magnitude of change of these associations with adjustment for covariates among the three adiposity measures. After adjusting for age and gender, the magnitudes of associations between these variables were attenuated, but these associations were still significant. When the associations were further adjusted for CV risk factors, BMI was associated only with LF, but not with other HRV measures (p<0.05). By comparison, WHR and PBF consistently had independent and inverse associations with HRV indices (RMSSD, LF, and pNN50 for WHR and RMSSD, HF, and pNN50 for PBF). When the linear trend of HRV index according to gender-specific WHR tertile was evaluated in weight subgroups, SDNN, RMSSD, LF, HF, and pNN50 decreased with increasing gender-specific WHR tertiles in the overweight subgroup, but not in the non-overweight subgroup (Fig. 1).
DISCUSSION
In this large cross-sectional samples of apparently healthy Korean adults, we found that three adiposity measures reflecting either general or abdominal adiposity were differentially associated with the HRV measures. WHR was more likely than BMI or PBF to be strongly associated with almost all of the HRV indices that are thought to be modulated by both the sympathetic and parasympathetic nervous systems. In addition, these associations were significant when age, gender, and CV risk factors were considered, and they were only significant in the overweight subgroup. Increased PBF, reflecting overall fat, also appeared to be a better predictor for decreased HRV indices than BMI, which does not discriminate fat from muscle. Therefore, increased abdominal fat appeared to be an independent indicator of decreased ANS balance regardless of age, gender, and CV risk factors, particularly in the overweight subgroup. Additionally, abdominal fat is a better predictor of low HRV than overall fat.
In previous studies, associations between obesity and low HRV were reported mainly in small case-control or cross-sectional studies. Our findings extend this knowledge to a population comprised of many people of normal weight and a small subgroup of obese participants (1.8% had a BMI of >30 kg/m2). Laederach-Hofmann, et al.1 showed that BMI and WHR were inversely correlated with sympathetic activity in 42 subjects with a BMI of 28-83 kg/m2. Associations between body fat percentage and depression in sympathetic and parasympathetic activity were also found in 56 men with various percentages of body fat.4 In an another study with 44 obese patients and normal-weight controls, obese patients had HRV indices reflecting lower sympathetic activity and higher parasympathetic activity compared with non-obese controls.2 Similarly, a decrease in HRV was found in morbidly obese group compared with controls in 80 women, and significant associations between metabolic and hormonal factors and HRV measures disappeared after adjusting for body fat mass.5 It has also been suggested that HRV is reversible. In a handful of studies about change in ANS activity after weight loss in obese patients, an increase in HRV was noted after weight loss by gastroplasty,7 increased physical activity and calorie restriction,8-10 and anti-obesity medication.11
An association between abdominal fat and ANS imbalance has also been reported. Lindmark, et al.24 reported that there was a positive association between visceral abdominal fat and sympathetic/parasympathetic ratio in HRV assessment, while subcutaneous abdominal fat was not associated with HRV measures in 18 subjects, including first-degree relatives of patients with type 2 diabetes and controls. A positive association between intra-abdominal adiposity and sympathetic activity was also found among male adolescents.25
The exact mechanisms linking increased abdominal adiposity with low HRV are unclear. A plausible explanation for the association involves compartment-specific alterations in the balance of sympathetic/parasympathetic outflow. Increased parasympathetic dominance in the visceral compartment and increased sympathetic tone in the thoracic and movement compartments could contribute to the metabolic syndrome, including visceral fat accumulation.24,26
Several limitations in the present study should be considered. First, the study sample consisted of a relatively small number of obese participants, which might have led to an underestimation of the associations between adiposity and HRV measures. Second, this study had a cross-sectional design, which does not allow for an evaluation of temporal relationships. Third, HRV has been known to be very vulnerable to diurnal, postural, and emotional changes. Therefore, it is necessary to carefully adjust the data acquiring conditions to get valid HRV, though it is as short as 5 minutes. In the current study, we obtained stationary HRV by keeping the following conditions: recording ECG in the morning to be free from diurnal change; keeping supine position to make effects of posture change small; and selecting stationary 5-min segment from 10-min HRV to avoid nonstationarity. However, we might not have completely controlled conditions related to HRV such as psychological status, acute illness, and medications that could influence HRV measurements. Fourth, as we conducted this study using stationary 5-minute segment from 10-minute HRV, the current results might not extend to the findings that were derived from long-term HRV extracted from 24-hour ECG that gives some important information about long-term variability and fluctuation. However, it is not easy to acquire long-term ECG/HRV from a large population of more than 1000 subjects. Also, there has been sufficient evidence to support that this short-duration stationary HRV can reflect cardiac ANS function.18 Finally, despite adjustment for potential confounders, residual and unmeasured confounders may affect the results.
In conclusion, our data confirm an association between increased adiposity and low HRV. However, we found that the strength of association is not uniform; it is rather specific to different adiposity measures and weight subgroups. WHR and PBF are better indicators of low HRV than BMI. In addition, our data provide evidence that, irrespective of age, gender, and CV risk factors, these associations were consistent and stronger in overweight subgroup. These findings support clinical importance of abdominal obesity as a risk factor for CV disease.


 XML Download