

 PDF
PDF ePub
ePub Citation
 Print
Print


INTRODUCTION
Osteoporosis is a condition characterized by decreased bone mass and strength with increased fragility that predisposes the bone to fractures.1 Osteoporosis is most prevalent among postmenopausal women due to estrogen deficiency and is a major health problem in that population.1
Stable bone mass is maintained through the controlled balance between bone resorption and bone formation. Bone resorption is carried out by osteoclasts that originate from the monocyte-macrophage lineage.1,2 New bone is formed by osteoblasts, cells of fibroblast-stromal cell lineage that produce several bone matrix proteins and synthesize a lattice for subsequent mineralization.1,2 Osteoblasts also tightly regulate osteoclastogenesis via their expression of receptor activator of NF-κB ligand and osteoprotegerin.1,2
Hematopoiesis is the process by which multipotent hematopoietic stem cells (HSCs) generate and replenish hematopoietic precursors and mature blood cells. The HSC is the central cell to hematopoiesis; it is located in the bone marrow cavity.3 Bone marrow, the soft tissue in the cavities of bones, provides a specific microenvironment for the maintenance, proper functioning and self-renewal of HSCs.3 In addition to hematopoietic tissue, bone marrow hosts other types of tissue, such as the bone marrow stroma. It also supports hematopoiesis by providing an appropriate microenvironment and gives rise to different kinds of skeletal cells that contribute to bone remodeling.3 Within the stromal compartments, cells of osteoblastic lineage can interact with HSCs. It has been proposed that these are the main cell types responsible for regulating HSCs. They are located just next to the HSCs and support them by secreting various growth factors and adhesion molecules for hematopoiesis.4-9
In spite of this given recent progress in understanding the HSC niche through the abundant evidence supporting the linkage between osteogenesis and hematogenesis, no study showing the direct interactions between the two systems has yet been performed. Therefore, the current study was carried out to investigate the association between peripheral blood cell counts and bone mineral density (BMD), which may reflect hematopoietic and osteogenic function, respectively.
MATERIALS AND METHODS
Subjects
Of the 1,417 women who visited the Armed Forces Seoul Hospital (Seoul, Korea) for a health check-up between January 2005 and December 2009, 624 underwent BMD measurement because they wanted to check their bone health or because they agreed with doctor's recommendation for the test. Among these women, 338 healthy postmenopausal women were included in this study and the remaining 286 were excluded based on the following criteria: 1) premenopausal, 2) currently being treated with hormonal replacement therapy and/or any medication for osteoporosis (calcium, vitamin D and its derivatives, bisphosphonate or calcitonin) and/or thiazide diuretics, 3) history of hematologic disorder, liver cirrhosis, chronic renal failure, current infection or thyroid disease, which may affect peripheral blood cell counts or BMD and 4) unavailable information for the study variables. Approval for the study protocol was obtained from the Institutional Review Board of The Armed Forces Medical Commands (Seongnam, Korea). Informed consent was not obtained due to the routine nature of the information collected.
Data collection
At the hospital, a family physician performed a health check-up which included a record check for medical and medication history, and recorded information about social habits (alcohol intake, cigarette smoking and regular exercise) using a standardized questionnaire. Patients were considered to partake in alcohol when they had at least two drinks per week; they were considered to be getting regular exercise if they exercised at least three times per week for at least 30 minutes at a time. A gynecologist gathered the history of menstruation, hormonal replacement therapy and any other treatments for osteoporosis. A trained nurse measured systolic and diastolic blood pressure, body weight and height, and performed blood sampling after an overnight fast (≥12 hours). In addition to a complete blood count, serum levels of albumin, creatinine and total cholesterol were measured on the same day in every study subject.
The BMD of the lumbar spine (L1-L4), femoral neck and total proximal femur was measured by Dual energy X-ray absorpiometry (DXA) using the Prodigy Advance (GE Lunar Health Care, Madison, WI, USA). The machine was calibrated daily with a standard phantom that was provided by the manufacturer. To evaluate BMD for the lumbar spine, the mean BMD value for L1 to L4 was used, unless the individual values for one or more of these vertebrae were spuriously elevated by osteophytes or sclerotic degenerative changes. The measurements were within the precision standard of ≤1.0%. According to the WHO recommendations, T-scores were automatically calculated by software as the number of standard deviations below the average for young adults at peak bone density.10 T-scores were obtained at three different sites (lumbar spine, femoral neck and total proximal femur), and the lowest value was used as the T-score for each subject. Subjects were grouped into three categories: normal bone mass with a T-score greater than -1.0, osteopenia with a T-score between -1.0 and -2.5, and osteoporosis with a T-score of less than -2.5. All DXA measurements were performed on the same machine, by the same operator, and analyzed with the same software.
Statistical analysis
Data are presented as mean values with standard deviations or percentages. Pearson's correlation was used to determine the correlation between variables and T-scores. Simple and multiple linear regression analyses were used to estimate the association of variables of interest, including peripheral blood cell counts and T-scores. One-way analysis of variances was used to compare blood cell counts according to three groups of subjects (normal, osteopenia and osteoporosis). A two-tailed p-value of <0.05 was considered statistically significant. All data were analyzed using Statistical Package for the Social Sciences for Windows 13.0 (Chicago, IL, USA).
RESULTS
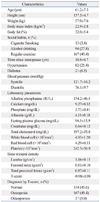
The baseline characteristics of the study participants are shown in Table 1. The mean age was 61.2±7.3 years and the mean T-score was -0.98±0.98. Time from menopause was an average of 10.8±6.7 years. The prevalences of osteopenia and osteoporosis as diagnosed by the T-score were 49.4% (n=167) and 5.0% (n=17), respectively.
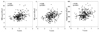
The linear correlation between peripheral blood cell counts and T-scores is shown in the scatter plots in Fig. 1. Pearson's correlation coefficients for the white blood cell (WBC) counts, red blood cell (RBC) counts, platelet counts and T-scores were 0.297, 0.266 and 0.248, respectively (all p<0.001).
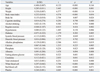
Upon simple linear regression analysis (Table 2), age, height, weight, body mass index, body fat, systolic blood pressure, alkaline phosphatase and creatinine were found to be associated with T-scores (p<0.05). The WBC, RBC and platelet counts were also significantly associated with T-scores (all p<0.001). Social habits (including cigarette smoking, alcohol drinking and regular exercise), diastolic blood pressure, serum albumin, fasting blood glucose and serum total cholesterol were not associated with T-scores (p>0.05).
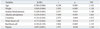
Multiple linear regression analyses were performed to determine which independent variables were associated with the BMD (Table 3). Variables that were significant (p<0.05) in the simple linear regression models (Table 2) were considered confounding factors corrected for in the multivariate analysis. Height, body mass index and body fat were not taken into account in the analysis because of eventual problems with multicollinearity.11 As expected, a significant linear correlation was observed between T-scores and age, body weight and alkaline phosphatase (p<0.001). Systolic blood pressure and serum creatinine were also associated with T-scores (p<0.05). The WBC (β=0.127; standard error=0.043; p=0.014), RBC (β=0.192; standard error=0.139; p<0.001) and platelet (β=0.097; standard error= 0.001; p=0.050) counts maintained a significant association with T-scores.
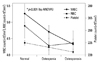
Fig. 2. shows the mean values of peripheral blood cell counts according to the three groups of subjects by BMD (normal, osteopenia and osteoporosis). The blood cell counts decreased gradually along with the BMD (p<0.001), indicating a positive relationship between blood cell counts and bone density.
DISCUSSION
The results of the present study indicate that peripheral blood WBC, RBC and platelet counts are independently associated with BMD in Korean postmenopausal women. This is the first report to show a significant relationship between peripheral blood cell counts and BMD. These findings support a possible linkage between bone metabolism and hematopoiesis. As we did not perform any studies to look into the mechanisms, elucidating the exact mechanism by which decreased blood cell counts are associated with decreased BMD was difficult in this study. Nonetheless, we can suggest possible several explanations for our results, as described below.
Osteoblasts, the main cells involved in the formation of bone, play a central role in hematopoiesis.4 Osteoblasts are located at the endosteal bone surface, which is located just next to the HSCs in the bone marrow.4,9 They control HSC survival and differentiation by producing various hematopoietic growth factors, such as interleukin (IL)-6, IL-7, c-kit ligand, granulocyte macrophage colony-stimulating factor, stromal cell-derived factor-1, and macrophage inflammatory protein-1.12,13 They also express adhesion molecules such as integrins and N-cadherins, which are known to have hematopoietic progenitor-binding properties that facilitate the interactions between osteoblasts and HSCs, resulting in an increase in the number of HSCs in the bone marrow.14,15 An important role for osteoblasts in the regulation of HSCs was demonstrated by a series of ex vivo studies,5,6,16 and in vivo evidence of the role of osteoblasts in hematopoiesis has been provided by studies of targeted ablation of osteoblasts.8,17 The mice deficient in Cbfa1/Runx2, a transcription factor crucial for osteoblast progression, did not develop osteoblasts and had empty bone marrow, showing that osteoblasts are required to initiate bone hematopoiesis.17 In addition, loss of osteoblasts was associated with a dramatic reduction of bone marrow cellularity that resulted in extramedullary hematopoeisis, consistent with the loss of the ability of the bone to support hematopoiesis.8 Moreover, enhanced signaling of the parathyroid hormone (PTH)/PTH-related peptide receptor in osteoblasts was reported to be associated with an increase in osteoblast numbers and enhanced bone marrow HSC cellularity.4 The results of these studies provided convincing support for the direct role of osteoblasts in adult hematopoiesis. Therefore, bone metabolism and hematopoiesis appear to be closely associated and directly linked by osteoblast activity.
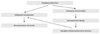
In addition, there are structural changes of the bone marrow that may cause stem cell dysfunction during hematopoiesis. Loss of bone mass leads to a disruption of the micro-architecture of the bone marrow, and the marrow space is replaced with fat tissue instead of HSCs.18,19 An in vitro study showed that the mesenchymal stem cells, the osteoblast precursor cells, from osteoporotic patients had decreased function when compared to similar cell types from normal subjects, and the cells had a higher adipogenic expression capacity.20,21 Therefore, bone marrow stem cell disorders can be associated with bone loss and inappropriate hematopoiesis. Although the cause and effect relationship is not known, these findings are consistent with our assumption that bone loss and bone marrow stem cell dysfunction are closely linked. Our theories are plainly illustrated in Fig. 3.
There have been several studies showing the association between BMD and certain types of peripheral blood cell counts. As a marker of protein nutrition and immune system activation, lymphocyte count had a positive linear association with BMD in postmenopausal women.22,23 In this study, however, there was no significant association between lymphocyte counts and BMD (data not shown). A study conducted by Laudisio, et al.24 showed that hemoglobin levels were positively associated with BMD in the elderly, and that anemia is one of the risk factors for decreased BMD, which was consistent with our results. However, their study did not explain the exact mechanisms of reduced BMD in participants with low hemoglobin levels.
In our study, together with WBC count, serum creatinine was also significantly associated with BMD upon multiple regression analysis, which was consistent with the findings of a previous report,25 which indicated a relationship between renal dysfunction and bone metabolism.
The BMD is influenced by many factors such as age, body weight, co-morbid conditions, and current use of medications and biochemical markers,1,26-29 some of which can influence blood cell counts. For example, aging not only causes bone loss but also impairs bone marrow hematopoietic function30 and decreases blood cell count. To minimize the effects of these potential confounders and to show the independent association between blood cell counts and BMD, subjects with these factors were excluded from study participation and multiple regression was used to adjust for these factors.
Besides lacking study of the mechanisms, this investigation has several other limitations. Given that the data in this study was obtained using a cross-sectional design, there is the possibility of a temporal association between blood cell counts and BMD. Longitudinal studies are needed to better characterize the relationship between blood cell counts and BMD. In addition, calcium and vitamin D intake or serum 25(OH)D3 level were not analyzed, and these may have had an effect on BMD. Moreover, the absence of parathyroid hormone (PTH) level data is another limitation of this study. PTH affects both bone density and bone marrow hematopoiesis.4 Data for PTH levels related to BMD and blood cell counts might provide additional information to aid in the understanding of the association between bone marrow stem cell function and BMD. Furthermore, other potential confounders including bone fracture history, reproductive history, income level, education background and calcium intake (all known to affect BMD in Korean adults31) were not considered in this study. Lastly, only postmenopausal women were included, so the findings cannot reliably applied to the general population.
In conclusion, the results of this study show a positive relationship between blood cell counts and BMD in Korean postmenopausal women. The study results suggest that there may be a close relationship between hematopoiesis and bone formation. Peripheral blood cell counts are easily obtained in any clinical setting, and may, at least in part, play a role as a putative marker of bone density, especially in postmenopausal women. Further investigations are needed to clarify the underlying mechanisms and explain this association.
 XML Download