

 PDF
PDF ePub
ePub Citation
 Print
Print


INTRODUCTION
The medial sural cutaneous nerve (MSCN), peroneal communicating nerve (PCN), and sometimes the lateral sural cutaneous nerve (LSCN) are known as the major contributors to the formation of the sural nerve (SN).1-8 The MSCN starts from the branch of the tibial or sciatic nerve at the midline of the popliteal fossa. It descends between the two heads of the gatrocnemius and pierces the deep fascia proximally in the leg. The PCN arises from the common peroneal nerve near the head of the fibula and crosses the lateral head of the gastrocnemius to join the MSCN and form the SN. The SN is a pure sensory nerve except for the unmyelinated autonomic fibers. It supplies the posterolateral aspect of the leg, the lateral malleolus, and the lateral side of the foot. The integrity of the SN can be assessed by the sensory nerve conduction study.9,10 The SN has important diagnostic value in tissue biopsy, nerve grafting, and for the neurophysiologic evaluation of the diverse causes of peripheral neuropathies.7-13
Previous studies have focused on the anatomical aspects of the diverse variations in the MSCN, LSCN, PCN, and the SN.2-6 There has been some debate concerning its contribution. In one report,14 the MSCN was reported to be the main contributor of the SN. However, other studies15,16 have reported that the diameters of the LSCN and PCN are larger than that of the MSCN. Herein, we attempted to evaluate the relative contribution of the MSCN and PCN (or LSCN) to the SN by conducting a sensory nerve conduction study.
MATERIALS AND METHODS
Subjects
After the Institutional Review Board approved the experimental protocol, a total of 47 subjects were recruited through advertisement and personal invitation. All the subjects gave their informed consent. The exclusion criteria were: age under 18 yrs, history of toxic and metabolic diseases (including diabetes and thyroid disease), compression neuropathy, symptoms of numbness, tingling or abnormal sensation, and radiculopathy or back surgery. The subjects underwent a standard physical examination for neuromuscular disorders (motor, sensory, and deep tendon reflex testing). All of the volunteers passed the above criteria for inclusion in the study. Their age, sex, weight, and height were recorded, and their body mass index (BMI, kilograms per square meter) was calculated. The demographic characteristics of the subjects are summarized in Table 1.
Experimental protocol
The SN conduction studies were performed in the supine position. Stimulation was applied to the lateral malleolus. The stimulation was done with a constant current stimulator. A rectangular wave stimulus with 0.1-ms duration was applied. Stimulus intensity was gradually increased and adequately controlled to obtain the maximal signal from each nerve. These signals were averaged 10 to 20 times.
The active recording electrode was placed at the midline or slightly lateral to the midline of the calf, 14 cm proximal to the stimulation site. The reference electrode was placed 4 cm proximal to the recording electrode. The ground electrode was placed between the stimulating and recording electrodes.
For the MSCN conduction study, stimulation was applied at the active recording site of the sural nerve. The recording electrode was placed at the midline, 14 cm proximal to the stimulation site. For the PCN, the stimulation site was the same as that used for the MSCN, and the recording electrode was placed 14 cm proximal on an imaginary line running from the stimulation site to the posterior part of the head of the fibular bone. The reference electrode was placed 4 cm proximal to the recording electrode.
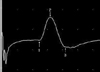
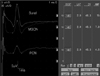
The sensory nerve recording was performed with the following equipment settings: sensitivity, 5 uV/division; low frequency filter, 20 Hz; high frequency filter, 2 KHz; and sweep speed, 1 ms/division. All studies were performed with a Key Point unit (Medtronic Co, Skovlunde, Denmark) and surface electrodes (Medtronic Co, Skovlunde, Denmark). The automated selections of the onset latency, peak latency, peak to peak amplitude, and area under the curve were captured and recorded. In some cases, minor corrections on the onset and peak latencies were made. The following measurements were recorded from the elicited waveforms: onset latency, negative peak latency, negative to positive peak amplitude, and area (area under the curve from onset to positive peak) (1, 2).
The skin surface temperatures were measured over the calf area with a YSI thermometer (YSI incorporated, Yellow Springs, Ohio, USA). Both legs were warmed with a hydrocollator pack for 10-20 minutes before the nerve conduction. The skin temperatures were strictly kept above 32℃ and the room temperature was maintained in the range of 23-25℃.
The orthodromic technique was used in this study for the following reasons. First, it is less influenced by the thickness of skin and subcutaneous tissue at the 3 recording sites than the antidromic method routinely used for the SN conduction studies. Secondly, it provides more similar conditions for all of the recordings.
The composition ratio of the MSCN was measured by dividing the amplitude, or area of the MSCN, by the sum of the amplitudes of the MSCN and the PCN.
Composition ratio of the MSCN by amplitude = Amplitude of the MSCN/Sum of the amplitudes of the MSCN and PCN
Composition ratio of the MSCN by area = Area of the MSCN / Sum of the areas of the MSCN and PCN
Statistical methods
The results are presented as mean ± standard deviation (SD). The data were compared by t-test (side-to-side differences), and the Pearson's correlation coefficient (between the SN and the sum of MSCN and PCN in terms of area and amplitude) was calculated. The level of significance was taken as p < 0.05. The statistical analysis was conducted using SPSS ver. 12 software (SPSS Inc., Chicago, IL, USA).
RESULTS
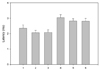
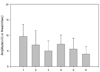
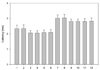
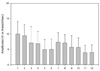
In six subjects, the PCN response was absent unilaterally. The results for the onset and peak latencies are presented in Fig. 3, and the amplitude and area results are shown in Fig. 4. The side-to-side differences in latency and amplitude were found to not be statistically significant (p > 0.05, t-test) (Fig. 5, 6). The BMI showed a weak negative correlation with the area and amplitude of the SN, MSCN, and PCN with limited statistical significance (Table 2).
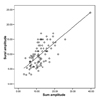
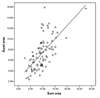
Correlations were calculated between the sum amplitude and sum area of the MSCN and PCN with respect to those of the SN. Strong, statistically significant correlations were found (amplitude r = 0.69 and area; r = 0.66, p < 0.01) (Fig. 7, 8). The comparison of contributions by the MSCN and PCN to the SN is shown in Table 3. Their relative contributions were 1.37:1 (amplitude) and 1.42:1 (area), according to the sensory NCS.
DISCUSSION
Classically, the SN is formed by the joining of the MSCN and the PCN, or by the MSCN or PCN alone.1,3-5,7 Sometimes, the LSCN becomes the PCN and then joins with the MSCN. The SN runs slightly obliquely downward, crosses the lateral border of the tendo-calcaneus, passes behind and below the lateral malleolus, approaches the peroneal muscle tendons, and crosses the dorso-lateral aspect of the foot.
The proportion of subjects in which the SN is conjoined with both the MSCN and PCN varies from 60% to 93%.1,3,5,8,15 The site of the union was observed to be in the distal third of the leg in 84% of cadavers by Coert and Dellon,3 in the lower half of the leg in 75% by Huelke,5 in the distal third of the leg by Strauch B et al.,7 and in the upper two third of the leg in 60% by Aktan Ikiz ZA et al.1 The mean length of the SN after anastomosis with the MSCN and PCN (or LSCN) was about 16 cm from the site of the union to the lateral malleolus.4,7 Mahakkanukrauh P and Chomsung R16 reported that the mean length was 14.4 cm and Aktan Ikiz ZA et al.1 reported that it was 13.2 ± 6.9 cm.
There had been some debate on the contribution of the SN. Hill HL et al. had reported that the main contributor to the SN is the MSCN. However, they did not compare the diameter or contribution rate.14 A review of anatomic studies suggests that the size of the MSCN is larger than that of the PCN or LSCN.5,8 However, Ortiguela ME et al. reported the mean proximal diameters of the MSCN, LSCN, PCN, and the SN in 20 cadaver limbs to be 1.0-1.5, 1.0-1.5, 1.5-3.0, and 2.5-4.0 mm, respectively.15 The mean distal diameters of the MSCN and the PCN were 1.5-1.6 and 2.5-3.0 mm, respectively. In the report by Mahakkanukrauh P and Chomsung R, the diameters of the MSCN, LSCN, and SN were 2.41 ± 0.05, 3.22 ± 0.09, and 3.61 ± 0.07 mm, respectively, in 76 Thai cadavers.16
We want to disclose the relative physiologic contributions using a sensory nerve conduction study. Although there is some debate concerning the presence of motor components,17 the sural nerve has been regarded as a pure sensory nerve.12 It has been known that the externally recorded SNAP amplitude and area reflect the number of large fiber axons activated in the peripheral nerve.18,19 These results raise the possibility that the contribution ratio can be determined by analysis of the SNAP in these nerves.
Buchthal F and Rosenfalk A stimulated digits individually and then simultaneously (with the orthodromic conduction technique) and recorded the sensory nerve action potential (SNAP) over the median nerve at the wrist.20 They established that the SNAP amplitude increased with the number of digits and corresponding digital nerve branches. It is also known that the increase in SNAP amplitude is not directly correlated to doubling the number of additional nerve fibers.20,21 In our study, both the sum SNAP amplitude and area of the MSCN and PCN were larger than those of the SN (128% for the amplitude, 139% for the area).
The relative contributions of the MSCN and PCN (or LSCN) to the SN in our neurophysiologic study were found to be 1.37:1 (amplitude) and 1.42:1 (area) according to the NCS. These findings are more consistent with previous anatomic studies.3,5,14 However, in 29 out of 88 limbs (in 6 limbs, 32.9%, there were no SNAPs in the PCN) in our study, the contribution of the PCN (or LSCN) was greater than that of the MSCN.
The majority of previous SN conduction studies were performed using the antidromic conduction method. It has been known that the orthodromic and antidromic techniques are equivalent with respect to the onset and peak latency but not in respect to amplitude.19,21 The amplitude of the antidromic responses, when recorded with surface electrodes, is generally larger than orthodromic potentials because the recording electrodes are closer to the subcutaneous neural tissue. However, in our preliminary study with the antidromic method, the motor artifact from the tibial and peroneal nerves hindered the precise analysis of the signals in the proximal conduction study (MSCN and PCN). Therefore, the relative physiologic contributions among the SN, MSCN, and PCN (or LSCN) were compared with the same conduction method using the orthodromic conduction technique.
The MSCN and PCN (or LSCN) were stimulated at a position 14 cm proximal to the lateral malleolus. The active recording electrodes were placed on the proximal side following the path of the MSCN and PCN. The reference electrode was placed 4 cm apart from the active electrode. However, considering the anatomical variations indicated in previous reports, we were unable to rule out the possibility that the NCS values obtained from the PCN might not exactly reflect values obtained from the LSCN. For example, in some cases, the LSCN acts as the PCN and directly unites with the MSCN to form the SN.1,5,8
Temperature has been known to be one of the most profound factors influencing nerve conduction studies.10,19,20,22,23 With surface recording electrodes within physiological temperature ranges (21-31℃), the SNAP showed a progressive linear increase in latency, amplitude, duration, and area with decreasing temperature.20,22 The sodium channel opening and closing time can be delayed by temperature decrease at the nodes of Ranvier. The propagation of action potentials is salutatory in the myelinated nerve fiber. Decreased temperature results in an increase in the amount of time necessary to reach the action potential's peak at each node of Ranvier. As more time is required at each node, the cooler nerve should have a slower conduction velocity over comparable segments of nerve at different temperatures.19 At high temperatures, these basic events essentially take place in reverse. Channel activation and deactivation occur quickly, shortening the length of time the channel is open. The charge influx is reduced, and the resulting action potential is of smaller amplitude. The velocity also increases.24 We strictly maintained the skin temperature to over 32℃ in order to decrease the effect of temperature variability and reduce the intensity of stimulation for obtaining the maximal SNAP. As a result, the onset and peak latencies in this study were shorter than those found in previous studies.25,26 However, the results of other skin temperature controlled studies27,28 were similar to those of our study. Most of the subjects' skin temperatures were 34-35℃. This thermal effect improved the conduction velocities.
To evaluate the effects of the obesity, we measured the body mass index (BMI) of the subjects. The BMI showed negative correlations with limited statistical significance, because our volunteers were not significantly overweight (Table 2). Therefore, one aspect of the volume conductor effect was reduced.
In our nerve conduction study, the PCN (or LSCN) was absent in 6 cases (6.6%). This was similar to or less than other observed rates of PCN absence.1,3,5 In the case of nerve grafts and tissue biopsies, the proper selection of the size and the site is critical. The SN is the most frequent site of the nerve graft and peripheral nerve biopsy.7,11-13 However, sacrificing the sural nerve causes clinical problems. Dyck et al.11 reported that one year after nerve biopsy, 10% of subjects had a greater degree of pain and paresthesia. Ruth et al.28 also reported chronic pain (29.8%) and persistent sensory loss (72.3%) after nerve biopsy. In order to reduce such complications, Ortiguela et al. reported that the PCN (or LSCN) can be a good substitute for the SN.15 In our study on physiologic contributions, it was found that not only the PCN (or LSCN) but also the MSCN can be a better substitute for nerve graft or biopsy than the SN. The proper usage of sensory NCS can be a helpful guide in determining the site for nerve graft, without complete sacrifice of the SN.


 XML Download