

 PDF
PDF ePub
ePub Citation
 Print
Print


INTRODUCTION
It was reported that 40% of patients are undernourished and 34% are overweight.1 Malnutrition remains a largely unrecognized problem in hospitals and highlights the need for education on clinical nutrition.1 The importance of a clinical and empirical assessment of the protein energy malnutrition (PEM) is without question. Only recently, the relationship between the nutrition status and the hospital course and the risk of complications and/or death, has been studied, even though most clinicians subjectively feel that malnutrition increases the risk to surgical patients.
The serum proteins with shorter half-lives than albumin have been examined as potential indicators of malnutrition. Several studies have suggested that there are strong correlations between malnutrition and the serum protein such as albumin, transferrin and prealbumin.2-4 Readily available laboratory tests that are indicators of a current and changing nutrition status include the urinary nitrogen excretion and prealbumin. More recently, prealbumin has become the most frequently assayed protein in assessing PEM staus.5,6 Because prealbumin has a relatively short plasma half-life of 2.5 days, it is expected that instant changes in response to PEM and therapy can occur. However, there is little data correlating the prealbumin level with the patient's outcome in literatures.
The aim of this study was to evaluate the serum prealbumin level as a sensitive indicator of the effectiveness of nutrition support and as a prognostic indicator in critically ill patients.
MATERIALS AND METHODS
This study enrolled the patients with their total parenteral nutrition (TPN) supplied for more than 7 days selected from the general intensive care unit (ICU) patients under the nutrition support team (NST) care for 9 months from November 2002 through June 2003.
In our hospital, the NST is a multidisciplinary team that includes doctors, nurses, pharmacists and dietitians. The indication for parenteral nutrition (PN) is a nonfunctioning gastrointestinal tract in a patient who requires nutrition support, such as peritonitis, intestinal obstruction, intestinal hemorrhage, intractable vomiting, paralytic ileus, severe pancreatitis, stool output ≥ 1 L/day, high-output entero-cutaneous fistula, (≥ 500 ml/day or tendency to increase) and short bowel syndrome. In addition the anticipated duration of PN is at least 7 days.
There were patients whose prealbumin level had been measured more than twice. The serum prealbumin, albumin and total lymphocyte count (TLC) were measured at the first day of nutrition support by NST and at the 7th day of nutrition support care. The patients were classified into two groups according to the change in the prealbumin level. Group 1 (N=31) comprised of patients whose prealbumin level increased and Group 2 (n=13) included those whose prealbumin level decreased. The two groups were compared according to the criteria such as the nutrition status, the nutrition requirement and supply amount, biochemical data, hospital days, ICU days and mortality. The nutrition status of the patients was assessed according to the ICD-9-CM malnutrition code definition.7
Data was collected from the NST follow-up sheet produced by the team for monitoring the patients receiving NST care as well as by the medical records for mortality, hospital days and ICU days. The difference in the parameters between the groups was analyzed by a t-test. A two-tailed p value ≤ 0.05 was considered significant. The calculations were performed using SPSS for windows 9.01 (SPSS Inc. Chicago IL.)
RESULTS
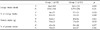
There was no significant difference in the basic characteristics of the two groups, such as age, height, weight, body mass index (BMI) and APACHE II score (Table 1). There were also no significant differences in the main diagnosis and nutrition status between the two groups (Table 2, 3). The most common diseases in both groups were infection and gastrointestinal failure. Thirty-four out of 44 patients had an adequate to mild nutrition insufficiency status. There was no significant difference in the protein and energy supply between the two groups.
Previously, when the patients were admitted to the ICU, the physicians supplied nutrition to their patients without consulting the NST. On average, the quantity of calories and proteins in both groups supplied only 55% (Group1) and 52% (Group 2) of the patients' requirement. After NST care for one week, the patients were provided more than 80% of their nutritional demand. It took an average 5 days for the physician to consult the NST after the patients had been admitted to the ICU (Table 4).
In Group 1, the biochemical parameters such as albumin, TLC were significantly higher. In Group 2, the TLC was significantly lower (p < 0.05) (Table 5). However, there were no statistical differences between the groups in terms of mortality as a prognostic indicator (p=0.673). In addition, hospital day and ICU day as another prognostic indicators were similar in the two groups (Table 6).
DISCUSSION
Malnutrition is an alteration in the body composition in which deficiencies in the level of macronutrients results in a reduced body cell mass, organ dysfunctions, and an abnormal serum chemistry value. Nutrition support plays a vital role in the prevention and treatment of nutritional deficiencies in appropriately selected, at risk, critically ill patients.8,9
The use of the serum protein levels for nutritional assessment is well established. The relationship of serum albumin concentration ≤ 3.5 g/dl to an increased morbidity and mortality in medical and surgical patients is well documented.10,11 However, it has also been suggested that a biochemical assessment is a less reliable marker of the nutrition status. The albumin concentrations slowly respond to protein restriction and are more a reflection of the patient's illness than the nutritional intake. Prealbumin is more sensitive, with a short half-life, but it might be elevated during chronic inflammation and be reduced with a current ion deficiency. It is known that prealbumin responds to the nutritional intake but is also affected by the disease process.1
Prealbumin responds quickly to the onset of malnutrition and rises rapidly with the adequate protein intake. In the patients who receive optimal nutrition support, the prealbumin level may increase 4 mg/dl per week.12
Several studies have reported that patients with low prealbumin levels have a shorter length of stay in hospital stay and fewer complications, lower morbidity and possibility mortality, if they are given either intravenous or oral hyperalimentation.5,13,14 However, this study could not find any significant difference in the amount of nutrition support and the prognosis of these patients with an increased serum prealbumin level compared to the patients with a decreased serum prealbumin level. This means that a change in the serum prealbumin level did not sensitively respond to nutrition support and was good prognostic indicator in critical ill patients.
The reason for why the prealbumin does not respond sensitively to nutrition support may be explained as follows. Sometimes, a change in prealbumin does not reflect the nutrition intervention of the patients. At the same time, an evaluation in prealbumin levels in many, if not most, cases may represent many other factors that may result in reducing levels. Indeed, malnutrition per se is a fairly uncommon cause of a reduced prealbumin level, particularly in developed countries. Probabley the most common cause of the low level is the acute phase response, whether it is due to acute or chronic inflammation or tissue necrosis as observed in trauma and malignancy patients. Inflammatory cytokines reduce the level of prealbumin synthesis by the liver. Hemodilution and extravascular space expansion due to inflammation or other causes also play a prominent role.15 As a consequence of these facts, prealbumin should not be used to monitor the adequacy of nutrition during the acute stress phase. However it dose not mean that the information provided by the prealbumin level is not valuable.
There are several reasons why nutrition support did not contribute to the patient's outcome.
First, as shown in Table 3, the nutrition status of most enrolled patients was not bad.
Patients obtaining the desired effect from nutritional support are most likely those with baseline malnutrition or in those with a protracted period of starvation. In well-nourished persons with a short period (< 1 week) of nil per os status, it is very difficult to demonstrate an improvement in outcome with nutrition support. Second, patients who received TPN had a higher mortality rate than was expected in this study. The mortality rate of this institution at APACHE score 16 to 18 was 10% in another study. In this study, the patients had similar APACHE II scores on ICU admission but their mortality rate was approximately 45%.
One of the possible explanations is that the APACHE II score system does not encompass the bowel function. The fact that patients who received TPN had bowel failure might have been underestimated. However, it would be difficult to reflect the effect of nutrition support in critically ill patient with a mortality approaching 45%. Third, it was reported that if adequate nutrition support were delayed, the patients' outcomes would deteriorated. The data, comparing those who started adequate nutrition support in less than 5 days with those who started after 5 days showed that the mortality and complication were markedly increased in the delayed nutrition support group.16 In our cases, adequate nutrition support was begun at the 5th ICU day. It probably decreased the effectiveness of the nutrition support in critical ill patients. Fourth, the prealbumin level as an indicator of nutritional intervention would be measured serially. Mittman et al. reported that for each 1 mg/dl increase in the serum prealbumin level at enrollment, there was a 9% decrease in the relative risk of death in hemodialysis patients.17 This study investigated the relationship between the patient's outcome and the initial change in the prealbumin level at the entry period of nutrition support. If the following nutrition intake did not meet the change in the patient's requirement, the mortality might have become higher. In addition, approximately half of the patients were in Group 1, whose second prealbumin level was still under the normal range (≤ 160 mg/L). However, they did show an increasing trend in the prealbumin level, but they probably did not reach the normal range. Therefore, it is difficult to regard our comparison on the outcome of the two groups as a comparative result reflecting the effect of nutrition support.
It was reported that the inclusion of prealbumin in an admission screening panel identified 44% of patients at nutritional risk, who would have been missed if evaluated by the serum albumin level alone.18 Some authors have recommended monitoring the prealbumin and C-reactive protein (CRP) levels to monitor the acuity of the inflammatory response. When the CRP level is at its height, the prealbumin level is likely to be at its nadir. The fall in the CRP level should start if the nutrition support is adequate.19
This study found that at the initial period of the intensive care unit, the serum prealbumin level did not respond to nutrition support sensitively the increase in the prealbumin level did not indicate a better prognosis in critically ill patients. More study on the relationship between the long-term results and the serial change in the prealbumin level with the patient's outcome.


 XML Download